Estimated zip code population in 2022: 6,178 Zip code population in 2010: 4,970 Zip code population in 2000: 2,650
Houses and condos: 3,129 Renter-occupied apartments: 425
% of renters here:
18%
State:
28%
March 2022 cost of living index in zip code 83455: 90.0 (less than average, U.S. average is 100)
Land area: 115.7 sq. mi. Water area: 0.3 sq. mi.
Population density: 53 people per square mile
(very low).
OSM Map
General Map
Google Map
MSN Map
OSM Map
General Map
Google Map
MSN Map
OSM Map
General Map
Google Map
MSN Map
OSM Map
General Map
Google Map
MSN Map
Please wait while loading the map...
Real estate property taxes paid for housing units in 2022:
This zip code:
0.3% ($2,590)
Idaho:
0.5% ($1,995)
Median real estate property taxes paid for housing units with mortgages in 2022: $2,378 (0.4%) Median real estate property taxes paid for housing units with no mortgage in 2022: $4,740 (0.4%)
Business Search- 14 Million verified businesses
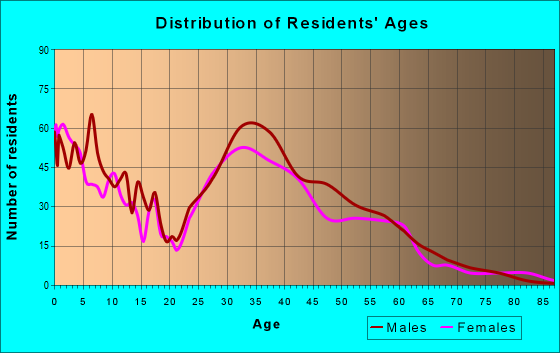
Males: 3,389
(54.9%)
Females: 2,788
(45.1%)
For population 25 years and over in 83455:
High school or higher: 98.3%
Bachelor's degree or higher: 59.3%
Graduate or professional degree: 11.6%
Unemployed: 1.2%
Mean travel time to work (commute): 32.6 minutes
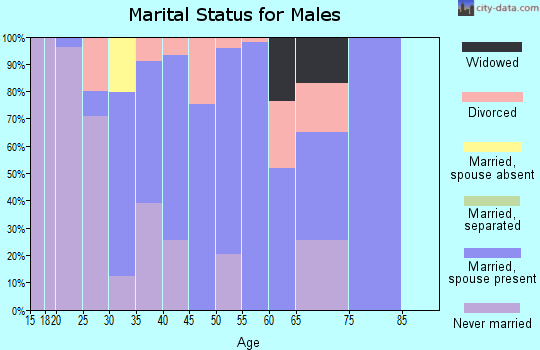
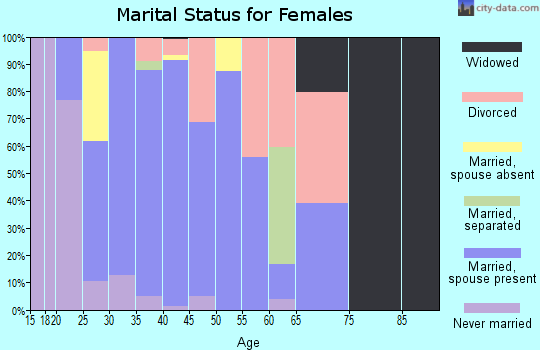
For population 15 years and over in 83455:
Never married: 28.7%
Now married: 56.7%
Separated: 0.5%
Widowed: 4.8%
Divorced: 9.3%
Zip code 83455 compared to state average:
Median household income above state average.
Median house value above state average.
Unemployed percentage below state average.
Black race population percentage significantly below state average.
Renting percentage below state average.
Length of stay since moving in above state average.
House age significantly below state average.
Number of college students significantly below state average.
Percentage of population with a bachelor's degree or higher above state average.
Estimated median house/condo value in 2022: $762,353
83455:
$762,353
Idaho:
$432,500
According to our research of Idaho and other state lists, there were 2 registered sex offenders living in 83455 zip code as of May 21, 2024. The ratio of all residents to sex offenders in zip code 83455 is 2,718 to 1. The ratio of registered sex offenders to all residents in this zip code is much lower than the state average.
Median resident age:
This zip code:
37.7 years
Idaho median age:
37.5 years
Average household size:
This zip code:
2.6 people
Idaho:
2.6 people
Averages for the 2020 tax year for zip code 83455, filed in 2021:
Average Adjusted Gross Income (AGI) in 2020: $83,618 (Individual Income Tax Returns)
Here:
$83,618
State:
$73,627
Salary/wage: $60,308 (reported on 84.6% of returns)
Here:
$60,308
State:
$55,245
(% of AGI for various income ranges: 1391.8% for AGIs below $25k, 4152.7% for AGIs $25k-50k, 7524.3% for AGIs $50k-75k, 9921.3% for AGIs $75k-100k, 18353.2% for AGIs $100k-200k, 63608.0% for AGIs over 200k)
Taxable interest for individuals: $1,485 (reported on 29.7% of returns)
This zip code:
$1,485
Idaho:
$2,230
(% of AGI for various income ranges: 26.1% for AGIs below $25k, 19.2% for AGIs $25k-50k, 34.7% for AGIs $50k-75k, 82.7% for AGIs $75k-100k, 95.9% for AGIs $100k-200k, 1054.0% for AGIs over 200k)
Ordinary dividends: $7,009 (reported on 25.6% of returns)
Here:
$7,009
State:
$7,088
(% of AGI for various income ranges: 68.9% for AGIs below $25k, 70.8% for AGIs $25k-50k, 192.0% for AGIs $50k-75k, 331.3% for AGIs $75k-100k, 471.4% for AGIs $100k-200k, 4026.0% for AGIs over 200k)
Net capital gain/loss in AGI: +$37,894 (reported on 25.6% of returns)
Here:
+$37,894
State:
+$37,284
(% of AGI for various income ranges: 58.9% for AGIs below $25k, 37.5% for AGIs $25k-50k, 250.7% for AGIs $50k-75k, 880.0% for AGIs $75k-100k, 1550.0% for AGIs $100k-200k, 39694.0% for AGIs over 200k)
Profit/loss from business: +$13,549 (reported on 26.3% of returns)
Here:
+$13,549
State:
+$12,955
(% of AGI for various income ranges: 235.0% for AGIs below $25k, 316.9% for AGIs $25k-50k, 518.7% for AGIs $50k-75k, 643.3% for AGIs $75k-100k, 957.7% for AGIs $100k-200k, 4602.0% for AGIs over 200k)
Taxable individual retirement arrangement distribution: $26,050 (reported on 7.5% of returns)
83455:
$26,050
Idaho:
$20,110
(% of AGI for various income ranges: 63.4% for AGIs below $25k, 84.0% for AGIs $25k-50k, 145.7% for AGIs $50k-75k, 364.7% for AGIs $75k-100k, 793.6% for AGIs $100k-200k, 3596.0% for AGIs over 200k)
Total itemized deductions: $38,363 (reported on 11.3% of returns)
Here:
$38,363
State:
$38,402
(% of AGI for various income ranges: 219.6% for AGIs $25k-50k, 397.3% for AGIs $50k-75k, 606.7% for AGIs $75k-100k, 1284.5% for AGIs $100k-200k, 11054.0% for AGIs over 200k)
Charity contributions: $16,410 (reported on 7.9% of returns)
Here:
$16,410
State:
$18,314
(% of AGI for various income ranges: 11.6% for AGIs below $25k, 52.3% for AGIs $50k-75k, 106.7% for AGIs $75k-100k, 329.1% for AGIs $100k-200k, 4708.0% for AGIs over 200k)
Taxes paid: $7,127 (reported on 11.3% of returns)
83455:
$7,127
State:
$7,596
(% of AGI for various income ranges: 38.5% for AGIs $25k-50k, 95.3% for AGIs $50k-75k, 166.0% for AGIs $75k-100k, 349.5% for AGIs $100k-200k, 1298.0% for AGIs over 200k)
Earned income credit: $1,837 (reported on 10.2% of returns)
Here:
$1,837
State:
$2,195
(% of AGI for various income ranges: 59.5% for AGIs below $25k, 48.8% for AGIs $25k-50k)
Percentage of individuals using paid preparers for their 2020 taxes: 94.4%
Here:
94%
State:
94%
(% for various income ranges: 94.2% for AGIs below $25k, 92.4% for AGIs $25k-50k, 95.7% for AGIs $50k-75k, 95.8% for AGIs $75k-100k, 95.5% for AGIs $100k-200k, 94.1% for AGIs over 200k)
Averages for the 2012 tax year for zip code 83455, filed in 2013:
Average Adjusted Gross Income (AGI) in 2012: $54,584 (Individual Income Tax Returns)
Here:
$54,584
State:
$52,536
Salary/wage: $44,624 (reported on 87.0% of returns)
Here:
$44,624
State:
$41,938
(% of AGI for various income ranges: 74.3% for AGIs below $25k, 83.1% for AGIs $25k-50k, 85.0% for AGIs $50k-75k, 78.3% for AGIs $75k-100k, 74.1% for AGIs $100k-200k, 35.4% for AGIs over 200k)
Taxable interest for individuals: $1,400 (reported on 31.6% of returns)
This zip code:
$1,400
Idaho:
$1,874
(% of AGI for various income ranges: 1.2% for AGIs below $25k, 0.8% for AGIs $25k-50k, 0.6% for AGIs $50k-75k, 0.4% for AGIs $75k-100k, 0.6% for AGIs $100k-200k, 1.4% for AGIs over 200k)
Ordinary dividends: $7,847 (reported on 18.1% of returns)
Here:
$7,847
State:
$5,706
(% of AGI for various income ranges: 1.8% for AGIs below $25k, 1.8% for AGIs $25k-50k, 1.4% for AGIs $50k-75k, 1.9% for AGIs $75k-100k, 2.4% for AGIs $100k-200k, 5.7% for AGIs over 200k)
Net capital gain/loss in AGI: +$7,297 (reported on 18.6% of returns)
Here:
+$7,297
State:
+$14,571
(% of AGI for various income ranges: 0.2% for AGIs below $25k, 1.2% for AGIs $25k-50k, 0.9% for AGIs $50k-75k, 1.6% for AGIs $75k-100k, 2.2% for AGIs $100k-200k, 7.5% for AGIs over 200k)
Profit/loss from business: +$7,652 (reported on 27.1% of returns)
Here:
+$7,652
State:
+$10,113
(% of AGI for various income ranges: 14.2% for AGIs below $25k, 4.4% for AGIs $25k-50k, 2.0% for AGIs $50k-75k, 4.9% for AGIs $75k-100k, 2.9% for AGIs $100k-200k)
Taxable individual retirement arrangement distribution: $14,942 (reported on 6.8% of returns)
83455:
$14,942
Idaho:
$14,642
(% of AGI for various income ranges: 4.4% for AGIs below $25k, 1.2% for AGIs $50k-75k, 1.8% for AGIs $75k-100k, 4.2% for AGIs $100k-200k)
Total itemized deductions: $23,724 (27% of AGI, reported on 42.4% of returns)
Here:
$23,724
State:
$22,697
Here:
26.8% of AGI
State:
22.0% of AGI
(% of AGI for various income ranges: 17.2% for AGIs below $25k, 15.6% for AGIs $25k-50k, 18.3% for AGIs $50k-75k, 22.3% for AGIs $75k-100k, 19.4% for AGIs $100k-200k, 17.2% for AGIs over 200k)
Charity contributions: $4,557 (reported on 31.6% of returns)
Here:
$4,557
State:
$5,246
(% of AGI for various income ranges: 1.4% for AGIs below $25k, 1.7% for AGIs $25k-50k, 2.1% for AGIs $50k-75k, 2.5% for AGIs $75k-100k, 2.7% for AGIs $100k-200k, 4.7% for AGIs over 200k)
Taxes paid: $6,661 (reported on 41.8% of returns)
83455:
$6,661
State:
$7,139
(% of AGI for various income ranges: 2.4% for AGIs below $25k, 3.0% for AGIs $25k-50k, 4.2% for AGIs $50k-75k, 5.3% for AGIs $75k-100k, 6.0% for AGIs $100k-200k, 7.9% for AGIs over 200k)
Earned income credit: $2,053 (reported on 18.1% of returns)
Here:
$2,053
State:
$2,213
(% of AGI for various income ranges: 5.5% for AGIs below $25k, 1.1% for AGIs $25k-50k)
Percentage of individuals using paid preparers for their 2012 taxes: 65.5%
Here:
66%
State:
52%
(% for various income ranges: 61.8% for AGIs below $25k, 64.4% for AGIs $25k-50k, 66.7% for AGIs $50k-75k, 70.6% for AGIs $75k-100k, 70.6% for AGIs $100k-200k, 100.0% for AGIs over 200k)
Averages for the 2004 tax year for zip code 83455, filed in 2005:
Average Adjusted Gross Income (AGI) in 2004: $39,225 (Individual Income Tax Returns)
Here:
$39,225
State:
$42,679
Salary/wage: $31,932 (reported on 87.6% of returns)
Here:
$31,932
State:
$35,636
(% of AGI for various income ranges: 282.2% for AGIs below $10k, 81.5% for AGIs $10k-25k, 82.8% for AGIs $25k-50k, 80.9% for AGIs $50k-75k, 71.8% for AGIs $75k-100k, 41.5% for AGIs over 100k)
Taxable interest for individuals: $1,473 (reported on 38.4% of returns)
This zip code:
$1,473
Idaho:
$2,024
(% of AGI for various income ranges: 16.9% for AGIs below $10k, 2.7% for AGIs $10k-25k, 1.3% for AGIs $25k-50k, 1.7% for AGIs $50k-75k, 0.4% for AGIs $75k-100k, 0.9% for AGIs over 100k)
Taxable dividends: $2,450 (reported on 19.8% of returns)
Here:
$2,450
State:
$2,917
(% of AGI for various income ranges: 4.8% for AGIs below $10k, 1.3% for AGIs $10k-25k, 1.3% for AGIs $25k-50k, 0.6% for AGIs $50k-75k, 1.0% for AGIs $75k-100k, 1.7% for AGIs over 100k)
Net capital gain/loss: +$20,109 (reported on 20.2% of returns)
Here:
+$20,109
State:
+$13,146
(% of AGI for various income ranges: -4.8% for AGIs below $10k, 1.3% for AGIs $10k-25k, 1.5% for AGIs $25k-50k, 5.3% for AGIs $50k-75k, 6.5% for AGIs $75k-100k, 29.8% for AGIs over 100k)
Profit/loss from business: +$5,632 (reported on 28.9% of returns)
Here:
+$5,632
State:
+$8,765
(% of AGI for various income ranges: 47.4% for AGIs below $10k, 10.2% for AGIs $10k-25k, 4.7% for AGIs $25k-50k, 4.0% for AGIs $50k-75k, 1.4% for AGIs $75k-100k, 1.1% for AGIs over 100k)
IRA payment deduction: $3,275 (reported on 4.2% of returns)
83455:
$3,275
Idaho:
$3,020
Total itemized deductions: $18,971 (30% of AGI, reported on 42.1% of returns)
Here:
$18,971
State:
$18,385
Here:
29.9% of AGI
State:
23.1% of AGI
(% of AGI for various income ranges: 65.0% for AGIs below $10k, 17.6% for AGIs $10k-25k, 20.5% for AGIs $25k-50k, 22.6% for AGIs $50k-75k, 20.8% for AGIs $75k-100k, 18.2% for AGIs over 100k)
Charity contributions deductions: $4,461 (7% of AGI, reported on 33.6% of returns)
Here:
$4,461
State:
$3,875
Here:
6.5% of AGI
State:
4.6% of AGI
(% of AGI for various income ranges: 2.8% for AGIs $10k-25k, 2.5% for AGIs $25k-50k, 3.1% for AGIs $50k-75k, 4.4% for AGIs $75k-100k, 6.0% for AGIs over 100k)
Total tax: $4,868 (reported on 72.5% of returns)
83455:
$4,868
State:
$6,282
(% of AGI for various income ranges: 14.8% for AGIs below $10k, 5.0% for AGIs $10k-25k, 5.5% for AGIs $25k-50k, 6.8% for AGIs $50k-75k, 8.5% for AGIs $75k-100k, 16.2% for AGIs over 100k)
Earned income credit: $1,570 (reported on 14.7% of returns)
Here:
$1,570
State:
$1,660
Percentage of individuals using paid preparers for their 2004 taxes: 65.7%
Here:
66%
State:
59%
(% for various income ranges: 57.3% for AGIs below $10k, 64.7% for AGIs $10k-25k, 64.0% for AGIs $25k-50k, 73.6% for AGIs $50k-75k, 71.6% for AGIs $75k-100k, 82.8% for AGIs over 100k)
Household received Food Stamps/SNAP in the past 12 months: 19 Household did not receive Food Stamps/SNAP in the past 12 months: 2,332
Women who had a birth in the past 12 months: 65 (47 now married, 17 unmarried) Women who did not have a birth in the past 12 months: 1,380 (906 now married, 483 unmarried)
Housing units in zip code 83455 with a mortgage: 1,421 (69 second mortgage, 17 home equity loan, 52 both second mortgage and home equity loan) Houses without a mortgage: 23
Median monthly owner costs for units with a mortgage: $1,853 Median monthly owner costs for units without a mortgage: $900
Residents with income below the poverty level in 2022:
This zip code:
6.3%
Whole state:
10.7%
Residents with income below 50% of the poverty level in 2022:
This zip code:
3.8%
Whole state:
6.1%
Median number of rooms in houses and condos:
Here:
5.7
State:
6.5
Median number of rooms in apartments:
Here:
4.0
State:
4.4
Notable locations in this zip code not listed on our city pages
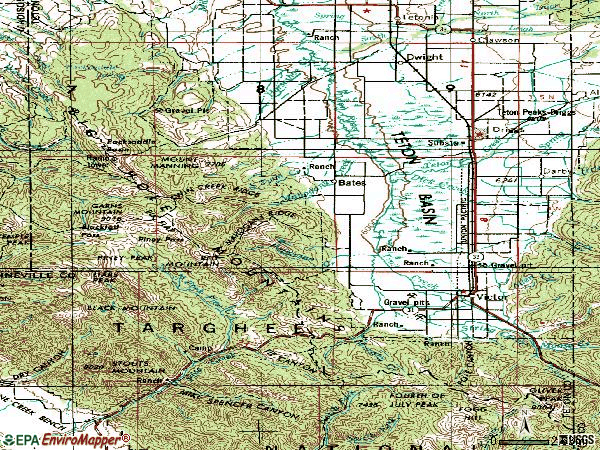
Notable locations in zip code 83455: Pine Creek Campground (A), Fox Creek West Access Area (B), Fox Creek East Access Area (C), Mike Harris Camnpground (D), Teton County Fire Protection District Station 2 (E). Display/hide their locations on the map
Streams, rivers, and creeks: Moose Creek (A), Blacktail Creek (B), Patterson Creek (C), Murphy Creek (D), Mike Harris Creek (E), Trail Creek (F), Warm Creek (G), Lookingglass Creek (H), Little Pine Creek (I). Display/hide their locations on the map
1,347 married couples with children.
249 single-parent households (13 men, 236 women).
90.9% of residents of 83455 zip code speak English at home.
8.5% of residents speak Spanish at home (61% very well, 26% well, 13% not well).
0.3% of residents speak other Indo-European language at home (100% very well).
Foreign born population: 332 (5.4%) (38.9% of them are naturalized citizens)
This zip code:
5.4%
Whole state:
6.0%
78%Honduras
12%Lithuania
4%Uganda
1%Guyana
15%American
12%German
6%Irish
6%English
4%Polish
4%Scottish
2%Norwegian
Year of entry for the foreign-born population
1202010 or later
542000 to 2009
1231990 to 1999
89Before 1990
Facilities with environmental interests located in this zip code:
ASPEN GROVE SUBDIVISION (UNPAVED ROAD (NO STREET NAME) in VICTOR, ID)
National Pollutant Discharge Elimination System NON-MAJOR (Tracking pollutant discharge elimination systems) - permit - ICIS-, ENFORCEMENT/COMPLIANCE ACTIVITY Business SIC classification: GENERAL CONTRACTORS-SINGLE-FAMILY HOUSES
DAVIS PROPERTY RESIDENTIAL (871 CALDERWOOD in VICTOR, ID)
HAZARDOUS WASTE BIENNIAL REPORTER (Resource Conservation and Recovery Act (tracking hazardous waste)) (Resource Conservation and Recovery Act (tracking hazardous waste))
Housing units lacking complete kitchen facilities: 0.2%
45.1%Bottled, tank, or LP gas
40.3%Electricity
11.6%Wood
2.9%Utility gas
Population in 1990: 1,084. Population change in the 1990s: +1,566 (+144.5%).
Place of birth for U.S.-born residents:
This state: 1,601
Northeast: 744
Midwest: 730
South: 706
West: 2,025
54% of the 83455 zip code residents lived in the same house 5 years ago. Out of people who lived in different houses, 41% lived in this county. Out of people who lived in different counties, 50% lived in Idaho.
85% of the 83455 zip code residents lived in the same house 1 year ago. Out of people who lived in different houses, 28% moved from this county. Out of people who lived in different houses, 10% moved from different county within same state. Out of people who lived in different houses, 60% moved from different state. Out of people who lived in different houses, 1% moved from abroad.
Private vs. public school enrollment:
Students in private schools in grades 1 to 8 (elementary and middle school): 130
Here:
19.1%
Idaho:
13.5%
Students in private schools in grades 9 to 12 (high school): 7
Here:
4.3%
Idaho:
8.5%
Students in private undergraduate colleges:
Here:
0.0%
Idaho:
30.0%
Occupation by median earnings in the past 12 months ($)
96,349Management occupations
73,686Health diagnosing and treating practitioners and other technical occupations
71,830Law enforcement workers including supervisors
68,587Business and financial operations occupations
68,393Installation, maintenance, and repair occupations
60,645Building and grounds cleaning and maintenance occupations
Top industries in this zip code by the number of employees in 2005:
Construction: New Single-Family Housing Construction (except Operative Builders) (5-9 employees: 4 establishments, 1-4 employees: 18 establishments)
Construction: Poured Concrete Foundation and Structure Contractors (20-49: 1, 5-9: 1, 1-4: 1)
25 people in homes or halfway houses for drug/alcohol abuse
Fatal accident statistics in 2012:
Fatal accident count: 1
Vehicles involved in fatal accidents: 1
Fatal accidents caused by drunken drivers: 1
Fatalities: 1
Persons involved in fatal accidents: 1
Pedestrians involved in fatal accidents: 0
Fatal accident statistics in 2010:
Fatal accident count: 1
Vehicles involved in fatal accidents: 1
Fatal accidents caused by drunken drivers: 0
Fatalities: 1
Persons involved in fatal accidents: 3
Pedestrians involved in fatal accidents: 1
2002 - 2018 National Fire Incident Reporting System (NFIRS) incidents
Based on the data from the years 2002 - 2018 the average number of fires per year is 11. The highest number of fires - 22 took place in 2013, and the least - 3 in 2008. The data has an increasing trend.
When looking into fire subcategories, the most incidents belonged to: Outside Fires (47.3%), and Structure Fires (34.6%).
Fire incident types reported to NFIRS in Zip Code 83455


 Nearest zip codes: 83422, 83428, 83452, 83014, 83424, 83025.


 Based on the data from the years 2002 - 2018 the average number of fires per year is 11. The highest number of fires - 22 took place in 2013, and the least - 3 in 2008. The data has an increasing trend.
 When looking into fire subcategories, the most incidents belonged to: Outside Fires (47.3%), and Structure Fires (34.6%).