Estimated zip code population in 2022: 1,716 Zip code population in 2010: 703 Zip code population in 2000: 688
Houses and condos: 439 Renter-occupied apartments: 25
% of renters here:
7%
State:
29%
March 2022 cost of living index in zip code 87006: 82.6 (low, U.S. average is 100)
Land area: 57.5 sq. mi. Water area: 0.5 sq. mi.
Population density: 30 people per square mile
(very low).
OSM Map
General Map
Google Map
MSN Map
OSM Map
General Map
Google Map
MSN Map
OSM Map
General Map
Google Map
MSN Map
OSM Map
General Map
Google Map
MSN Map
Please wait while loading the map...
Real estate property taxes paid for housing units in 2022:
This zip code:
0.4% ($785)
New Mexico:
0.7% ($1,638)
Median real estate property taxes paid for housing units with mortgages in 2022: $908 (0.5%) Median real estate property taxes paid for housing units with no mortgage in 2022: $603 (0.5%)
Business Search- 14 Million verified businesses
Males: 1,116
(65.1%)
Females: 597
(34.9%)
For population 25 years and over in 87006:
High school or higher: 96.9%
Bachelor's degree or higher: 14.1%
Graduate or professional degree: 4.1%
Mean travel time to work (commute): 34.0 minutes
For population 15 years and over in 87006:
Never married: 59.4%
Now married: 30.6%
Separated: 0.0%
Widowed: 5.5%
Divorced: 4.5%
Zip code 87006 compared to state average:
Unemployed percentage significantly below state average.
Black race population percentage significantly below state average.
Hispanic race population percentage above state average.
Foreign-born population percentage significantly below state average.
Renting percentage significantly below state average.
Length of stay since moving in significantly above state average.
Percentage of population with a bachelor's degree or higher significantly below state average.
Averages for the 2020 tax year for zip code 87006, filed in 2021:
Average Adjusted Gross Income (AGI) in 2020: $43,962 (Individual Income Tax Returns)
Here:
$43,962
State:
$59,146
Salary/wage: $45,031 (reported on 72.9% of returns)
Here:
$45,031
State:
$48,327
(% of AGI for various income ranges: 1095.8% for AGIs below $25k, 4093.6% for AGIs $25k-50k, 5302.0% for AGIs $50k-75k, 7160.0% for AGIs $75k-100k, 17146.7% for AGIs $100k-200k)
Taxable interest for individuals: $500 (reported on 31.2% of returns)
This zip code:
$500
New Mexico:
$1,616
(% of AGI for various income ranges: 10.8% for AGIs below $25k, 24.5% for AGIs $25k-50k, 50.0% for AGIs $50k-75k, 33.3% for AGIs $75k-100k)
Ordinary dividends: $600 (reported on 4.2% of returns)
Here:
$600
State:
$7,816
(% of AGI for various income ranges: 10.9% for AGIs $25k-50k)
Net capital gain/loss in AGI: +$1,267 (reported on 6.2% of returns)
Here:
+$1,267
State:
+$19,595
(% of AGI for various income ranges: 34.5% for AGIs $25k-50k)
Profit/loss from business: +$1,267 (reported on 12.5% of returns)
Here:
+$1,267
State:
+$11,430
(% of AGI for various income ranges: 39.2% for AGIs below $25k, 42.7% for AGIs $25k-50k)
Taxable individual retirement arrangement distribution: $10,150 (reported on 4.2% of returns)
87006:
$10,150
New Mexico:
$20,970
(% of AGI for various income ranges: 184.5% for AGIs $25k-50k)
Earned income credit: $1,525 (reported on 16.7% of returns)
Here:
$1,525
State:
$2,323
(% of AGI for various income ranges: 66.7% for AGIs below $25k, 38.2% for AGIs $25k-50k)
Percentage of individuals using paid preparers for their 2020 taxes: 89.6%
Here:
90%
State:
92%
(% for various income ranges: 88.9% for AGIs below $25k, 93.3% for AGIs $25k-50k, 85.7% for AGIs $50k-75k, 75.0% for AGIs $75k-100k, 100.0% for AGIs $100k-200k)
Averages for the 2012 tax year for zip code 87006, filed in 2013:
Average Adjusted Gross Income (AGI) in 2012: $35,318 (Individual Income Tax Returns)
Here:
$35,318
State:
$50,343
Salary/wage: $35,537 (reported on 71.4% of returns)
Here:
$35,537
State:
$41,171
(% of AGI for various income ranges: 72.0% for AGIs below $25k, 74.1% for AGIs $25k-50k, 74.2% for AGIs $50k-75k, 83.0% for AGIs $75k-100k, 55.4% for AGIs $100k-200k)
Taxable interest for individuals: $969 (reported on 26.5% of returns)
This zip code:
$969
New Mexico:
$1,677
(% of AGI for various income ranges: 1.4% for AGIs below $25k, 1.1% for AGIs $25k-50k, 1.2% for AGIs $75k-100k)
Ordinary dividends: $500 (reported on 6.1% of returns)
Here:
$500
State:
$6,939
Profit/loss from business: +$2,283 (reported on 12.2% of returns)
Here:
+$2,283
State:
+$11,059
Taxable individual retirement arrangement distribution: $11,850 (reported on 4.1% of returns)
87006:
$11,850
New Mexico:
$15,706
Total itemized deductions: $18,211 (26% of AGI, reported on 18.4% of returns)
Here:
$18,211
State:
$21,709
Here:
25.8% of AGI
State:
19.8% of AGI
Charity contributions: $3,217 (reported on 12.2% of returns)
Here:
$3,217
State:
$4,195
Taxes paid: $4,544 (reported on 18.4% of returns)
87006:
$4,544
State:
$6,176
Earned income credit: $2,250 (reported on 20.4% of returns)
Here:
$2,250
State:
$2,311
(% of AGI for various income ranges: 6.2% for AGIs below $25k, 1.4% for AGIs $25k-50k)
Percentage of individuals using paid preparers for their 2012 taxes: 59.2%
Here:
59%
State:
50%
(% for various income ranges: 63.6% for AGIs below $25k, 57.1% for AGIs $25k-50k, 83.3% for AGIs $50k-75k, 66.7% for AGIs $100k-200k)
Averages for the 2004 tax year for zip code 87006, filed in 2005:
Average Adjusted Gross Income (AGI) in 2004: $26,453 (Individual Income Tax Returns)
Here:
$26,453
State:
$39,572
Salary/wage: $25,874 (reported on 78.0% of returns)
Here:
$25,874
State:
$34,237
(% of AGI for various income ranges: 162.5% for AGIs below $10k, 75.2% for AGIs $10k-25k, 79.7% for AGIs $25k-50k, 79.7% for AGIs $50k-75k, 108.1% for AGIs $75k-100k)
Taxable interest for individuals: $1,106 (reported on 32.9% of returns)
This zip code:
$1,106
New Mexico:
$1,873
(% of AGI for various income ranges: 9.0% for AGIs below $10k, 1.9% for AGIs $10k-25k, 0.7% for AGIs $25k-50k, 1.5% for AGIs $50k-75k, 1.4% for AGIs $75k-100k)
Taxable dividends: $244 (reported on 9.2% of returns)
Here:
$244
State:
$3,554
Net capital gain/loss: +$949 (reported on 8.0% of returns)
Here:
+$949
State:
+$10,425
Profit/loss from business: +$1,141 (reported on 15.9% of returns)
Here:
+$1,141
State:
+$8,875
(% of AGI for various income ranges: -7.5% for AGIs below $10k, 4.7% for AGIs $10k-25k, -0.5% for AGIs $25k-50k, -0.2% for AGIs $50k-75k)
Total itemized deductions: $15,141 (29% of AGI, reported on 18.8% of returns)
Here:
$15,141
State:
$18,103
Here:
28.8% of AGI
State:
21.5% of AGI
(% of AGI for various income ranges: 9.2% for AGIs $10k-25k, 7.8% for AGIs $25k-50k, 13.1% for AGIs $50k-75k, 28.0% for AGIs $75k-100k)
Charity contributions deductions: $1,724 (3% of AGI, reported on 15.5% of returns)
Here:
$1,724
State:
$3,246
Here:
3.3% of AGI
State:
3.6% of AGI
(% of AGI for various income ranges: 0.3% for AGIs $10k-25k, 1.0% for AGIs $25k-50k, 1.2% for AGIs $50k-75k, 3.1% for AGIs $75k-100k)
Total tax: $2,782 (reported on 64.5% of returns)
87006:
$2,782
State:
$6,237
(% of AGI for various income ranges: 5.4% for AGIs below $10k, 3.1% for AGIs $10k-25k, 5.1% for AGIs $25k-50k, 7.3% for AGIs $50k-75k, 10.1% for AGIs $75k-100k, 15.4% for AGIs over 100k)
Earned income credit: $1,524 (reported on 25.7% of returns)
Here:
$1,524
State:
$1,796
Percentage of individuals using paid preparers for their 2004 taxes: 65.5%
Here:
66%
State:
57%
(% for various income ranges: 68.0% for AGIs below $10k, 65.7% for AGIs $10k-25k, 59.8% for AGIs $25k-50k, 69.6% for AGIs $50k-75k, 57.9% for AGIs $75k-100k, 90.9% for AGIs over 100k)
Household received Food Stamps/SNAP in the past 12 months: 7 Household did not receive Food Stamps/SNAP in the past 12 months: 327
Women who did not have a birth in the past 12 months: 270 (110 now married, 159 unmarried)
Housing units in zip code 87006 with a mortgage: 221 Median monthly owner costs for units with a mortgage: $1,294 Median monthly owner costs for units without a mortgage: $324
Residents with income below the poverty level in 2022:
This zip code:
11.4%
Whole state:
17.6%
Residents with income below 50% of the poverty level in 2022:
This zip code:
11.4%
Whole state:
9.7%
Median number of rooms in houses and condos:
Here:
5.6
State:
5.9
Notable locations in this zip code not listed on our city pages
Notable locations in zip code 87006: Sabinal Siding (A), Abeytas Fire Department (B), Dust Bowl Home Historic Site (C). Display/hide their locations on the map
In group quarters: 10 (-1 institutionalized population)
Size of family households: 93 2-persons, 9 3-persons, 106 5-persons, 73 6-persons
Size of nonfamily households: 8 1-person, 46 2-persons
315 married couples with children.
125 single-parent households (125 women).
72.0% of residents of 87006 zip code speak English at home.
24.7% of residents speak Spanish at home (57% very well, 43% well).
4.0% of residents speak other Indo-European language at home (100% very well).
0.4% of residents speak Asian or Pacific Island language at home (100% very well).
Foreign born population: 0 (0.1%) (100.0% of them are naturalized citizens)
This zip code:
0.1%
Whole state:
9.3%
100%Grenada
18%Scottish
13%German
2%Romanian
1%Swedish
0%Irish
0%Haitian
Year of entry for the foreign-born population
02010 or later
12000 to 2009
11990 to 1999
0Before 1990
Facilities with environmental interests located in this zip code:
CHEVRON PIPE LINE BERNARDO STA (CTY RD 5M E & 1M N H-60 BERNARDO in BOSQUE, NM)
Conditionally Exempt Small Quantity Generators, less than 100 kg/month of hazardous waste (Resource Conservation and Recovery Act (tracking hazardous waste)) - notification Organizations: CHEVRON PIPE LINE CO (CONTACT/OWNER)
Housing units lacking complete plumbing facilities: 13.5% Housing units lacking complete kitchen facilities: 3.7%
56.5%Wood
29.0%Bottled, tank, or LP gas
13.0%Electricity
2.2%Utility gas
Population in 1990: 276. Population change in the 1990s: +412 (+149.3%).
Place of birth for U.S.-born residents:
This state: 1,479
Northeast: 26
Midwest: 44
South: 17
West: 128
68% of the 87006 zip code residents lived in the same house 5 years ago. Out of people who lived in different houses, 27% lived in this county. Out of people who lived in different counties, 50% lived in New Mexico.
101% of the 87006 zip code residents lived in the same house 1 year ago.
Private vs. public school enrollment:
Students in private schools in grades 1 to 8 (elementary and middle school):
Here:
0.0%
New Mexico:
10.2%
Students in private schools in grades 9 to 12 (high school):
Here:
0.0%
New Mexico:
10.0%
Top industries in this zip code by the number of employees in 2005:
Construction: New Single-Family Housing Construction (except Operative Builders) (5-9 employees: 1 establishment, 1-4 employees: 2 establishments)
Arts, Entertainment, and Recreation: Other Spectator Sports (1-4: 1)
Construction: Electrical Contractors (1-4: 1)
Administrative and Support and Waste Management and Remediation Services: Security Guards and Patrol Services (1-4: 1)
Professional, Scientific, and Technical Services: Offices of Certified Public Accountants (1-4: 1)
Other Services (except Public Administration): Religious Organizations (1-4: 1)
Other Services (except Public Administration): Commercial and Industrial Machinery and Equipment (except Automotive and Electronic) Repair and Maintenance (1-4: 1)
Professional, Scientific, and Technical Services: Offices of Lawyers (1-4: 1)
Accommodation and Food Services: Limited-Service Restaurants (1-4: 1)
People in group quarters in 2010:
24 people in other noninstitutional facilities
Home Mortgage Disclosure Act Aggregated Statistics For Year 2009 (Based on 2 partial tracts)
A) FHA, FSA/RHS & VA Home Purchase Loans
B) Conventional Home Purchase Loans
C) Refinancings
D) Home Improvement Loans
G) Loans On Manufactured Home Dwelling (A B C & D)
Number
Average Value
Number
Average Value
Number
Average Value
Number
Average Value
Number
Average Value
LOANS ORIGINATED
3
$130,940
1
$244,440
9
$153,290
1
$6,310
2
$83,660
APPLICATIONS APPROVED, NOT ACCEPTED
0
$0
0
$0
3
$105,083
0
$0
1
$121,320
APPLICATIONS DENIED
0
$0
2
$131,690
9
$139,760
2
$57,730
1
$100,120
APPLICATIONS WITHDRAWN
0
$0
0
$0
3
$124,927
0
$0
0
$0
FILES CLOSED FOR INCOMPLETENESS
0
$0
0
$0
0
$0
0
$0
0
$0
Aggregated Statistics For Year 2008 (Based on 2 partial tracts)
A) FHA, FSA/RHS & VA Home Purchase Loans
B) Conventional Home Purchase Loans
C) Refinancings
D) Home Improvement Loans
F) Non-occupant Loans on < 5 Family Dwellings (A B C & D)
G) Loans On Manufactured Home Dwelling (A B C & D)
Number
Average Value
Number
Average Value
Number
Average Value
Number
Average Value
Number
Average Value
Number
Average Value
LOANS ORIGINATED
1
$83,890
1
$99,670
14
$124,444
2
$18,490
0
$0
4
$80,955
APPLICATIONS APPROVED, NOT ACCEPTED
0
$0
0
$0
1
$138,910
0
$0
0
$0
0
$0
APPLICATIONS DENIED
0
$0
3
$101,023
9
$152,589
5
$64,764
1
$67,650
3
$115,307
APPLICATIONS WITHDRAWN
1
$97,870
0
$0
2
$173,860
1
$60,890
0
$0
1
$130,340
FILES CLOSED FOR INCOMPLETENESS
0
$0
0
$0
0
$0
0
$0
0
$0
0
$0
Aggregated Statistics For Year 2007 (Based on 2 partial tracts)
A) FHA, FSA/RHS & VA Home Purchase Loans
B) Conventional Home Purchase Loans
C) Refinancings
D) Home Improvement Loans
F) Non-occupant Loans on < 5 Family Dwellings (A B C & D)
G) Loans On Manufactured Home Dwelling (A B C & D)
Number
Average Value
Number
Average Value
Number
Average Value
Number
Average Value
Number
Average Value
Number
Average Value
LOANS ORIGINATED
1
$225,500
4
$131,352
12
$135,338
5
$48,166
1
$106,890
5
$92,996
APPLICATIONS APPROVED, NOT ACCEPTED
0
$0
1
$144,320
5
$129,346
1
$42,840
0
$0
0
$0
APPLICATIONS DENIED
1
$126,730
1
$222,790
14
$101,024
4
$63,140
1
$38,790
6
$109,518
APPLICATIONS WITHDRAWN
0
$0
0
$0
7
$115,004
1
$57,730
0
$0
2
$67,425
FILES CLOSED FOR INCOMPLETENESS
0
$0
0
$0
1
$115,910
0
$0
0
$0
1
$77,120
Aggregated Statistics For Year 2006 (Based on 2 partial tracts)
A) FHA, FSA/RHS & VA Home Purchase Loans
B) Conventional Home Purchase Loans
C) Refinancings
D) Home Improvement Loans
F) Non-occupant Loans on < 5 Family Dwellings (A B C & D)
G) Loans On Manufactured Home Dwelling (A B C & D)
Number
Average Value
Number
Average Value
Number
Average Value
Number
Average Value
Number
Average Value
Number
Average Value
LOANS ORIGINATED
2
$175,215
6
$101,700
14
$119,837
4
$29,652
1
$112,750
5
$88,938
APPLICATIONS APPROVED, NOT ACCEPTED
0
$0
3
$88,547
2
$135,525
1
$133,950
1
$52,770
2
$77,120
APPLICATIONS DENIED
0
$0
3
$48,557
16
$102,180
4
$46,905
1
$142,070
6
$74,040
APPLICATIONS WITHDRAWN
1
$82,080
2
$133,495
8
$82,646
0
$0
0
$0
3
$76,220
FILES CLOSED FOR INCOMPLETENESS
0
$0
0
$0
2
$152,440
0
$0
0
$0
0
$0
Aggregated Statistics For Year 2005 (Based on 2 partial tracts)
A) FHA, FSA/RHS & VA Home Purchase Loans
B) Conventional Home Purchase Loans
C) Refinancings
D) Home Improvement Loans
F) Non-occupant Loans on < 5 Family Dwellings (A B C & D)
G) Loans On Manufactured Home Dwelling (A B C & D)
Number
Average Value
Number
Average Value
Number
Average Value
Number
Average Value
Number
Average Value
Number
Average Value
LOANS ORIGINATED
1
$59,080
7
$94,194
12
$90,651
2
$28,640
2
$50,510
6
$61,712
APPLICATIONS APPROVED, NOT ACCEPTED
0
$0
0
$0
4
$83,660
0
$0
0
$0
2
$66,975
APPLICATIONS DENIED
0
$0
6
$92,003
18
$105,008
4
$15,222
1
$92,910
7
$79,634
APPLICATIONS WITHDRAWN
0
$0
0
$0
7
$84,080
1
$45,550
1
$69,000
3
$53,217
FILES CLOSED FOR INCOMPLETENESS
0
$0
0
$0
1
$125,830
0
$0
0
$0
0
$0
Aggregated Statistics For Year 2004 (Based on 2 partial tracts)
A) FHA, FSA/RHS & VA Home Purchase Loans
B) Conventional Home Purchase Loans
C) Refinancings
D) Home Improvement Loans
G) Loans On Manufactured Home Dwelling (A B C & D)
Number
Average Value
Number
Average Value
Number
Average Value
Number
Average Value
Number
Average Value
LOANS ORIGINATED
1
$105,990
5
$84,428
13
$105,395
2
$89,975
5
$67,470
APPLICATIONS APPROVED, NOT ACCEPTED
0
$0
1
$65,850
4
$63,252
1
$54,120
2
$64,495
APPLICATIONS DENIED
0
$0
3
$54,270
14
$86,656
5
$9,472
6
$58,855
APPLICATIONS WITHDRAWN
0
$0
1
$59,980
14
$95,902
2
$69,230
4
$84,225
FILES CLOSED FOR INCOMPLETENESS
0
$0
0
$0
0
$0
0
$0
0
$0
Aggregated Statistics For Year 2003 (Based on 2 partial tracts)
A) FHA, FSA/RHS & VA Home Purchase Loans
B) Conventional Home Purchase Loans
C) Refinancings
D) Home Improvement Loans
F) Non-occupant Loans on < 5 Family Dwellings (A B C & D)
Number
Average Value
Number
Average Value
Number
Average Value
Number
Average Value
Number
Average Value
LOANS ORIGINATED
1
$147,030
6
$98,318
23
$99,985
2
$16,010
1
$62,240
APPLICATIONS APPROVED, NOT ACCEPTED
0
$0
1
$82,980
3
$105,983
0
$0
0
$0
APPLICATIONS DENIED
0
$0
2
$98,995
20
$90,718
2
$20,520
1
$64,040
APPLICATIONS WITHDRAWN
0
$0
1
$120,420
10
$94,259
0
$0
1
$52,770
FILES CLOSED FOR INCOMPLETENESS
0
$0
1
$96,060
1
$112,300
0
$0
0
$0
Aggregated Statistics For Year 1999 (Based on 1 partial tract)
A) FHA, FSA/RHS & VA Home Purchase Loans
B) Conventional Home Purchase Loans
C) Refinancings
D) Home Improvement Loans
F) Non-occupant Loans on < 5 Family Dwellings (A B C & D)
Detailed PMIC statistics for the following Tracts:9709.02
2006 - 2018 National Fire Incident Reporting System (NFIRS) incidents
Based on the data from the years 2006 - 2018 the average number of fire incidents per year is 11. The highest number of fires - 21 took place in 2014, and the least - 2 in 2007. The data has an increasing trend.
When looking into fire subcategories, the most reports belonged to: Outside Fires (68.6%), and Structure Fires (20.0%).
Fire incident types reported to NFIRS in Zip Code 87006

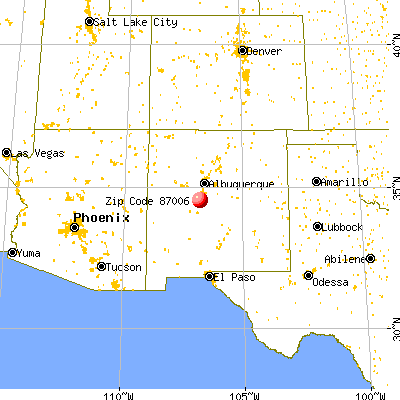


 Nearest zip codes: 87028, 87023, 87062, 87002, 87831, 87031.


 Based on the data from the years 2006 - 2018 the average number of fire incidents per year is 11. The highest number of fires - 21 took place in 2014, and the least - 2 in 2007. The data has an increasing trend.
 When looking into fire subcategories, the most reports belonged to: Outside Fires (68.6%), and Structure Fires (20.0%).