Estimated zip code population in 2022: 5,255 Zip code population in 2010: 6,368 Zip code population in 2000: 5,441
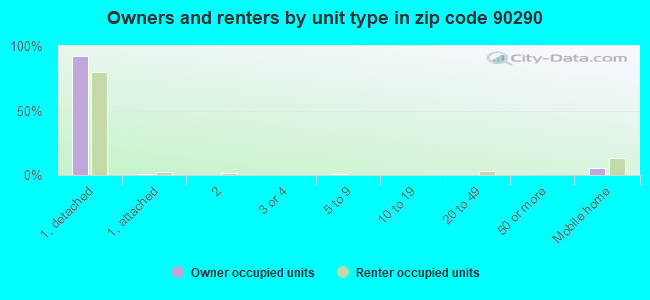
Houses and condos: 2,566 Renter-occupied apartments: 581
% of renters here:
27%
State:
44%
March 2022 cost of living index in zip code 90290: 143.4 (very high, U.S. average is 100)
Land area: 20.1 sq. mi. Water area: 0.0 sq. mi.
Population density: 262 people per square mile
(very low).
OSM Map
General Map
Google Map
MSN Map
OSM Map
General Map
Google Map
MSN Map
OSM Map
General Map
Google Map
MSN Map
OSM Map
General Map
Google Map
MSN Map
Please wait while loading the map...
Real estate property taxes paid for housing units in 2022:
This zip code:
0.7% ($10,010)
California:
0.7% ($4,831)
Median real estate property taxes paid for housing units with mortgages in 2022: $10,330 (0.7%) Median real estate property taxes paid for housing units with no mortgage in 2022: $5,381 (0.4%)
Business Search- 14 Million verified businesses
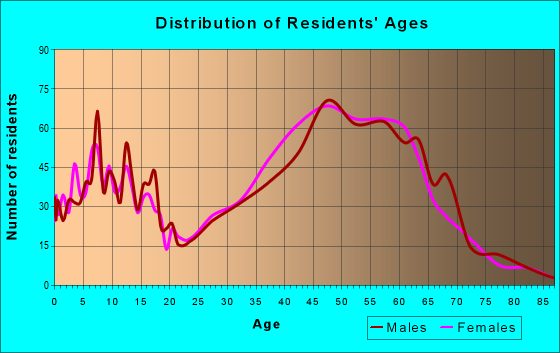
Males: 2,715
(51.7%)
Females: 2,540
(48.3%)
For population 25 years and over in 90290:
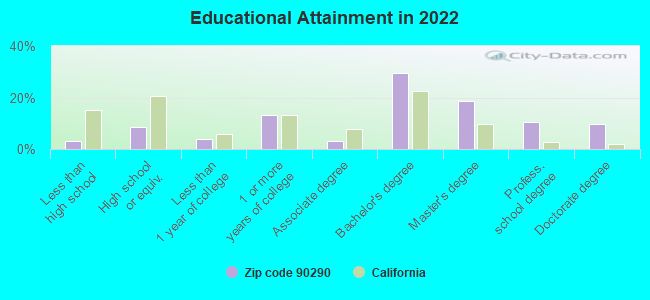
High school or higher: 98.4%
Bachelor's degree or higher: 69.1%
Graduate or professional degree: 39.2%
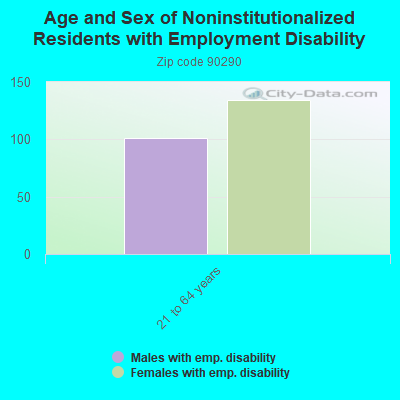
Unemployed: 5.2%
Mean travel time to work (commute): 35.7 minutes
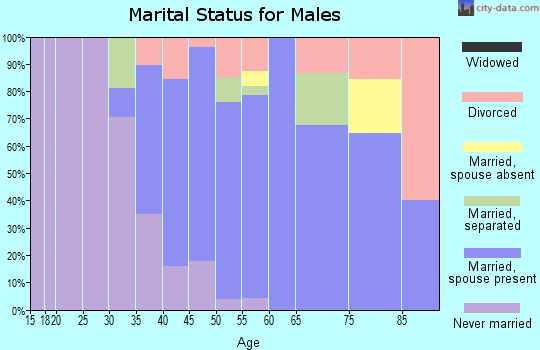
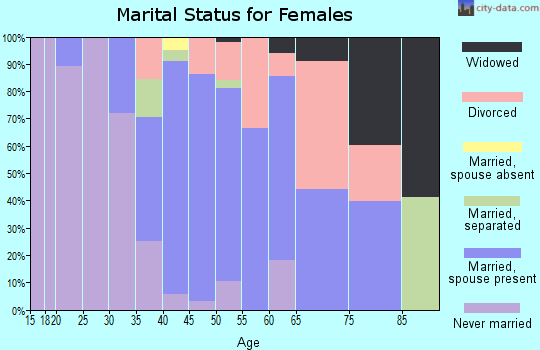
For population 15 years and over in 90290:
Never married: 29.7%
Now married: 54.7%
Separated: 0.7%
Widowed: 5.7%
Divorced: 9.2%
Zip code 90290 compared to state average:
Median household income above state average.
Median house value above state average.
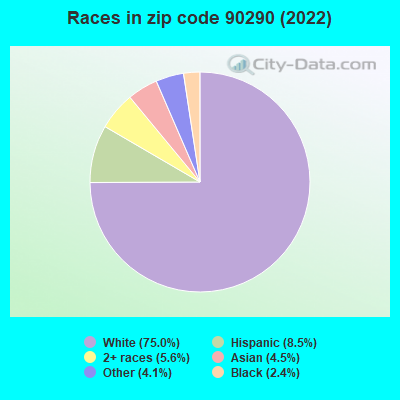
Black race population percentage below state average.
Hispanic race population percentage significantly below state average.
Median age significantly above state average.
Renting percentage below state average.
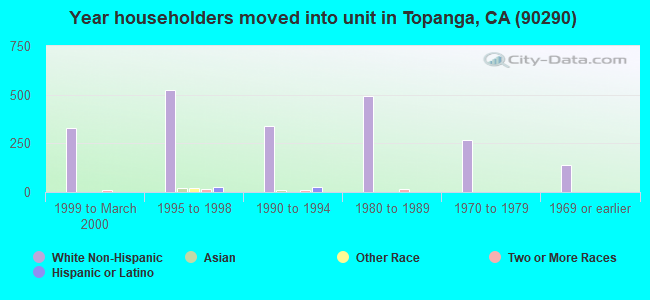
Length of stay since moving in significantly above state average.
Number of college students below state average.
Percentage of population with a bachelor's degree or higher above state average.
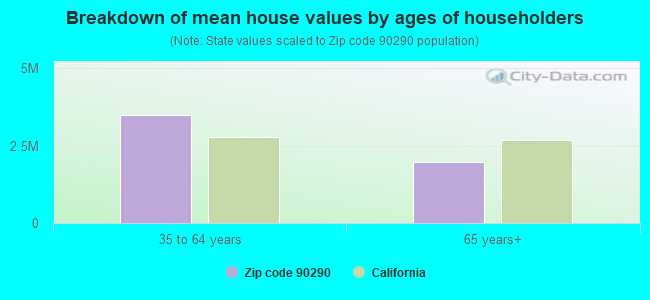
Estimated median house/condo value in 2022: $1,513,890
90290:
$1,513,890
California:
$715,900
According to our research of California and other state lists, there was 1 registered sex offender living in 90290 zip code as of April 26, 2024. The ratio of all residents to sex offenders in zip code 90290 is 6,059 to 1. The ratio of registered sex offenders to all residents in this zip code is much lower than the state average.
Median resident age:
This zip code:
47.8 years
California median age:
37.9 years
Average household size:
This zip code:
2.5 people
California:
2.8 people
Averages for the 2020 tax year for zip code 90290, filed in 2021:
Average Adjusted Gross Income (AGI) in 2020: $167,760 (Individual Income Tax Returns)
Here:
$167,760
State:
$95,910
Salary/wage: $115,318 (reported on 65.2% of returns)
Here:
$115,318
State:
$77,331
(% of AGI for various income ranges: 852.8% for AGIs below $25k, 3578.6% for AGIs $25k-50k, 7153.6% for AGIs $50k-75k, 11332.7% for AGIs $75k-100k, 21532.5% for AGIs $100k-200k, 138852.7% for AGIs over 200k)
Taxable interest for individuals: $3,518 (reported on 52.5% of returns)
This zip code:
$3,518
California:
$2,294
(% of AGI for various income ranges: 49.0% for AGIs below $25k, 92.7% for AGIs $25k-50k, 122.1% for AGIs $50k-75k, 330.0% for AGIs $75k-100k, 500.5% for AGIs $100k-200k, 3362.7% for AGIs over 200k)
Ordinary dividends: $22,862 (reported on 39.3% of returns)
Here:
$22,862
State:
$10,949
(% of AGI for various income ranges: 120.0% for AGIs below $25k, 201.4% for AGIs $25k-50k, 501.4% for AGIs $50k-75k, 633.6% for AGIs $75k-100k, 1635.5% for AGIs $100k-200k, 19867.3% for AGIs over 200k)
Net capital gain/loss in AGI: +$51,945 (reported on 40.7% of returns)
Here:
+$51,945
State:
+$49,306
(% of AGI for various income ranges: 63.6% for AGIs below $25k, 320.5% for AGIs $25k-50k, 502.1% for AGIs $50k-75k, 1317.3% for AGIs $75k-100k, 2061.5% for AGIs $100k-200k, 51985.5% for AGIs over 200k)
Profit/loss from business: +$21,523 (reported on 41.3% of returns)
Here:
+$21,523
State:
+$15,671
(% of AGI for various income ranges: 504.4% for AGIs below $25k, 1394.1% for AGIs $25k-50k, 1897.9% for AGIs $50k-75k, 1476.4% for AGIs $75k-100k, 2943.0% for AGIs $100k-200k, 10834.5% for AGIs over 200k)
Taxable individual retirement arrangement distribution: $26,933 (reported on 9.8% of returns)
90290:
$26,933
California:
$23,505
(% of AGI for various income ranges: 93.6% for AGIs below $25k, 132.3% for AGIs $25k-50k, 655.7% for AGIs $50k-75k, 840.9% for AGIs $75k-100k, 1295.5% for AGIs $100k-200k, 2718.2% for AGIs over 200k)
Self-employed (Keogh) retirement plans: $29,227 (reported on 3.6% of returns)
90290:
$29,227
California:
$30,163
(% of AGI for various income ranges: 143.2% for AGIs $25k-50k, 236.0% for AGIs $100k-200k, 2207.3% for AGIs over 200k)
Total itemized deductions: $40,940 (reported on 29.8% of returns)
Here:
$40,940
State:
$39,517
(% of AGI for various income ranges: 326.2% for AGIs below $25k, 813.2% for AGIs $25k-50k, 1930.0% for AGIs $50k-75k, 2271.8% for AGIs $75k-100k, 4362.5% for AGIs $100k-200k, 18425.5% for AGIs over 200k)
Charity contributions: $10,568 (reported on 24.3% of returns)
Here:
$10,568
State:
$12,598
(% of AGI for various income ranges: 11.3% for AGIs below $25k, 55.9% for AGIs $25k-50k, 107.1% for AGIs $50k-75k, 337.3% for AGIs $75k-100k, 412.5% for AGIs $100k-200k, 5733.6% for AGIs over 200k)
Taxes paid: $9,104 (reported on 29.5% of returns)
90290:
$9,104
State:
$8,807
(% of AGI for various income ranges: 91.0% for AGIs below $25k, 195.5% for AGIs $25k-50k, 385.0% for AGIs $50k-75k, 611.8% for AGIs $75k-100k, 1191.5% for AGIs $100k-200k, 3467.3% for AGIs over 200k)
Earned income credit: $918 (reported on 9.2% of returns)
Here:
$918
State:
$2,074
(% of AGI for various income ranges: 42.8% for AGIs below $25k, 40.9% for AGIs $25k-50k)
Percentage of individuals using paid preparers for their 2020 taxes: 93.1%
Here:
93%
State:
92%
(% for various income ranges: 89.4% for AGIs below $25k, 91.3% for AGIs $25k-50k, 94.1% for AGIs $50k-75k, 96.2% for AGIs $75k-100k, 94.6% for AGIs $100k-200k, 96.6% for AGIs over 200k)
Averages for the 2012 tax year for zip code 90290, filed in 2013:
Average Adjusted Gross Income (AGI) in 2012: $135,164 (Individual Income Tax Returns)
Here:
$135,164
State:
$72,726
Salary/wage: $101,665 (reported on 70.1% of returns)
Here:
$101,665
State:
$59,079
(% of AGI for various income ranges: 49.1% for AGIs below $25k, 53.8% for AGIs $25k-50k, 59.8% for AGIs $50k-75k, 58.4% for AGIs $75k-100k, 67.6% for AGIs $100k-200k, 47.1% for AGIs over 200k)
Taxable interest for individuals: $3,169 (reported on 52.0% of returns)
This zip code:
$3,169
California:
$2,146
(% of AGI for various income ranges: 2.9% for AGIs below $25k, 1.6% for AGIs $25k-50k, 1.0% for AGIs $50k-75k, 2.2% for AGIs $75k-100k, 1.0% for AGIs $100k-200k, 1.1% for AGIs over 200k)
Ordinary dividends: $10,205 (reported on 36.4% of returns)
Here:
$10,205
State:
$9,308
(% of AGI for various income ranges: 5.5% for AGIs below $25k, 3.5% for AGIs $25k-50k, 3.2% for AGIs $50k-75k, 2.5% for AGIs $75k-100k, 2.4% for AGIs $100k-200k, 2.7% for AGIs over 200k)
Net capital gain/loss in AGI: +$26,681 (reported on 35.7% of returns)
Here:
+$26,681
State:
+$30,460
(% of AGI for various income ranges: 0.5% for AGIs below $25k, 1.8% for AGIs $25k-50k, 0.7% for AGIs $50k-75k, 1.0% for AGIs $75k-100k, 1.7% for AGIs $100k-200k, 10.4% for AGIs over 200k)
Profit/loss from business: +$24,254 (reported on 42.2% of returns)
Here:
+$24,254
State:
+$17,064
(% of AGI for various income ranges: 32.0% for AGIs below $25k, 19.0% for AGIs $25k-50k, 15.9% for AGIs $50k-75k, 13.4% for AGIs $75k-100k, 9.3% for AGIs $100k-200k, 4.0% for AGIs over 200k)
Taxable individual retirement arrangement distribution: $26,611 (reported on 9.2% of returns)
90290:
$26,611
California:
$19,557
(% of AGI for various income ranges: 2.4% for AGIs below $25k, 3.6% for AGIs $25k-50k, 2.9% for AGIs $50k-75k, 3.1% for AGIs $75k-100k, 2.5% for AGIs $100k-200k, 1.2% for AGIs over 200k)
Self-employment retirement plans: $22,354 (reported on 4.4% of returns)
90290:
$22,354
California:
$24,530
(% of AGI for various income ranges: 2.4% for AGIs $50k-75k, 0.9% for AGIs $100k-200k, 0.7% for AGIs over 200k)
Total itemized deductions: $48,365 (22% of AGI, reported on 55.1% of returns)
Here:
$48,365
State:
$34,004
Here:
21.9% of AGI
State:
22.7% of AGI
(% of AGI for various income ranges: 30.7% for AGIs below $25k, 23.6% for AGIs $25k-50k, 22.1% for AGIs $50k-75k, 26.8% for AGIs $75k-100k, 23.5% for AGIs $100k-200k, 16.9% for AGIs over 200k)
Charity contributions: $4,109 (reported on 47.3% of returns)
Here:
$4,109
State:
$4,659
(% of AGI for various income ranges: 1.1% for AGIs below $25k, 1.4% for AGIs $25k-50k, 1.2% for AGIs $50k-75k, 1.4% for AGIs $75k-100k, 1.6% for AGIs $100k-200k, 1.4% for AGIs over 200k)
Taxes paid: $24,541 (reported on 55.1% of returns)
90290:
$24,541
State:
$14,448
(% of AGI for various income ranges: 6.7% for AGIs below $25k, 5.8% for AGIs $25k-50k, 7.0% for AGIs $50k-75k, 8.7% for AGIs $75k-100k, 9.6% for AGIs $100k-200k, 10.9% for AGIs over 200k)
Earned income credit: $1,272 (reported on 12.2% of returns)
Here:
$1,272
State:
$2,286
(% of AGI for various income ranges: 3.7% for AGIs below $25k, 0.5% for AGIs $25k-50k)
Percentage of individuals using paid preparers for their 2012 taxes: 73.8%
Here:
74%
State:
64%
(% for various income ranges: 65.6% for AGIs below $25k, 71.7% for AGIs $25k-50k, 69.7% for AGIs $50k-75k, 78.6% for AGIs $75k-100k, 80.0% for AGIs $100k-200k, 85.7% for AGIs over 200k)
Averages for the 2004 tax year for zip code 90290, filed in 2005:
Average Adjusted Gross Income (AGI) in 2004: $93,837 (Individual Income Tax Returns)
Here:
$93,837
State:
$58,600
Salary/wage: $85,283 (reported on 70.6% of returns)
Here:
$85,283
State:
$49,455
(% of AGI for various income ranges: 52.7% for AGIs $10k-25k, 66.6% for AGIs $25k-50k, 69.2% for AGIs $50k-75k, 72.5% for AGIs $75k-100k, 61.3% for AGIs over 100k)
Taxable interest for individuals: $2,598 (reported on 60.8% of returns)
This zip code:
$2,598
California:
$2,365
(% of AGI for various income ranges: 4.4% for AGIs $10k-25k, 2.1% for AGIs $25k-50k, 2.5% for AGIs $50k-75k, 2.5% for AGIs $75k-100k, 1.1% for AGIs over 100k)
Taxable dividends: $5,366 (reported on 40.7% of returns)
Here:
$5,366
State:
$4,746
(% of AGI for various income ranges: 4.1% for AGIs $10k-25k, 2.8% for AGIs $25k-50k, 2.5% for AGIs $50k-75k, 2.1% for AGIs $75k-100k, 2.1% for AGIs over 100k)
Net capital gain/loss: +$18,891 (reported on 38.8% of returns)
Here:
+$18,891
State:
+$23,418
(% of AGI for various income ranges: 0.2% for AGIs $10k-25k, -1.0% for AGIs $25k-50k, 2.9% for AGIs $50k-75k, 0.4% for AGIs $75k-100k, 10.2% for AGIs over 100k)
Profit/loss from business: +$23,929 (reported on 40.1% of returns)
Here:
+$23,929
State:
+$16,826
(% of AGI for various income ranges: 25.7% for AGIs $10k-25k, 18.2% for AGIs $25k-50k, 11.5% for AGIs $50k-75k, 10.5% for AGIs $75k-100k, 8.7% for AGIs over 100k)
IRA payment deduction: $3,422 (reported on 4.5% of returns)
90290:
$3,422
California:
$3,192
(% of AGI for various income ranges: 0.6% for AGIs $10k-25k, 0.4% for AGIs $25k-50k, 0.4% for AGIs $50k-75k, 0.4% for AGIs $75k-100k, 0.1% for AGIs over 100k)
Self-employed pension: $24,447 (reported on 5.4% of returns)
Here:
$24,447
California:
$17,688
Total itemized deductions: $37,881 (26% of AGI, reported on 57.4% of returns)
Here:
$37,881
State:
$28,113
Here:
25.8% of AGI
State:
25.3% of AGI
(% of AGI for various income ranges: 39.3% for AGIs $10k-25k, 28.9% for AGIs $25k-50k, 29.9% for AGIs $50k-75k, 30.1% for AGIs $75k-100k, 19.8% for AGIs over 100k)
Charity contributions deductions: $3,574 (2% of AGI, reported on 51.2% of returns)
Here:
$3,574
State:
$3,923
Here:
2.3% of AGI
State:
3.3% of AGI
(% of AGI for various income ranges: 1.6% for AGIs $10k-25k, 2.2% for AGIs $25k-50k, 2.4% for AGIs $50k-75k, 2.3% for AGIs $75k-100k, 1.8% for AGIs over 100k)
Total tax: $20,626 (reported on 82.2% of returns)
90290:
$20,626
State:
$10,761
(% of AGI for various income ranges: 7.7% for AGIs $10k-25k, 9.7% for AGIs $25k-50k, 10.0% for AGIs $50k-75k, 11.0% for AGIs $75k-100k, 20.6% for AGIs over 100k)
Earned income credit: $1,058 (reported on 8.5% of returns)
Here:
$1,058
State:
$1,763
Percentage of individuals using paid preparers for their 2004 taxes: 75.7%
Here:
76%
State:
66%
(% for various income ranges: 69.1% for AGIs below $10k, 71.0% for AGIs $10k-25k, 70.5% for AGIs $25k-50k, 78.8% for AGIs $50k-75k, 77.0% for AGIs $75k-100k, 84.7% for AGIs over 100k)
Likely homosexual households (counted as self-reported same-sex unmarried-partner households)
Lesbian couples: 0.0% of all households
Gay men: 0.6% of all households
Household received Food Stamps/SNAP in the past 12 months: 84 Household did not receive Food Stamps/SNAP in the past 12 months: 1,993
Women who had a birth in the past 12 months: 21 (21 now married, 0 unmarried) Women who did not have a birth in the past 12 months: 986 (504 now married, 477 unmarried)
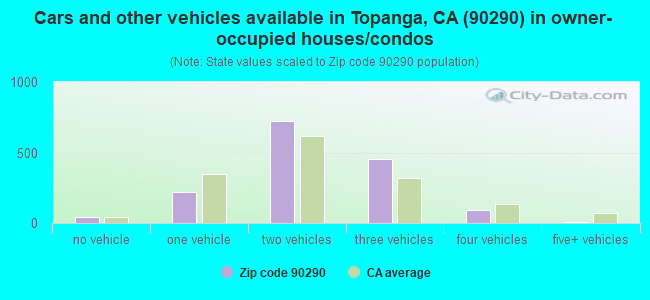
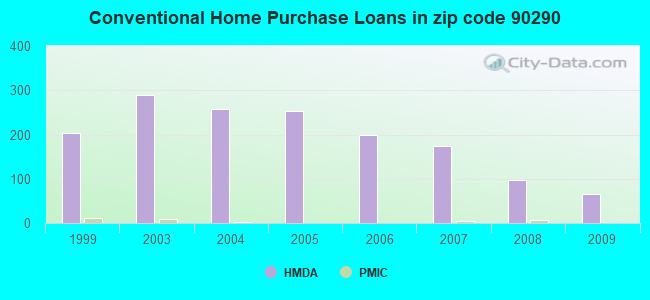
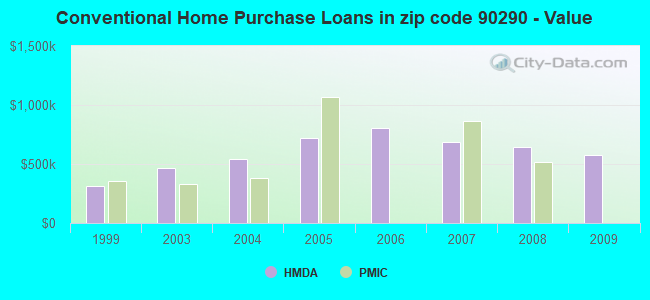
Housing units in zip code 90290 with a mortgage: 1,230 (149 second mortgage, 93 both second mortgage and home equity loan) Houses without a mortgage: 51
Median monthly owner costs for units with a mortgage: $3,876 Median monthly owner costs for units without a mortgage: $1,129
Residents with income below the poverty level in 2022:
This zip code:
5.6%
Whole state:
12.2%
Residents with income below 50% of the poverty level in 2022:
This zip code:
1.2%
Whole state:
6.2%
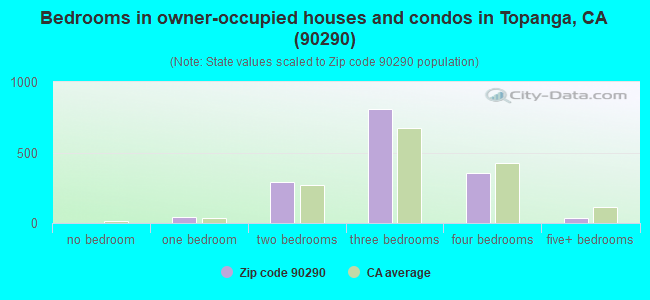
Median number of rooms in houses and condos:
Here:
6.1
State:
6.0
Median number of rooms in apartments:
Here:
4.4
State:
3.9
Notable locations in this zip code not listed on our city pages
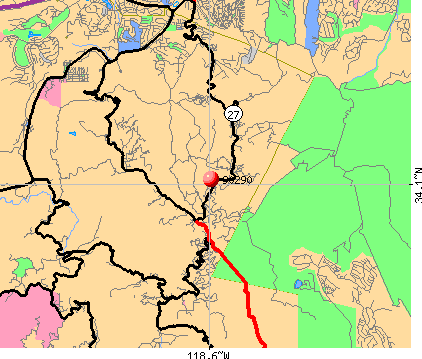
Notable locations in zip code 90290: Trippet Ranch (A), Elkhorn Camp (B), Camp Stauson (C), Topanga Lookout (D), Topanga Mineral Springs (E), Camp Wildwood (F), Los Angeles County Fire Department Station 69 (G). Display/hide their locations on the map
In group quarters: 20 (-1 institutionalized population)
Size of family households: 677 2-persons, 354 3-persons, 249 4-persons, 53 5-persons, 59 6-persons, 7 7-or-more-persons
Size of nonfamily households: 534 1-person, 123 2-persons, 64 3-persons
768 married couples with children.
178 single-parent households (80 men, 98 women).
79.9% of residents of 90290 zip code speak English at home.
8.5% of residents speak Spanish at home (90% very well, 4% well, 6% not well).
9.4% of residents speak other Indo-European language at home (97% very well, 3% well).
2.3% of residents speak Asian or Pacific Island language at home (95% very well, 5% well).
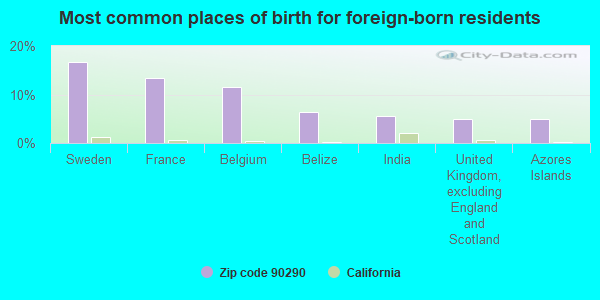
Foreign born population: 987 (18.8%) (51.9% of them are naturalized citizens)
This zip code:
18.8%
Whole state:
26.7%
17%Sweden
13%France
11%Belgium
6%Belize
6%India
5%United Kingdom, excluding England and Scotland
5%Azores Islands
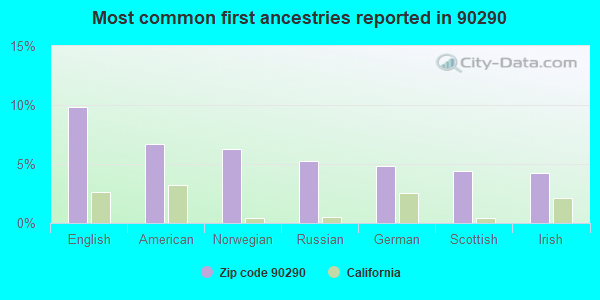
10%English
7%American
6%Norwegian
5%Russian
5%German
4%Scottish
4%Irish
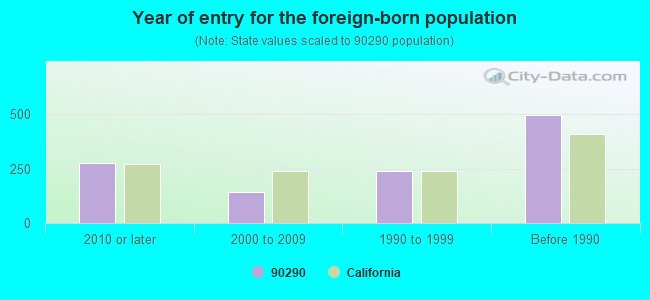
Year of entry for the foreign-born population
2772010 or later
1442000 to 2009
2411990 to 1999
497Before 1990
Facilities with environmental interests located in this zip code:
LOS ANGELES USD TOPANGA ELEM SCHOOL (141 N TOPANGA BLVD in TOPANGA, CA)
STATE MASTER (California - Hazardous Waste Tracking) - HAZARDOU WASTE PROGRAM Small Quantity Generators, between 100 kg and 1000 kg of hazardous waste/month (Resource Conservation and Recovery Act (tracking hazardous waste)) - notification Organizations: LOS ANGELES UNIFIED SCHOOL DISTRICT (CONTACT/OWNER)
Alternative names: LAUSD/ TOPANGA ELEM SCHOOL, TOPANGA LEARN-CHARTER ELEMENTARY
CALMONT SCHOOL (1717 OLD TOPANGA CANYON RD in TOPANGA, CA)
COMPLIANCE ACTIVITY (Tracking inspections of insecticide, fungicide, and rodenticide, and toxic substances)
Housing units lacking complete plumbing facilities: 1.8% Housing units lacking complete kitchen facilities: 2.3%
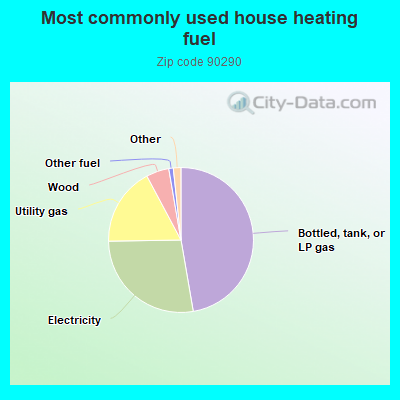
47.4%Bottled, tank, or LP gas
27.5%Electricity
17.5%Utility gas
5.1%Wood
1.0%Other fuel
0.9%No fuel used
0.8%Fuel oil, kerosene, etc.
Population in 1990: 5,430. Population change in the 1990s: +11 (+0.2%).
Place of birth for U.S.-born residents:
This state: 2,403
Northeast: 763
Midwest: 402
South: 304
West: 194
59% of the 90290 zip code residents lived in the same house 5 years ago. Out of people who lived in different houses, 77% lived in this county. Out of people who lived in different counties, 50% lived in California.
94% of the 90290 zip code residents lived in the same house 1 year ago. Out of people who lived in different houses, 83% moved from this county. Out of people who lived in different houses, 12% moved from different county within same state. Out of people who lived in different houses, 4% moved from different state.
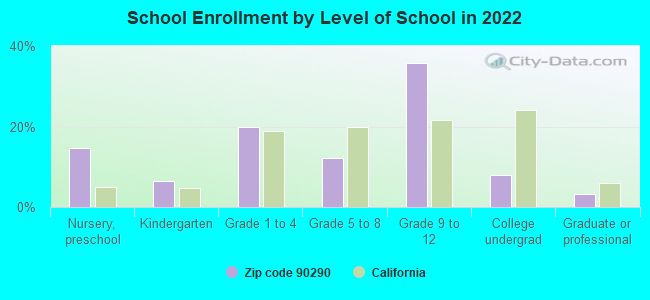
Private vs. public school enrollment:
Students in private schools in grades 1 to 8 (elementary and middle school): 112
Here:
30.7%
California:
10.5%
Students in private schools in grades 9 to 12 (high school): 153
Here:
37.9%
California:
8.5%
Students in private undergraduate colleges: 17
Here:
19.9%
California:
15.9%
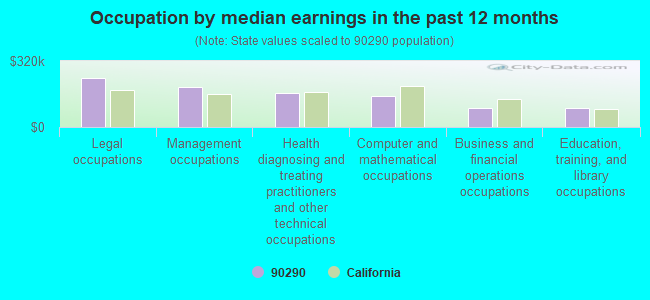
Occupation by median earnings in the past 12 months ($)
237,352Legal occupations
193,936Management occupations
163,057Health diagnosing and treating practitioners and other technical occupations
149,664Computer and mathematical occupations
91,723Business and financial operations occupations
91,712Education, training, and library occupations
Companies with federal contracts located in this zip code:
EVOLVING LOGIC (21280 COLINA DR in TOPANGA, CA; small business) : $2,641,369 in 14 contractsfrom 2000 to 2005
Contracts for Other Research and Development -- Applied Research and Exploratory Development (R&D), Mathematical and Computer Sciences -- Advanced Development (R&D), Other Defense -- Applied Research and Exploratory Development (R&D), Other Defense -- Basic Research (R&D) by Air Force, Navy, Army Signed by year:2000: $128,859; 2001: $360,829; 2002: $557,962; 2003: $374,000; 2004: $544,947; 2005: $674,772; 2006: $0.
Biggest contracts:
$425,000 with Air Force for Other Research and Development -- Applied Research and Exploratory Development (R&D). Signed on 2005-04-07. Completion date: 2006-01-05.
$374,000 with Navy for Mathematical and Computer Sciences -- Advanced Development (R&D). Signed on 2003-01-29. Completion date: 2005-11-13.
$360,829 with Army for Other Defense -- Applied Research and Exploratory Development (R&D). Signed on 2001-03-22. Completion date: 2003-05-30.
$359,069, same as above.Signed on 2002-03-18. Completion date: 2003-05-30.
Top industries in this zip code by the number of employees in 2005:
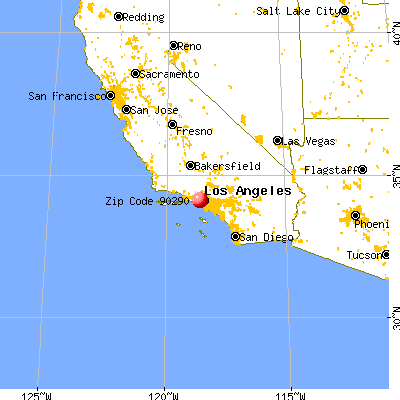


 Nearest zip codes: 91364, 91302, 91367, 90272, 91356, 91371.