Estimated zip code population in 2022: 34,639 Zip code population in 2010: 35,125 Zip code population in 2000: 36,341
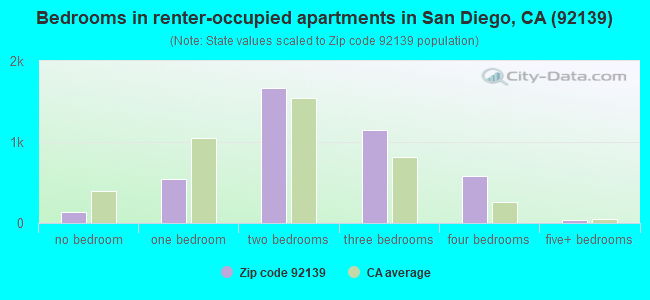
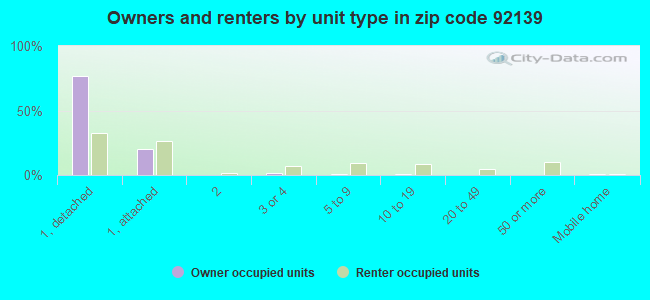
Houses and condos: 10,726 Renter-occupied apartments: 4,125
% of renters here:
41%
State:
44%
March 2022 cost of living index in zip code 92139: 121.3 (high, U.S. average is 100)
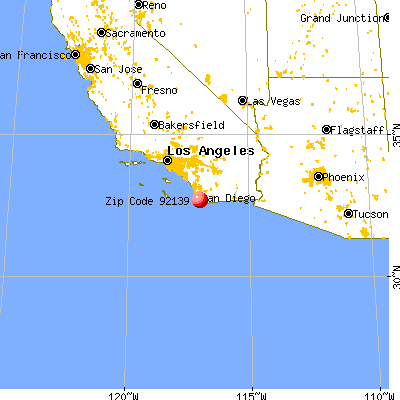
Land area: 3.6 sq. mi. Water area: 0.0 sq. mi.
Population density: 9,560 people per square mile
(high).
OSM Map
General Map
Google Map
MSN Map
OSM Map
General Map
Google Map
MSN Map
OSM Map
General Map
Google Map
MSN Map
OSM Map
General Map
Google Map
MSN Map
Please wait while loading the map...
Real estate property taxes paid for housing units in 2022:
This zip code:
0.5% ($3,188)
California:
0.7% ($4,831)
Median real estate property taxes paid for housing units with mortgages in 2022: $3,490 (0.6%) Median real estate property taxes paid for housing units with no mortgage in 2022: $2,611 (0.5%)
Business Search- 14 Million verified businesses
Males: 16,691
(48.2%)
Females: 17,948
(51.8%)
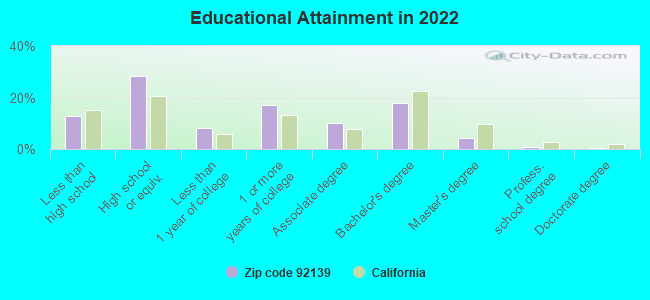
For population 25 years and over in 92139:
High school or higher: 86.5%
Bachelor's degree or higher: 23.4%
Graduate or professional degree: 5.7%
Unemployed: 5.2%
Mean travel time to work (commute): 26.7 minutes
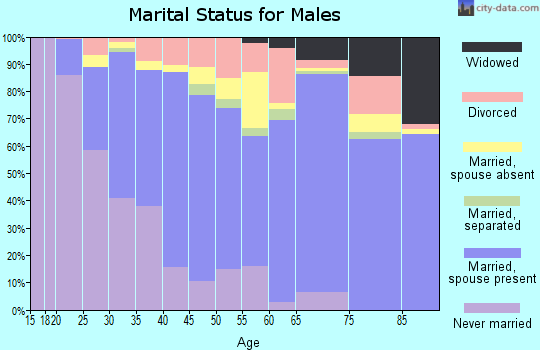
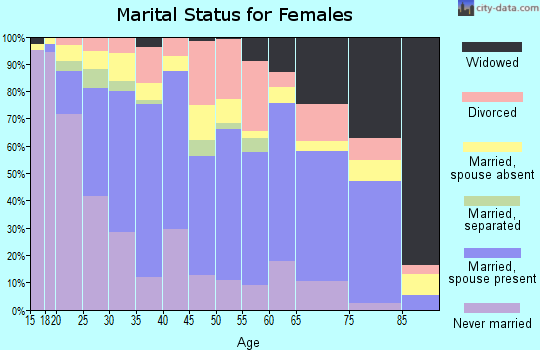
For population 15 years and over in 92139:
Never married: 39.3%
Now married: 44.3%
Separated: 2.6%
Widowed: 5.0%
Divorced: 8.8%
Zip code 92139 compared to state average:
Black race population percentage above state average.
Length of stay since moving in above state average.
Percentage of population with a bachelor's degree or higher below state average.
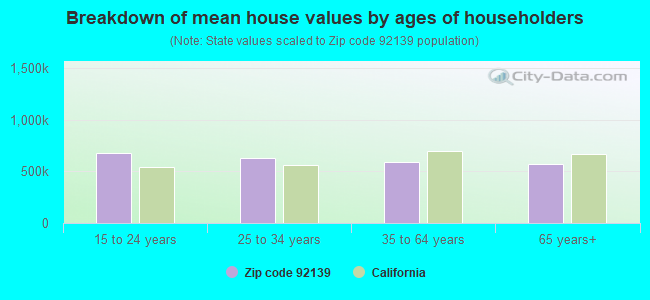
Estimated median house/condo value in 2022: $616,328
92139:
$616,328
California:
$715,900
According to our research of California and other state lists, there were 42 registered sex offenders living in 92139 zip code as of May 04, 2024. The ratio of all residents to sex offenders in zip code 92139 is 887 to 1. The ratio of registered sex offenders to all residents in this zip code is near the state average.
Median resident age:
This zip code:
36.4 years
California median age:
37.9 years
Average household size:
This zip code:
3.4 people
California:
2.8 people
Averages for the 2020 tax year for zip code 92139, filed in 2021:
Average Adjusted Gross Income (AGI) in 2020: $52,068 (Individual Income Tax Returns)
Here:
$52,068
State:
$95,910
Salary/wage: $47,629 (reported on 84.9% of returns)
Here:
$47,629
State:
$77,331
(% of AGI for various income ranges: 1133.3% for AGIs below $25k, 3746.3% for AGIs $25k-50k, 6718.8% for AGIs $50k-75k, 10046.1% for AGIs $75k-100k, 17769.4% for AGIs $100k-200k, 53331.7% for AGIs over 200k)
Taxable interest for individuals: $416 (reported on 29.2% of returns)
This zip code:
$416
California:
$2,294
(% of AGI for various income ranges: 6.2% for AGIs below $25k, 8.1% for AGIs $25k-50k, 16.6% for AGIs $50k-75k, 28.9% for AGIs $75k-100k, 59.2% for AGIs $100k-200k, 265.0% for AGIs over 200k)
Ordinary dividends: $1,267 (reported on 7.4% of returns)
Here:
$1,267
State:
$10,949
(% of AGI for various income ranges: 4.9% for AGIs below $25k, 8.3% for AGIs $25k-50k, 13.4% for AGIs $50k-75k, 22.9% for AGIs $75k-100k, 36.0% for AGIs $100k-200k, 200.0% for AGIs over 200k)
Net capital gain/loss in AGI: +$4,494 (reported on 7.8% of returns)
Here:
+$4,494
State:
+$49,306
(% of AGI for various income ranges: 3.0% for AGIs below $25k, 4.6% for AGIs $25k-50k, 22.6% for AGIs $50k-75k, 44.5% for AGIs $75k-100k, 174.0% for AGIs $100k-200k, 4803.3% for AGIs over 200k)
Profit/loss from business: +$4,666 (reported on 12.0% of returns)
Here:
+$4,666
State:
+$15,671
(% of AGI for various income ranges: 73.7% for AGIs below $25k, 46.5% for AGIs $25k-50k, 66.2% for AGIs $50k-75k, 66.0% for AGIs $75k-100k, 175.9% for AGIs $100k-200k, 1216.7% for AGIs over 200k)
Taxable individual retirement arrangement distribution: $14,200 (reported on 4.1% of returns)
92139:
$14,200
California:
$23,505
(% of AGI for various income ranges: 21.1% for AGIs below $25k, 34.2% for AGIs $25k-50k, 79.5% for AGIs $50k-75k, 125.1% for AGIs $75k-100k, 416.4% for AGIs $100k-200k)
Total itemized deductions: $28,315 (reported on 11.6% of returns)
Here:
$28,315
State:
$39,517
(% of AGI for various income ranges: 48.6% for AGIs below $25k, 152.8% for AGIs $25k-50k, 509.0% for AGIs $50k-75k, 916.9% for AGIs $75k-100k, 2004.5% for AGIs $100k-200k, 6855.0% for AGIs over 200k)
Charity contributions: $5,205 (reported on 9.4% of returns)
Here:
$5,205
State:
$12,598
(% of AGI for various income ranges: 2.3% for AGIs below $25k, 17.8% for AGIs $25k-50k, 69.3% for AGIs $50k-75k, 132.8% for AGIs $75k-100k, 335.7% for AGIs $100k-200k, 1283.3% for AGIs over 200k)
Taxes paid: $7,573 (reported on 11.6% of returns)
92139:
$7,573
State:
$8,807
(% of AGI for various income ranges: 10.5% for AGIs below $25k, 36.5% for AGIs $25k-50k, 132.4% for AGIs $50k-75k, 261.9% for AGIs $75k-100k, 567.6% for AGIs $100k-200k, 1508.3% for AGIs over 200k)
Earned income credit: $1,986 (reported on 17.9% of returns)
Here:
$1,986
State:
$2,074
(% of AGI for various income ranges: 85.0% for AGIs below $25k, 68.1% for AGIs $25k-50k, 1.4% for AGIs $50k-75k)
Percentage of individuals using paid preparers for their 2020 taxes: 93.0%
Here:
93%
State:
92%
(% for various income ranges: 91.9% for AGIs below $25k, 93.8% for AGIs $25k-50k, 93.3% for AGIs $50k-75k, 93.3% for AGIs $75k-100k, 92.8% for AGIs $100k-200k, 94.4% for AGIs over 200k)
Averages for the 2012 tax year for zip code 92139, filed in 2013:
Average Adjusted Gross Income (AGI) in 2012: $43,069 (Individual Income Tax Returns)
Here:
$43,069
State:
$72,726
Salary/wage: $40,065 (reported on 88.2% of returns)
Here:
$40,065
State:
$59,079
(% of AGI for various income ranges: 80.0% for AGIs below $25k, 86.8% for AGIs $25k-50k, 82.9% for AGIs $50k-75k, 81.7% for AGIs $75k-100k, 79.5% for AGIs $100k-200k, 58.9% for AGIs over 200k)
Taxable interest for individuals: $379 (reported on 27.5% of returns)
This zip code:
$379
California:
$2,146
(% of AGI for various income ranges: 0.3% for AGIs below $25k, 0.2% for AGIs $25k-50k, 0.2% for AGIs $50k-75k, 0.3% for AGIs $75k-100k, 0.2% for AGIs $100k-200k, 0.2% for AGIs over 200k)
Ordinary dividends: $1,108 (reported on 6.6% of returns)
Here:
$1,108
State:
$9,308
(% of AGI for various income ranges: 0.2% for AGIs below $25k, 0.1% for AGIs $25k-50k, 0.1% for AGIs $50k-75k, 0.3% for AGIs $75k-100k, 0.2% for AGIs $100k-200k)
Net capital gain/loss in AGI: +$1,406 (reported on 4.9% of returns)
Here:
+$1,406
State:
+$30,460
(% of AGI for various income ranges: 0.8% for AGIs $100k-200k)
Profit/loss from business: +$5,967 (reported on 10.2% of returns)
Here:
+$5,967
State:
+$17,064
(% of AGI for various income ranges: 5.7% for AGIs below $25k, 1.6% for AGIs $25k-50k, 0.5% for AGIs $50k-75k, 0.6% for AGIs $75k-100k, 0.6% for AGIs $100k-200k)
Taxable individual retirement arrangement distribution: $11,911 (reported on 4.6% of returns)
92139:
$11,911
California:
$19,557
(% of AGI for various income ranges: 1.0% for AGIs below $25k, 0.8% for AGIs $25k-50k, 1.1% for AGIs $50k-75k, 1.3% for AGIs $75k-100k, 2.3% for AGIs $100k-200k)
Total itemized deductions: $21,230 (29% of AGI, reported on 29.5% of returns)
Here:
$21,230
State:
$34,004
Here:
28.6% of AGI
State:
22.7% of AGI
(% of AGI for various income ranges: 7.1% for AGIs below $25k, 10.6% for AGIs $25k-50k, 16.0% for AGIs $50k-75k, 17.4% for AGIs $75k-100k, 19.1% for AGIs $100k-200k, 19.5% for AGIs over 200k)
Charity contributions: $2,668 (reported on 24.2% of returns)
Here:
$2,668
State:
$4,659
(% of AGI for various income ranges: 0.4% for AGIs below $25k, 0.9% for AGIs $25k-50k, 1.6% for AGIs $50k-75k, 1.8% for AGIs $75k-100k, 2.3% for AGIs $100k-200k, 1.8% for AGIs over 200k)
Taxes paid: $5,332 (reported on 29.5% of returns)
92139:
$5,332
State:
$14,448
(% of AGI for various income ranges: 1.1% for AGIs below $25k, 2.1% for AGIs $25k-50k, 3.7% for AGIs $50k-75k, 4.5% for AGIs $75k-100k, 5.9% for AGIs $100k-200k, 6.1% for AGIs over 200k)
Earned income credit: $2,240 (reported on 24.0% of returns)
Here:
$2,240
State:
$2,286
(% of AGI for various income ranges: 7.3% for AGIs below $25k, 1.5% for AGIs $25k-50k)
Percentage of individuals using paid preparers for their 2012 taxes: 62.4%
Here:
62%
State:
64%
(% for various income ranges: 59.5% for AGIs below $25k, 60.2% for AGIs $25k-50k, 68.0% for AGIs $50k-75k, 68.4% for AGIs $75k-100k, 68.9% for AGIs $100k-200k, 57.1% for AGIs over 200k)
Averages for the 2004 tax year for zip code 92139, filed in 2005:
Average Adjusted Gross Income (AGI) in 2004: $37,742 (Individual Income Tax Returns)
Here:
$37,742
State:
$58,600
Salary/wage: $35,810 (reported on 90.6% of returns)
Here:
$35,810
State:
$49,455
(% of AGI for various income ranges: 92.5% for AGIs below $10k, 84.9% for AGIs $10k-25k, 88.7% for AGIs $25k-50k, 86.6% for AGIs $50k-75k, 86.9% for AGIs $75k-100k, 77.8% for AGIs over 100k)
Taxable interest for individuals: $468 (reported on 38.5% of returns)
This zip code:
$468
California:
$2,365
(% of AGI for various income ranges: 1.6% for AGIs below $10k, 0.6% for AGIs $10k-25k, 0.4% for AGIs $25k-50k, 0.5% for AGIs $50k-75k, 0.5% for AGIs $75k-100k, 0.3% for AGIs over 100k)
Taxable dividends: $822 (reported on 9.5% of returns)
Here:
$822
State:
$4,746
(% of AGI for various income ranges: 0.5% for AGIs below $10k, 0.3% for AGIs $10k-25k, 0.1% for AGIs $25k-50k, 0.1% for AGIs $50k-75k, 0.3% for AGIs $75k-100k, 0.3% for AGIs over 100k)
Net capital gain/loss: +$4,736 (reported on 6.7% of returns)
Here:
+$4,736
State:
+$23,418
(% of AGI for various income ranges: -0.3% for AGIs below $10k, 0.1% for AGIs $10k-25k, 0.1% for AGIs $25k-50k, -0.1% for AGIs $50k-75k, 0.3% for AGIs $75k-100k, 5.6% for AGIs over 100k)
Profit/loss from business: +$6,297 (reported on 9.4% of returns)
Here:
+$6,297
State:
+$16,826
(% of AGI for various income ranges: 6.6% for AGIs below $10k, 3.8% for AGIs $10k-25k, 1.5% for AGIs $25k-50k, 1.0% for AGIs $50k-75k, 0.7% for AGIs $75k-100k, 1.1% for AGIs over 100k)
IRA payment deduction: $2,125 (reported on 2.0% of returns)
92139:
$2,125
California:
$3,192
(% of AGI for various income ranges: 0.1% for AGIs $10k-25k, 0.1% for AGIs $25k-50k, 0.1% for AGIs $50k-75k, 0.1% for AGIs $75k-100k, 0.1% for AGIs over 100k)
Self-employed pension: $2,364 (reported on 0.1% of returns)
Here:
$2,364
California:
$17,688
Total itemized deductions: $21,239 (34% of AGI, reported on 35.7% of returns)
Here:
$21,239
State:
$28,113
Here:
34.1% of AGI
State:
25.3% of AGI
(% of AGI for various income ranges: 9.6% for AGIs below $10k, 8.8% for AGIs $10k-25k, 17.2% for AGIs $25k-50k, 24.4% for AGIs $50k-75k, 25.0% for AGIs $75k-100k, 23.9% for AGIs over 100k)
Charity contributions deductions: $2,675 (4% of AGI, reported on 31.5% of returns)
Here:
$2,675
State:
$3,923
Here:
4.1% of AGI
State:
3.3% of AGI
(% of AGI for various income ranges: 0.5% for AGIs below $10k, 0.7% for AGIs $10k-25k, 1.6% for AGIs $25k-50k, 2.7% for AGIs $50k-75k, 3.1% for AGIs $75k-100k, 3.4% for AGIs over 100k)
Total tax: $3,604 (reported on 70.3% of returns)
92139:
$3,604
State:
$10,761
(% of AGI for various income ranges: 2.3% for AGIs below $10k, 3.5% for AGIs $10k-25k, 4.9% for AGIs $25k-50k, 6.7% for AGIs $50k-75k, 8.2% for AGIs $75k-100k, 12.2% for AGIs over 100k)
Earned income credit: $1,697 (reported on 19.3% of returns)
Here:
$1,697
State:
$1,763
Percentage of individuals using paid preparers for their 2004 taxes: 68.4%
Here:
68%
State:
66%
(% for various income ranges: 58.1% for AGIs below $10k, 69.0% for AGIs $10k-25k, 70.0% for AGIs $25k-50k, 72.7% for AGIs $50k-75k, 69.9% for AGIs $75k-100k, 71.9% for AGIs over 100k)
Household received Food Stamps/SNAP in the past 12 months: 1,356 Household did not receive Food Stamps/SNAP in the past 12 months: 8,793
Women who had a birth in the past 12 months: 542 (280 now married, 264 unmarried) Women who did not have a birth in the past 12 months: 8,385 (3,368 now married, 5,015 unmarried)
Housing units in zip code 92139 with a mortgage: 4,156 (210 second mortgage, 16 home equity loan, 125 both second mortgage and home equity loan) Houses without a mortgage: 95
Median monthly owner costs for units with a mortgage: $2,443 Median monthly owner costs for units without a mortgage: $585
Residents with income below the poverty level in 2022:
This zip code:
8.4%
Whole state:
12.2%
Residents with income below 50% of the poverty level in 2022:
This zip code:
4.4%
Whole state:
6.2%
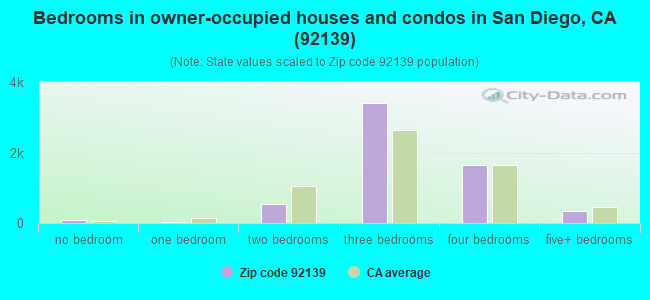
Median number of rooms in houses and condos:
Here:
5.8
State:
6.0
Median number of rooms in apartments:
Here:
4.3
State:
3.9
Notable locations in this zip code not listed on our city pages
Churches in zip code 92139 include: Highland Park Church (A), New Jerusalem Fellowship Church (B), Paradise Hills Southern Baptist Church (C), Saint Michaels Catholic Church (D), Saint Timothy Lutheran Church (E), Sweetwater Assembly of God Church (F), United Church of Christ (G), Puritan Evangelical Church of America (H), Ministerios de Amistad (I). Display/hide their locations on the map
Parks in zip code 92139 include: Paradise Hills Park (1), Bay Terrace Park and Recreation Center (2), Parkside Park (3), Penn Athletic Area (4). Display/hide their locations on the map
3,712 married couples with children.
2,282 single-parent households (333 men, 1,949 women).
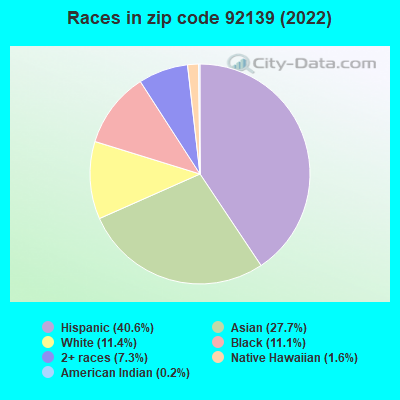
50.6% of residents of 92139 zip code speak English at home.
27.8% of residents speak Spanish at home (73% very well, 16% well, 8% not well, 2% not at all).
1.3% of residents speak other Indo-European language at home (70% very well, 28% well, 2% not well).
19.8% of residents speak Asian or Pacific Island language at home (59% very well, 34% well, 6% not well, 1% not at all).
0.5% of residents speak other language at home (58% very well, 26% well, 16% not well).
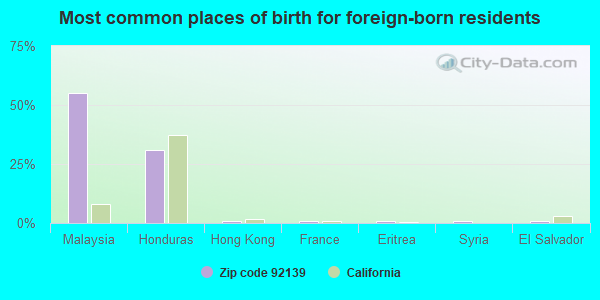
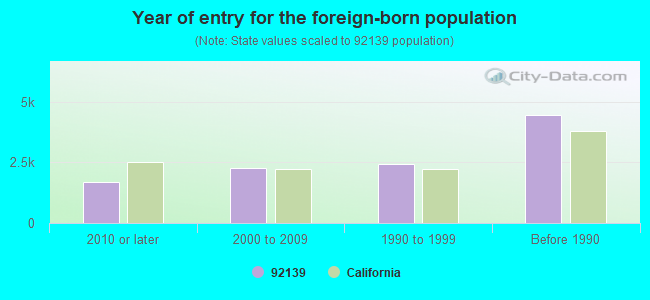
Foreign born population: 9,958 (28.7%) (65.0% of them are naturalized citizens)
Facilities with environmental interests located in this zip code:
LEE ELEMENTARY (6196 CHILDS AVE. in SAN DIEGO, CA)
(National Center for Education Statistics) - STATE ID-6039861 Organizations: SAN DIEGO UNIFIED (SCHOOL DISTRICT)
Housing units lacking complete plumbing facilities: 0.1% Housing units lacking complete kitchen facilities: 0.7%
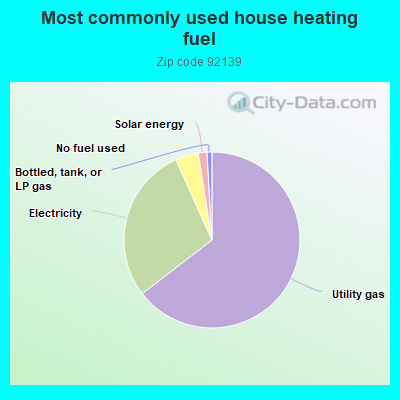
64.5%Utility gas
28.7%Electricity
4.2%No fuel used
1.6%Solar energy
0.9%Bottled, tank, or LP gas
Population in 1990: 35,577. Population change in the 1990s: +764 (+2.1%).
Place of birth for U.S.-born residents:
This state: 19,163
Northeast: 706
Midwest: 785
South: 2,311
West: 723
55% of the 92139 zip code residents lived in the same house 5 years ago. Out of people who lived in different houses, 78% lived in this county. Out of people who lived in different counties, 50% lived in California.
92% of the 92139 zip code residents lived in the same house 1 year ago. Out of people who lived in different houses, 77% moved from this county. Out of people who lived in different houses, 7% moved from different county within same state. Out of people who lived in different houses, 11% moved from different state. Out of people who lived in different houses, 4% moved from abroad.
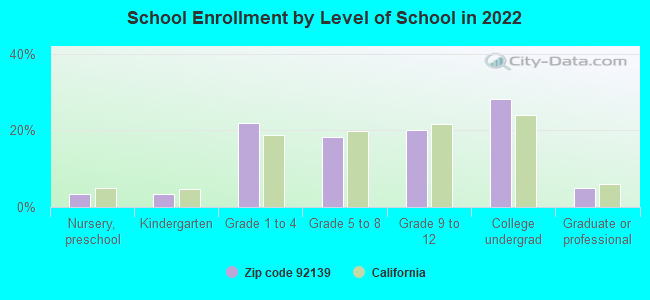
Private vs. public school enrollment:
Students in private schools in grades 1 to 8 (elementary and middle school): 347
Here:
9.6%
California:
10.5%
Students in private schools in grades 9 to 12 (high school): 136
Here:
7.6%
California:
8.5%
Students in private undergraduate colleges: 275
Here:
10.9%
California:
15.9%
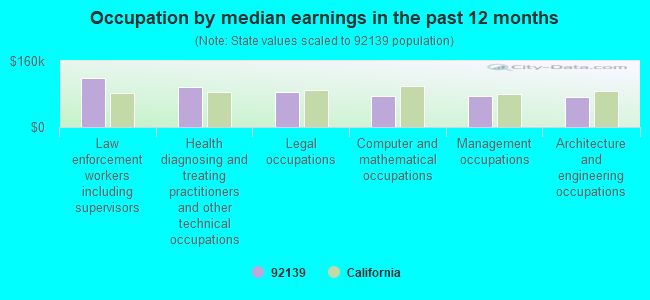
Occupation by median earnings in the past 12 months ($)
118,441Law enforcement workers including supervisors
96,141Health diagnosing and treating practitioners and other technical occupations
85,950Legal occupations
74,776Computer and mathematical occupations
74,704Management occupations
72,069Architecture and engineering occupations
Companies with federal contracts located in this zip code (SAN DIEGO, CA):
HANSEN, DELPHINE (1848 SHERBROOKE ST; small business) : $144,492 in 4 contractsfrom 2004 to 2005
$71,989 with Navy for Other Medical Services. Signed on 2005-10-18. Completion date: 2005-09-30.
$66,304 with Navy for Ophthalmology Services. Signed on 2004-08-17. Completion date: 2005-08-31.
$5,591 with Navy for Other Medical Services. Signed on 2005-07-11. Completion date: 2005-09-30.
$608 with Navy for Ophthalmology Services. Signed on 2005-09-16. Completion date: 2005-08-31.
MARY CLAIRE CALMA (2852 ALLEW WAY; small business) : $24,000 in 5 contractsfrom 2003 to 2005
Contracts for Musical Instruments, Chaplain Services by Navy Signed by year:2000: $0; 2001: $0; 2002: $0; 2003: $6,000; 2004: $12,000; 2005: $6,000; 2006: $0.
Biggest contracts:
$6,000 with Navy for Musical Instruments. Signed on 2005-09-22. Completion date: 2006-09-30.
$6,000 with Navy for Chaplain Services. Signed on 2004-09-25. Completion date: 2004-09-30.
$6,000, same as above.Signed on 2004-04-21. Completion date: 2004-09-30.
$6,000, same as above.Signed on 2003-09-27. Completion date: 2004-09-30.
FELLOWS, STEVEN M (6436 SEASCAPE DR; small business)
$6,125 with Department of Defense for Carpet Laying and Cleaning. Signed on 2004-10-01. Completion date: 2004-10-01.
LOCKWOOD, PANDORA (3020 MINOA WAY; small business) : $3,185 in 2 contractsin 2004
$3,185 with Navy for Gynecology Services. Signed on 2004-08-13. Completion date: 2004-04-30.
$0, same as above.Signed on 2004-08-13. Completion date: 2004-04-30.
Top industries in this zip code by the number of employees in 2005:
Health Care and Social Assistance: Nursing Care Facilities (100-249 employees: 1 establishment)
Health Care and Social Assistance: Child Day Care Services (10-19: 6, 5-9: 2, 1-4: 2)
Other Services (except Public Administration): Parking Lots and Garages (20-49: 1, 10-19: 1, 5-9: 3, 1-4: 1)
Administrative and Support and Waste Management and Remediation Services: Janitorial Services (20-49: 1, 10-19: 1, 1-4: 1)
Other Services (except Public Administration): Religious Organizations (10-19: 1, 5-9: 2, 1-4: 3)
Other Services (except Public Administration): Beauty Salons (10-19: 1, 1-4: 4)
Other Services (except Public Administration): Other Similar Organizations (except Business, Professional, Labor, and Political Organizations) (10-19: 1, 5-9: 1)
People in group quarters in 2010:
159 people in nursing facilities/skilled-nursing facilities
134 people in group homes intended for adults
36 people in workers' group living quarters and job corps centers
8 people in other noninstitutional facilities
5 people in group homes for juveniles (non-correctional)
People in group quarters in 2000:
139 people in nursing homes
25 people in homes for the physically handicapped
19 people in homes for the mentally ill
15 people in homes for the mentally retarded
11 people in homes or halfway houses for drug/alcohol abuse
7 people in other noninstitutional group quarters
4 people in residential treatment centers for emotionally disturbed children
4 people in other group homes
4 people in religious group quarters
Fatal accident statistics in 2014:
Fatal accident count: 1
Vehicles involved in fatal accidents: 1
Fatal accidents caused by drunken drivers: 0
Fatalities: 1
Persons involved in fatal accidents: 1
Pedestrians involved in fatal accidents: 1
Fatal accident statistics in 2012:
Fatal accident count: 1
Vehicles involved in fatal accidents: 1
Fatal accidents caused by drunken drivers: 1
Fatalities: 1
Persons involved in fatal accidents: 1
Pedestrians involved in fatal accidents: 0
Home Mortgage Disclosure Act Aggregated Statistics For Year 2009 (Based on 9 full and 6 partial tracts)
A) FHA, FSA/RHS & VA Home Purchase Loans
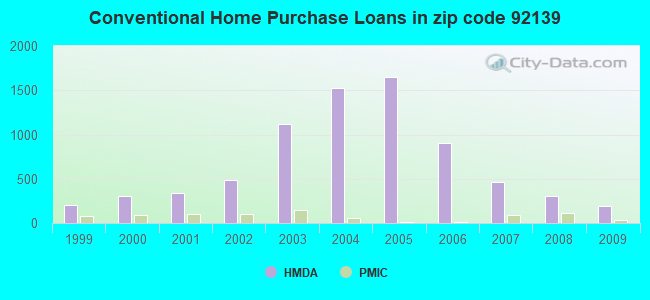
B) Conventional Home Purchase Loans
C) Refinancings
D) Home Improvement Loans
F) Non-occupant Loans on < 5 Family Dwellings (A B C & D)
G) Loans On Manufactured Home Dwelling (A B C & D)
Number
Average Value
Number
Average Value
Number
Average Value
Number
Average Value
Number
Average Value
Number
Average Value
LOANS ORIGINATED
577
$190,636
197
$157,329
442
$206,945
41
$87,480
67
$148,698
0
$0
APPLICATIONS APPROVED, NOT ACCEPTED
65
$227,717
41
$145,542
56
$208,767
0
$0
8
$133,112
2
$68,990
APPLICATIONS DENIED
102
$202,905
69
$160,033
256
$226,783
25
$85,944
61
$145,880
2
$38,770
APPLICATIONS WITHDRAWN
104
$194,711
48
$177,626
148
$220,741
7
$112,743
21
$138,459
0
$0
FILES CLOSED FOR INCOMPLETENESS
16
$195,834
2
$78,490
54
$191,392
0
$0
1
$66,000
0
$0
Aggregated Statistics For Year 2008 (Based on 9 full and 6 partial tracts)
A) FHA, FSA/RHS & VA Home Purchase Loans
B) Conventional Home Purchase Loans
C) Refinancings
D) Home Improvement Loans
E) Loans on Dwellings For 5+ Families
F) Non-occupant Loans on < 5 Family Dwellings (A B C & D)
G) Loans On Manufactured Home Dwelling (A B C & D)
Number
Average Value
Number
Average Value
Number
Average Value
Number
Average Value
Number
Average Value
Number
Average Value
Number
Average Value
LOANS ORIGINATED
347
$225,738
301
$155,391
309
$215,580
58
$143,246
3
$6,095,437
114
$178,582
3
$92,217
APPLICATIONS APPROVED, NOT ACCEPTED
34
$255,407
68
$192,389
101
$283,271
14
$114,227
0
$0
24
$206,949
5
$73,506
APPLICATIONS DENIED
78
$240,320
123
$226,008
468
$281,636
88
$151,264
0
$0
52
$248,696
7
$32,284
APPLICATIONS WITHDRAWN
63
$231,249
74
$171,537
198
$270,609
35
$142,493
0
$0
33
$196,648
0
$0
FILES CLOSED FOR INCOMPLETENESS
10
$302,077
34
$237,542
36
$265,557
0
$0
0
$0
14
$206,031
0
$0
Aggregated Statistics For Year 2007 (Based on 9 full and 6 partial tracts)
A) FHA, FSA/RHS & VA Home Purchase Loans
B) Conventional Home Purchase Loans
C) Refinancings
D) Home Improvement Loans
E) Loans on Dwellings For 5+ Families
F) Non-occupant Loans on < 5 Family Dwellings (A B C & D)
G) Loans On Manufactured Home Dwelling (A B C & D)
Number
Average Value
Number
Average Value
Number
Average Value
Number
Average Value
Number
Average Value
Number
Average Value
Number
Average Value
LOANS ORIGINATED
32
$261,663
460
$231,831
1,404
$264,397
152
$178,861
2
$45,053,750
204
$268,285
3
$72,770
APPLICATIONS APPROVED, NOT ACCEPTED
2
$250,515
142
$262,956
414
$278,326
49
$118,158
0
$0
53
$283,012
4
$47,852
APPLICATIONS DENIED
4
$256,478
257
$246,797
1,441
$313,046
212
$167,531
0
$0
125
$292,364
1
$95,060
APPLICATIONS WITHDRAWN
13
$166,364
138
$238,457
570
$299,342
50
$179,408
0
$0
49
$214,470
0
$0
FILES CLOSED FOR INCOMPLETENESS
0
$0
24
$262,760
173
$321,106
17
$227,134
0
$0
19
$304,616
0
$0
Aggregated Statistics For Year 2006 (Based on 9 full and 6 partial tracts)
A) FHA, FSA/RHS & VA Home Purchase Loans
B) Conventional Home Purchase Loans
C) Refinancings
D) Home Improvement Loans
E) Loans on Dwellings For 5+ Families
F) Non-occupant Loans on < 5 Family Dwellings (A B C & D)
G) Loans On Manufactured Home Dwelling (A B C & D)
Number
Average Value
Number
Average Value
Number
Average Value
Number
Average Value
Number
Average Value
Number
Average Value
Number
Average Value
LOANS ORIGINATED
18
$270,463
905
$212,407
2,563
$276,853
304
$191,688
4
$11,429,400
327
$282,993
2
$69,005
APPLICATIONS APPROVED, NOT ACCEPTED
1
$258,960
207
$224,816
720
$292,650
63
$188,640
0
$0
71
$283,918
5
$53,732
APPLICATIONS DENIED
2
$257,470
352
$241,200
1,625
$307,438
322
$175,844
0
$0
139
$276,065
10
$70,276
APPLICATIONS WITHDRAWN
6
$258,045
155
$265,538
1,021
$303,835
94
$168,614
0
$0
54
$277,907
0
$0
FILES CLOSED FOR INCOMPLETENESS
2
$265,425
62
$241,494
237
$305,770
17
$125,070
0
$0
22
$314,932
0
$0
Aggregated Statistics For Year 2005 (Based on 9 full and 6 partial tracts)
A) FHA, FSA/RHS & VA Home Purchase Loans
B) Conventional Home Purchase Loans
C) Refinancings
D) Home Improvement Loans
E) Loans on Dwellings For 5+ Families
F) Non-occupant Loans on < 5 Family Dwellings (A B C & D)
G) Loans On Manufactured Home Dwelling (A B C & D)
Number
Average Value
Number
Average Value
Number
Average Value
Number
Average Value
Number
Average Value
Number
Average Value
Number
Average Value
LOANS ORIGINATED
22
$303,115
1,648
$223,180
3,235
$276,164
402
$180,300
4
$1,593,798
395
$257,570
12
$192,186
APPLICATIONS APPROVED, NOT ACCEPTED
0
$0
342
$242,182
686
$267,618
55
$149,793
0
$0
63
$244,973
12
$68,518
APPLICATIONS DENIED
3
$254,780
516
$237,022
1,505
$297,796
251
$172,740
0
$0
110
$291,773
4
$123,088
APPLICATIONS WITHDRAWN
9
$273,667
332
$251,667
1,215
$276,161
150
$194,169
0
$0
107
$265,005
4
$163,032
FILES CLOSED FOR INCOMPLETENESS
0
$0
81
$246,409
372
$295,416
22
$194,120
0
$0
14
$236,440
0
$0
Aggregated Statistics For Year 2004 (Based on 9 full and 6 partial tracts)
A) FHA, FSA/RHS & VA Home Purchase Loans
B) Conventional Home Purchase Loans
C) Refinancings
D) Home Improvement Loans
E) Loans on Dwellings For 5+ Families
F) Non-occupant Loans on < 5 Family Dwellings (A B C & D)
G) Loans On Manufactured Home Dwelling (A B C & D)
Number
Average Value
Number
Average Value
Number
Average Value
Number
Average Value
Number
Average Value
Number
Average Value
Number
Average Value
LOANS ORIGINATED
16
$236,046
1,525
$219,152
3,582
$235,541
348
$160,775
10
$9,021,425
382
$214,744
13
$69,439
APPLICATIONS APPROVED, NOT ACCEPTED
4
$262,445
335
$225,114
677
$230,676
55
$186,586
0
$0
82
$248,268
6
$52,178
APPLICATIONS DENIED
5
$221,552
419
$213,676
1,324
$234,237
231
$110,899
0
$0
80
$237,689
7
$60,160
APPLICATIONS WITHDRAWN
4
$247,190
261
$215,514
1,297
$239,254
121
$142,777
2
$43,630
61
$238,141
4
$80,522
FILES CLOSED FOR INCOMPLETENESS
0
$0
83
$261,035
453
$256,722
27
$129,336
0
$0
21
$310,498
4
$56,880
Aggregated Statistics For Year 2003 (Based on 9 full and 6 partial tracts)
A) FHA, FSA/RHS & VA Home Purchase Loans
B) Conventional Home Purchase Loans
C) Refinancings
D) Home Improvement Loans
E) Loans on Dwellings For 5+ Families
F) Non-occupant Loans on < 5 Family Dwellings (A B C & D)
Number
Average Value
Number
Average Value
Number
Average Value
Number
Average Value
Number
Average Value
Number
Average Value
LOANS ORIGINATED
112
$217,736
1,119
$180,893
5,127
$176,234
128
$50,244
5
$3,777,554
450
$168,215
APPLICATIONS APPROVED, NOT ACCEPTED
10
$171,503
198
$189,101
835
$184,575
42
$44,050
0
$0
86
$191,548
APPLICATIONS DENIED
12
$232,598
237
$184,339
1,537
$189,194
150
$47,125
0
$0
126
$183,282
APPLICATIONS WITHDRAWN
17
$244,893
125
$181,070
1,325
$186,647
59
$102,173
1
$6,031,520
57
$151,250
FILES CLOSED FOR INCOMPLETENESS
1
$123,910
40
$197,847
234
$172,424
12
$38,452
0
$0
22
$155,277
Aggregated Statistics For Year 2002 (Based on 6 full and 2 partial tracts)
A) FHA, FSA/RHS & VA Home Purchase Loans
B) Conventional Home Purchase Loans
C) Refinancings
D) Home Improvement Loans
E) Loans on Dwellings For 5+ Families
F) Non-occupant Loans on < 5 Family Dwellings (A B C & D)
Number
Average Value
Number
Average Value
Number
Average Value
Number
Average Value
Number
Average Value
Number
Average Value
LOANS ORIGINATED
210
$189,875
482
$142,370
2,026
$151,040
72
$48,480
4
$602,382
199
$141,117
APPLICATIONS APPROVED, NOT ACCEPTED
18
$187,452
72
$161,450
357
$145,220
23
$69,093
0
$0
28
$145,362
APPLICATIONS DENIED
19
$191,709
99
$163,639
691
$147,302
74
$62,508
0
$0
68
$147,380
APPLICATIONS WITHDRAWN
27
$167,141
78
$151,814
582
$147,907
35
$47,989
0
$0
29
$132,576
FILES CLOSED FOR INCOMPLETENESS
6
$168,750
31
$144,977
173
$147,031
6
$77,970
0
$0
10
$126,902
Aggregated Statistics For Year 2001 (Based on 6 full and 2 partial tracts)
A) FHA, FSA/RHS & VA Home Purchase Loans
B) Conventional Home Purchase Loans
C) Refinancings
D) Home Improvement Loans
E) Loans on Dwellings For 5+ Families
F) Non-occupant Loans on < 5 Family Dwellings (A B C & D)
Number
Average Value
Number
Average Value
Number
Average Value
Number
Average Value
Number
Average Value
Number
Average Value
LOANS ORIGINATED
319
$157,434
335
$121,586
1,446
$126,408
60
$38,219
4
$10,815,195
177
$128,163
APPLICATIONS APPROVED, NOT ACCEPTED
21
$170,662
46
$127,327
224
$117,469
21
$49,240
0
$0
17
$117,611
APPLICATIONS DENIED
29
$167,090
96
$121,383
701
$120,754
75
$47,537
0
$0
41
$102,003
APPLICATIONS WITHDRAWN
20
$149,502
58
$127,137
434
$128,067
44
$39,235
0
$0
27
$131,594
FILES CLOSED FOR INCOMPLETENESS
4
$171,158
10
$165,562
168
$141,656
6
$22,892
0
$0
4
$118,728
Aggregated Statistics For Year 2000 (Based on 6 full and 2 partial tracts)
A) FHA, FSA/RHS & VA Home Purchase Loans
B) Conventional Home Purchase Loans
C) Refinancings
D) Home Improvement Loans
E) Loans on Dwellings For 5+ Families
F) Non-occupant Loans on < 5 Family Dwellings (A B C & D)
Number
Average Value
Number
Average Value
Number
Average Value
Number
Average Value
Number
Average Value
Number
Average Value
LOANS ORIGINATED
342
$132,990
304
$100,742
389
$93,567
98
$29,239
4
$6,800,612
59
$84,257
APPLICATIONS APPROVED, NOT ACCEPTED
35
$147,831
41
$91,546
95
$102,767
50
$32,321
0
$0
10
$119,587
APPLICATIONS DENIED
38
$128,396
96
$88,817
326
$88,337
119
$20,881
0
$0
21
$70,813
APPLICATIONS WITHDRAWN
35
$131,485
61
$108,061
192
$95,917
12
$26,537
0
$0
10
$78,927
FILES CLOSED FOR INCOMPLETENESS
8
$139,742
18
$73,275
75
$121,012
2
$22,865
0
$0
10
$89,252
Aggregated Statistics For Year 1999 (Based on 3 full and 3 partial tracts)
A) FHA, FSA/RHS & VA Home Purchase Loans
B) Conventional Home Purchase Loans
C) Refinancings
D) Home Improvement Loans
E) Loans on Dwellings For 5+ Families
F) Non-occupant Loans on < 5 Family Dwellings (A B C & D)
2005 - 2018 National Fire Incident Reporting System (NFIRS) incidents
According to the data from the years 2005 - 2018 the average number of fires per year is 31. The highest number of reported fire incidents - 56 took place in 2017, and the least - 4 in 2006. The data has an increasing trend.
When looking into fire subcategories, the most reports belonged to: Structure Fires (50.1%), and Outside Fires (31.0%).
Fire incident types reported to NFIRS in Zip Code 92139


 Nearest zip codes: 92114, 91902, 91910, 91950, 91945, 92113.


 According to the data from the years 2005 - 2018 the average number of fires per year is 31. The highest number of reported fire incidents - 56 took place in 2017, and the least - 4 in 2006. The data has an increasing trend.
 When looking into fire subcategories, the most reports belonged to: Structure Fires (50.1%), and Outside Fires (31.0%).