Estimated zip code population in 2022: 823 Zip code population in 2010: 740 Zip code population in 2000: 662
Houses and condos: 253 Renter-occupied apartments: 127
% of renters here:
56%
State:
44%
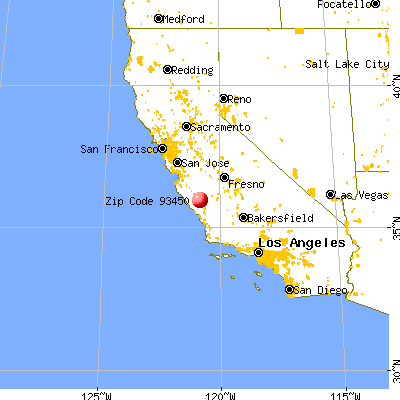
March 2022 cost of living index in zip code 93450: 96.9 (near average, U.S. average is 100)
Land area: 169.8 sq. mi. Water area: 3.5 sq. mi.
Population density: 5 people per square mile
(very low).
OSM Map
General Map
Google Map
MSN Map
OSM Map
General Map
Google Map
MSN Map
OSM Map
General Map
Google Map
MSN Map
OSM Map
General Map
Google Map
MSN Map
Please wait while loading the map...
Real estate property taxes paid for housing units in 2022:
This zip code:
0.9% ($3,673)
California:
0.7% ($4,831)
Median real estate property taxes paid for housing units with mortgages in 2022: $4,353 (1.2%) Median real estate property taxes paid for housing units with no mortgage in 2022: $3,636 (0.9%)
Business Search- 14 Million verified businesses
Males: 455
(55.4%)
Females: 367
(44.6%)
For population 25 years and over in 93450:
High school or higher: 63.9%
Bachelor's degree or higher: 4.9%
Graduate or professional degree: 1.8%
Unemployed: 15.1%
Mean travel time to work (commute): 18.8 minutes
For population 15 years and over in 93450:
Never married: 50.8%
Now married: 43.2%
Separated: 0.0%
Widowed: 4.9%
Divorced: 1.1%
Zip code 93450 compared to state average:
Median house value below state average.
Unemployed percentage above state average.
Black race population percentage significantly below state average.
Hispanic race population percentage above state average.
Median age below state average.
Length of stay since moving in significantly above state average.
Number of college students significantly below state average.
Percentage of population with a bachelor's degree or higher significantly below state average.
Averages for the 2020 tax year for zip code 93450, filed in 2021:
Average Adjusted Gross Income (AGI) in 2020: $72,304 (Individual Income Tax Returns)
Here:
$72,304
State:
$95,910
Salary/wage: $40,826 (reported on 92.0% of returns)
Here:
$40,826
State:
$77,331
(% of AGI for various income ranges: 2076.7% for AGIs below $25k, 4760.0% for AGIs $25k-50k, 5912.5% for AGIs $50k-75k)
Taxable interest for individuals: $900 (reported on 12.0% of returns)
This zip code:
$900
California:
$2,294
(% of AGI for various income ranges: )
Ordinary dividends: $19,200 (reported on 8.0% of returns)
Here:
$19,200
State:
$10,949
(% of AGI for various income ranges: 548.6% for AGIs $25k-50k)
Net capital gain/loss in AGI: +$35,550 (reported on 8.0% of returns)
Here:
+$35,550
State:
+$49,306
(% of AGI for various income ranges: 1015.7% for AGIs $25k-50k)
Earned income credit: $1,820 (reported on 20.0% of returns)
Here:
$1,820
State:
$2,074
(% of AGI for various income ranges: 113.3% for AGIs below $25k, 81.4% for AGIs $25k-50k)
Percentage of individuals using paid preparers for their 2020 taxes: 96.0%
Here:
96%
State:
92%
(% for various income ranges: 100.0% for AGIs below $25k, 90.0% for AGIs $25k-50k, 100.0% for AGIs $50k-75k, 100.0% for AGIs $75k-100k, 100.0% for AGIs $100k-200k)
Averages for the 2012 tax year for zip code 93450, filed in 2013:
Average Adjusted Gross Income (AGI) in 2012: $110,162 (Individual Income Tax Returns)
Here:
$110,162
State:
$72,726
Salary/wage: $36,620 (reported on 83.3% of returns)
Here:
$36,620
State:
$59,079
(% of AGI for various income ranges: 82.8% for AGIs below $25k, 81.9% for AGIs $25k-50k, 119.1% for AGIs $50k-75k)
Taxable interest for individuals: $1,920 (reported on 20.8% of returns)
This zip code:
$1,920
California:
$2,146
Ordinary dividends: $11,733 (reported on 12.5% of returns)
Here:
$11,733
State:
$9,308
Net capital gain/loss in AGI: +$12,267 (reported on 12.5% of returns)
Here:
+$12,267
State:
+$30,460
Total itemized deductions: $92,950 (19% of AGI, reported on 16.7% of returns)
Here:
$92,950
State:
$34,004
Here:
19.0% of AGI
State:
22.7% of AGI
Charity contributions: $26,600 (reported on 12.5% of returns)
Here:
$26,600
State:
$4,659
Taxes paid: $58,975 (reported on 16.7% of returns)
93450:
$58,975
State:
$14,448
Earned income credit: $3,300 (reported on 16.7% of returns)
Here:
$3,300
State:
$2,286
(% of AGI for various income ranges: 9.9% for AGIs below $25k)
Percentage of individuals using paid preparers for their 2012 taxes: 87.5%
Here:
88%
State:
64%
(% for various income ranges: 88.9% for AGIs below $25k, 85.7% for AGIs $25k-50k, 80.0% for AGIs $50k-75k, 100.0% for AGIs $100k-200k)
Averages for the 2004 tax year for zip code 93450, filed in 2005:
Average Adjusted Gross Income (AGI) in 2004: $45,977 (Individual Income Tax Returns)
Here:
$45,977
State:
$58,600
Salary/wage: $34,746 (reported on 84.1% of returns)
Here:
$34,746
State:
$49,455
(% of AGI for various income ranges: 70.3% for AGIs below $10k, 82.5% for AGIs $10k-25k, 81.6% for AGIs $25k-50k, 89.1% for AGIs $50k-75k, 77.7% for AGIs $75k-100k, 27.7% for AGIs over 100k)
Taxable interest for individuals: $2,347 (reported on 32.7% of returns)
This zip code:
$2,347
California:
$2,365
(% of AGI for various income ranges: 1.7% for AGIs $10k-25k, 0.3% for AGIs $25k-50k, 0.6% for AGIs $50k-75k, 3.7% for AGIs over 100k)
Taxable dividends: $5,138 (reported on 13.2% of returns)
Here:
$5,138
State:
$4,746
Net capital gain/loss: +$250 (reported on 9.1% of returns)
Here:
+$250
State:
+$23,418
Profit/loss from business: +$3,625 (reported on 7.3% of returns)
Here:
+$3,625
State:
+$16,826
Total itemized deductions: $29,400 (26% of AGI, reported on 20.5% of returns)
Here:
$29,400
State:
$28,113
Here:
26.5% of AGI
State:
25.3% of AGI
(% of AGI for various income ranges: 9.2% for AGIs $25k-50k, 8.2% for AGIs $50k-75k, 18.9% for AGIs $75k-100k, 20.7% for AGIs over 100k)
Charity contributions deductions: $3,909 (3% of AGI, reported on 15.0% of returns)
Here:
$3,909
State:
$3,923
Here:
3.1% of AGI
State:
3.3% of AGI
Total tax: $8,022 (reported on 61.4% of returns)
93450:
$8,022
State:
$10,761
(% of AGI for various income ranges: 2.1% for AGIs $10k-25k, 4.5% for AGIs $25k-50k, 7.9% for AGIs $50k-75k, 9.9% for AGIs $75k-100k, 19.4% for AGIs over 100k)
Earned income credit: $2,000 (reported on 25.0% of returns)
Here:
$2,000
State:
$1,763
Percentage of individuals using paid preparers for their 2004 taxes: 85.0%
Here:
85%
State:
66%
(% for various income ranges: 89.3% for AGIs below $10k, 88.1% for AGIs $10k-25k, 80.0% for AGIs $25k-50k, 93.8% for AGIs $50k-75k, 71.4% for AGIs $75k-100k, 78.6% for AGIs over 100k)
Household received Food Stamps/SNAP in the past 12 months: 25 Household did not receive Food Stamps/SNAP in the past 12 months: 202
Women who had a birth in the past 12 months: 9 (9 now married, 0 unmarried) Women who did not have a birth in the past 12 months: 134 (28 now married, 106 unmarried)
Housing units in zip code 93450 with a mortgage: 43 Median monthly owner costs for units with a mortgage: $2,036 Median monthly owner costs for units without a mortgage: $788
Residents with income below the poverty level in 2022:
This zip code:
15.4%
Whole state:
12.2%
Residents with income below 50% of the poverty level in 2022:
This zip code:
14.6%
Whole state:
6.2%
Median number of rooms in houses and condos:
Here:
5.1
State:
6.0
Median number of rooms in apartments:
Here:
4.7
State:
3.9
Notable locations in this zip code not listed on our city pages
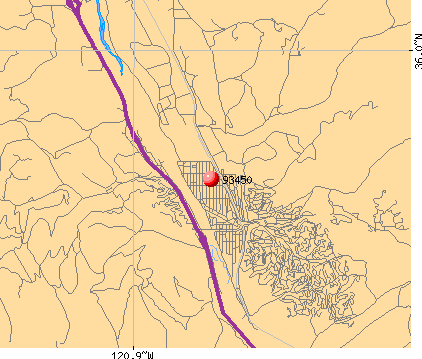
Notable locations in zip code 93450: Getty Siding (A), San Ardo Branch Monterey County Free Libraries (B), San Ardo Volunteer Fire Company (C). Display/hide their locations on the map
Size of family households: 64 2-persons, 22 3-persons, 68 4-persons, 29 5-persons, 8 6-persons, 8 7-or-more-persons
Size of nonfamily households: 7 1-person, 15 2-persons
62 married couples with children.
73 single-parent households (31 men, 42 women).
48.5% of residents of 93450 zip code speak English at home.
49.8% of residents speak Spanish at home (55% very well, 7% well, 13% not well, 25% not at all).
1.0% of residents speak other Indo-European language at home (100% very well).
Foreign born population: 222 (27.1%) (5.4% of them are naturalized citizens)
This zip code:
27.1%
Whole state:
26.7%
92%Honduras
6%Costa Rica
7%English
6%Irish
4%German
2%French
2%Portuguese
0%Basque
Year of entry for the foreign-born population
352010 or later
962000 to 2009
361990 to 1999
54Before 1990
Facilities with environmental interests located in this zip code:
AERA ENERGY LLC (66893 SARGENT CANYON ROAD in SAN ARDO, CA)
AIR MAJOR (AIRS/AFS) OIL CONTROL (Facility Response Plan for oil discharge) STATE MASTER (California - Hazardous Waste Tracking) - HAZARDOU WASTE PROGRAM CRITERIA AND HAZARDOUS AIR POLLUTANT INVENTORY (Inventory of air pollution sources) Large Quantity Generators, more that 1000 kg of hazardous waste/month (Resource Conservation and Recovery Act (tracking hazardous waste)) - notification Business SIC classification: CRUDE PETROLEUM AND NATURAL GAS Alternative names: AERA ENERGY LLC AERA SAN ARDO OIL FIELD, AERA SAN ARDO UNIT
CHEVRONTEXACO E AND P COMPANY (STAR ROUTE 42 in SAN ARDO, CA)
AIR MAJOR (AIRS/AFS) STATE MASTER (California - Hazardous Waste Tracking) - HAZARDOU WASTE PROGRAM CRITERIA AND HAZARDOUS AIR POLLUTANT INVENTORY (Inventory of air pollution sources) Large Quantity Generators, more that 1000 kg of hazardous waste/month (Resource Conservation and Recovery Act (tracking hazardous waste)) Business SIC and NAICS classification: CRUDE PETROLEUM AND NATURAL GAS Alternative names: TEXACO INC SAN ARDO FIELD, TEXACO E & P INC
MOBIL OIL CORP SAN ARDO STATION (SARGENT CANYON ROAD OFF HWY 101 in SAN ARDO, CA)
CRITERIA AND HAZARDOUS AIR POLLUTANT INVENTORY (Inventory of air pollution sources) Small Quantity Generators, between 100 kg and 1000 kg of hazardous waste/month (Resource Conservation and Recovery Act (tracking hazardous waste)) Business SIC classification: CRUDE PETROLEUM AND NATURAL GAS; CRUDE PETROLEUM PIPELINES Business NAICS classification: CRUDE PETROLEUM AND NATURAL GAS EXTRACTION. Alternative names: MOBIL OIL,STAR ROUTE
EXXONMOBIL OIL CORPORATION (67040 SARGENT CANYON RD in SAN ARDO, CA)
AIR MAJOR (AIRS/AFS) CRITERIA AND HAZARDOUS AIR POLLUTANT INVENTORY (Inventory of air pollution sources) Business SIC classification: CRUDE PETROLEUM PIPELINES Alternative names: EXXONMOBIL CORP
GARY ZIPPERER (CATTLEMEN ROAD in SAN ARDO, CA)
CRITERIA AND HAZARDOUS AIR POLLUTANT INVENTORY (Inventory of air pollution sources) Business SIC classification: GASOLINE SERVICE STATIONS
LOS LOBOS GAS (HWY 101 & LOS LOBOS ROAD in SAN ARDO, CA)
CRITERIA AND HAZARDOUS AIR POLLUTANT INVENTORY (Inventory of air pollution sources) Business SIC classification: GASOLINE SERVICE STATIONS
MOBIL OIL SANITARY LANDFILL (SAN ARDO OIL FIELDS, SERGEANT in SAN ARDO, CA)
CRITERIA AND HAZARDOUS AIR POLLUTANT INVENTORY (Inventory of air pollution sources) Business SIC classification: REFUSE SYSTEMS Business NAICS classification: SOLID WASTE LANDFILL.
57.1%Electricity
27.2%Utility gas
10.7%Bottled, tank, or LP gas
4.0%Solar energy
1.3%Other fuel
Population in 1990: 1,684.
Place of birth for U.S.-born residents:
This state: 573
Northeast: 15
South: 11
West: 1
64% of the 93450 zip code residents lived in the same house 5 years ago. Out of people who lived in different houses, 58% lived in this county. Out of people who lived in different counties, 50% lived in California.
90% of the 93450 zip code residents lived in the same house 1 year ago. Out of people who lived in different houses, 38% moved from this county. Out of people who lived in different houses, 60% moved from different county within same state.
Private vs. public school enrollment:
Students in private schools in grades 1 to 8 (elementary and middle school): 3
Here:
2.7%
California:
10.5%
Students in private schools in grades 9 to 12 (high school):
Here:
0.0%
California:
8.5%
Students in private undergraduate colleges:
Here:
0.0%
California:
15.9%
Occupation by median earnings in the past 12 months ($)
73,738Installation, maintenance, and repair occupations
62,251Management occupations
40,856Farming, fishing, and forestry occupations
33,092Building and grounds cleaning and maintenance occupations
Top industries in this zip code by the number of employees in 2005:
Construction: Water and Sewer Line and Related Structures Construction (50-99 employees: 1 establishment)
Real Estate and Rental and Leasing: Construction, Mining, and Forestry Machinery and Equipment Rental and Leasing (50-99: 1)
Administrative and Support and Waste Management and Remediation Services: Hazardous Waste Collection (50-99: 1)
Professional, Scientific, and Technical Services: Other Scientific and Technical Consulting Services (10-19: 1)
Utilities: Hydroelectric Power Generation (5-9: 2)
Real Estate and Rental and Leasing: Lessors of Nonfinancial Intangible Assets (except Copyrighted Works) (5-9: 1)
Construction: Plumbing, Heating, and Air-Conditioning Contractors (5-9: 1)
Health Care and Social Assistance: Offices of Dentists (5-9: 1)
Fatal accident statistics in 2013:
Fatal accident count: 1
Vehicles involved in fatal accidents: 1
Fatal accidents caused by drunken drivers: 0
Fatalities: 1
Persons involved in fatal accidents: 1
Pedestrians involved in fatal accidents: 0
Home Mortgage Disclosure Act Aggregated Statistics For Year 2009 (Based on 2 partial tracts)
A) FHA, FSA/RHS & VA Home Purchase Loans
B) Conventional Home Purchase Loans
C) Refinancings
F) Non-occupant Loans on < 5 Family Dwellings (A B C & D)
G) Loans On Manufactured Home Dwelling (A B C & D)
Number
Average Value
Number
Average Value
Number
Average Value
Number
Average Value
Number
Average Value
LOANS ORIGINATED
1
$281,480
1
$200,120
5
$289,216
1
$325,060
1
$247,160
APPLICATIONS APPROVED, NOT ACCEPTED
0
$0
0
$0
0
$0
0
$0
0
$0
APPLICATIONS DENIED
0
$0
0
$0
5
$321,250
1
$299,280
1
$202,480
APPLICATIONS WITHDRAWN
0
$0
0
$0
2
$323,430
0
$0
0
$0
FILES CLOSED FOR INCOMPLETENESS
0
$0
0
$0
1
$2,443,060
0
$0
0
$0
Aggregated Statistics For Year 2008 (Based on 2 partial tracts)
B) Conventional Home Purchase Loans
C) Refinancings
D) Home Improvement Loans
F) Non-occupant Loans on < 5 Family Dwellings (A B C & D)
G) Loans On Manufactured Home Dwelling (A B C & D)
Number
Average Value
Number
Average Value
Number
Average Value
Number
Average Value
Number
Average Value
LOANS ORIGINATED
1
$461,260
4
$321,070
1
$100,060
1
$405,510
0
$0
APPLICATIONS APPROVED, NOT ACCEPTED
0
$0
1
$198,670
0
$0
0
$0
0
$0
APPLICATIONS DENIED
1
$289,470
6
$255,390
0
$0
1
$419,310
2
$241,435
APPLICATIONS WITHDRAWN
0
$0
1
$217,920
0
$0
0
$0
0
$0
FILES CLOSED FOR INCOMPLETENESS
0
$0
1
$156,720
0
$0
0
$0
0
$0
Aggregated Statistics For Year 2007 (Based on 2 partial tracts)
B) Conventional Home Purchase Loans
C) Refinancings
D) Home Improvement Loans
F) Non-occupant Loans on < 5 Family Dwellings (A B C & D)
G) Loans On Manufactured Home Dwelling (A B C & D)
Number
Average Value
Number
Average Value
Number
Average Value
Number
Average Value
Number
Average Value
LOANS ORIGINATED
5
$287,218
11
$342,448
1
$313,620
1
$356,660
2
$392,980
APPLICATIONS APPROVED, NOT ACCEPTED
1
$341,040
3
$469,557
1
$163,980
1
$246,250
0
$0
APPLICATIONS DENIED
3
$353,150
13
$360,867
3
$210,960
2
$439,020
3
$246,917
APPLICATIONS WITHDRAWN
0
$0
5
$429,666
0
$0
1
$288,020
1
$373,370
FILES CLOSED FOR INCOMPLETENESS
0
$0
2
$367,650
0
$0
0
$0
0
$0
Aggregated Statistics For Year 2006 (Based on 2 partial tracts)
B) Conventional Home Purchase Loans
C) Refinancings
D) Home Improvement Loans
F) Non-occupant Loans on < 5 Family Dwellings (A B C & D)
G) Loans On Manufactured Home Dwelling (A B C & D)
Number
Average Value
Number
Average Value
Number
Average Value
Number
Average Value
Number
Average Value
LOANS ORIGINATED
5
$339,010
11
$357,256
2
$263,050
2
$421,130
1
$296,370
APPLICATIONS APPROVED, NOT ACCEPTED
2
$422,400
2
$410,690
0
$0
0
$0
1
$164,710
APPLICATIONS DENIED
2
$370,645
10
$374,078
2
$101,335
0
$0
1
$426,940
APPLICATIONS WITHDRAWN
1
$367,560
5
$270,656
1
$118,220
1
$178,690
0
$0
FILES CLOSED FOR INCOMPLETENESS
0
$0
1
$544,620
0
$0
0
$0
0
$0
Aggregated Statistics For Year 2005 (Based on 2 partial tracts)
B) Conventional Home Purchase Loans
C) Refinancings
D) Home Improvement Loans
F) Non-occupant Loans on < 5 Family Dwellings (A B C & D)
G) Loans On Manufactured Home Dwelling (A B C & D)
Number
Average Value
Number
Average Value
Number
Average Value
Number
Average Value
Number
Average Value
LOANS ORIGINATED
6
$316,862
14
$290,080
2
$167,890
3
$193,463
2
$210,295
APPLICATIONS APPROVED, NOT ACCEPTED
1
$357,210
3
$266,953
1
$49,030
1
$189,950
1
$123,310
APPLICATIONS DENIED
5
$292,558
12
$300,805
1
$197,940
1
$584,390
3
$175,547
APPLICATIONS WITHDRAWN
2
$285,840
7
$292,480
0
$0
1
$155,270
2
$245,615
FILES CLOSED FOR INCOMPLETENESS
0
$0
3
$272,220
0
$0
0
$0
0
$0
Aggregated Statistics For Year 2004 (Based on 2 partial tracts)
B) Conventional Home Purchase Loans
C) Refinancings
D) Home Improvement Loans
F) Non-occupant Loans on < 5 Family Dwellings (A B C & D)
G) Loans On Manufactured Home Dwelling (A B C & D)
Number
Average Value
Number
Average Value
Number
Average Value
Number
Average Value
Number
Average Value
LOANS ORIGINATED
3
$379,967
11
$315,026
3
$177,967
2
$373,825
2
$232,355
APPLICATIONS APPROVED, NOT ACCEPTED
2
$372,280
2
$250,700
0
$0
0
$0
0
$0
APPLICATIONS DENIED
4
$277,530
10
$314,894
1
$211,560
1
$377,000
3
$135,957
APPLICATIONS WITHDRAWN
1
$359,390
6
$307,510
1
$199,760
0
$0
0
$0
FILES CLOSED FOR INCOMPLETENESS
0
$0
1
$236,990
0
$0
0
$0
0
$0
Aggregated Statistics For Year 2003 (Based on 2 partial tracts)
B) Conventional Home Purchase Loans
C) Refinancings
F) Non-occupant Loans on < 5 Family Dwellings (A B C & D)
Number
Average Value
Number
Average Value
Number
Average Value
LOANS ORIGINATED
5
$223,586
16
$204,152
2
$235,625
APPLICATIONS APPROVED, NOT ACCEPTED
1
$98,430
2
$309,720
0
$0
APPLICATIONS DENIED
2
$205,115
8
$190,839
1
$115,320
APPLICATIONS WITHDRAWN
1
$115,680
5
$191,116
0
$0
FILES CLOSED FOR INCOMPLETENESS
0
$0
1
$295,830
0
$0
Aggregated Statistics For Year 1999 (Based on 1 partial tract)
B) Conventional Home Purchase Loans
C) Refinancings
F) Non-occupant Loans on < 5 Family Dwellings (A B C & D)
Detailed HMDA statistics for the following Tracts:0114.00
Private Mortgage Insurance Companies Aggregated Statistics For Year 2003 (Based on 2 partial tracts)
A) Conventional Home Purchase Loans
Number
Average Value
LOANS ORIGINATED
1
$126,760
APPLICATIONS APPROVED, NOT ACCEPTED
0
$0
APPLICATIONS DENIED
0
$0
APPLICATIONS WITHDRAWN
0
$0
FILES CLOSED FOR INCOMPLETENESS
0
$0
Detailed PMIC statistics for the following Tracts:0114.00
2006 - 2018 National Fire Incident Reporting System (NFIRS) incidents
According to the data from the years 2006 - 2018 the average number of fires per year is 9. The highest number of reported fire incidents - 15 took place in 2013, and the least - 1 in 2006. The data has a growing trend.
When looking into fire subcategories, the most incidents belonged to: Outside Fires (61.2%), and Mobile Property/Vehicle Fires (28.1%).
Fire incident types reported to NFIRS in Zip Code 93450


 Nearest zip codes: 93954, 93930, 93932, 93426, 93451, 93210.


 According to the data from the years 2006 - 2018 the average number of fires per year is 9. The highest number of reported fire incidents - 15 took place in 2013, and the least - 1 in 2006. The data has a growing trend.
 When looking into fire subcategories, the most incidents belonged to: Outside Fires (61.2%), and Mobile Property/Vehicle Fires (28.1%).