Estimated zip code population in 2022: 7,992 Zip code population in 2010: 7,646 Zip code population in 2000: 7,942
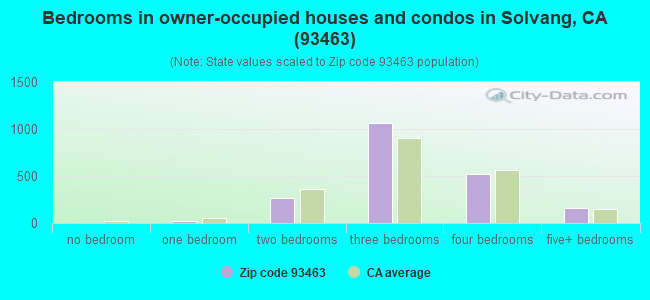
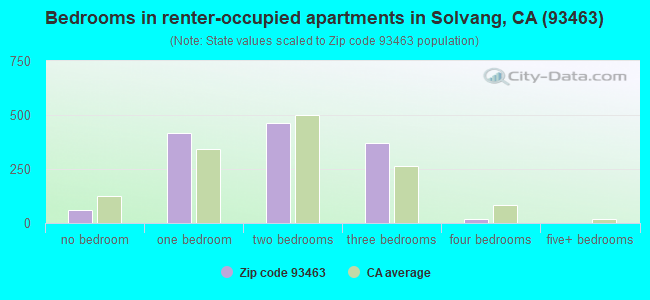
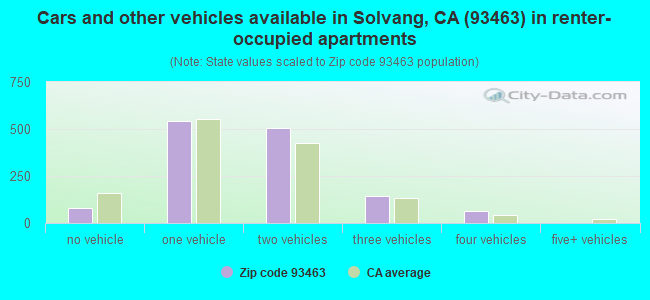
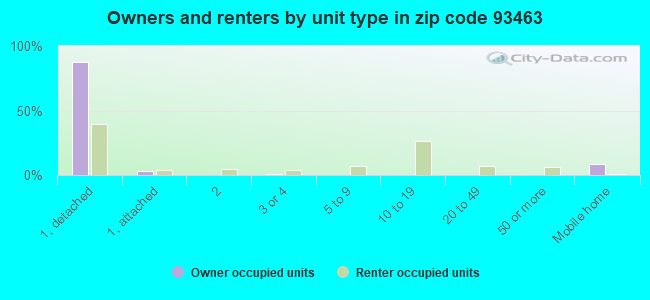
Houses and condos: 3,632 Renter-occupied apartments: 1,338
% of renters here:
40%
State:
44%
March 2022 cost of living index in zip code 93463: 112.6 (more than average, U.S. average is 100)
Land area: 30.2 sq. mi. Water area: 0.2 sq. mi.
Population density: 265 people per square mile
(very low).
OSM Map
General Map
Google Map
MSN Map
OSM Map
General Map
Google Map
MSN Map
OSM Map
General Map
Google Map
MSN Map
OSM Map
General Map
Google Map
MSN Map
Please wait while loading the map...
Real estate property taxes paid for housing units in 2022:
This zip code:
0.7% ($7,714)
California:
0.7% ($4,831)
Median real estate property taxes paid for housing units with mortgages in 2022: $8,322 (0.7%) Median real estate property taxes paid for housing units with no mortgage in 2022: $6,231 (0.7%)
Business Search- 14 Million verified businesses
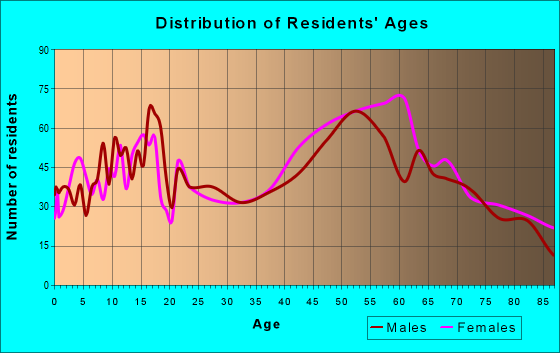
Males: 3,703
(46.3%)
Females: 4,289
(53.7%)
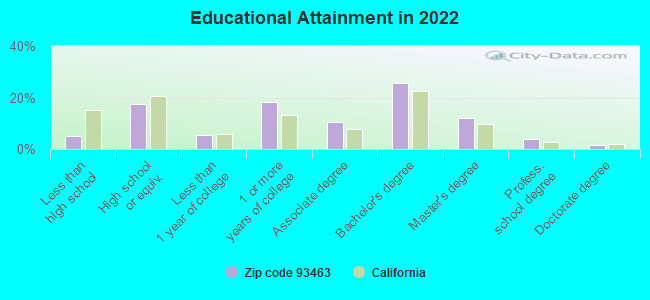
For population 25 years and over in 93463:
High school or higher: 94.6%
Bachelor's degree or higher: 43.2%
Graduate or professional degree: 17.7%
Unemployed: 4.7%
Mean travel time to work (commute): 30.5 minutes
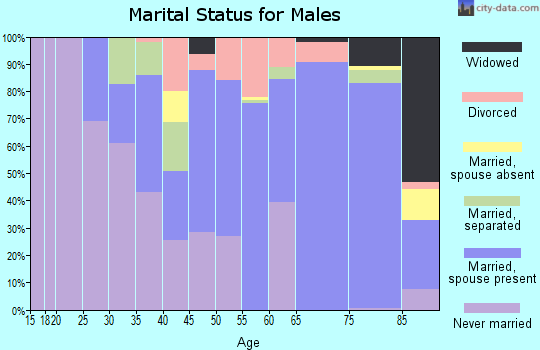
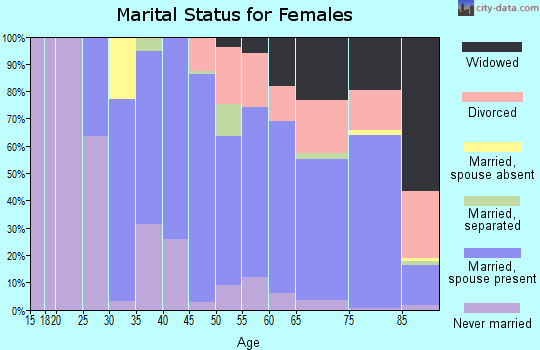
For population 15 years and over in 93463:
Never married: 25.3%
Now married: 52.5%
Separated: 0.8%
Widowed: 6.4%
Divorced: 15.0%
Zip code 93463 compared to state average:
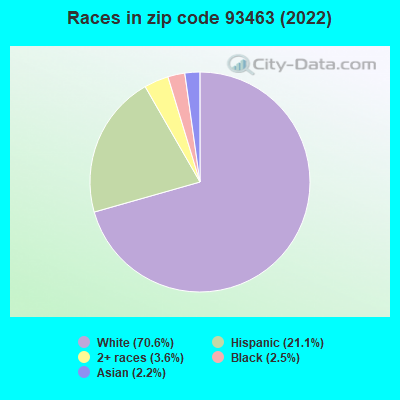
Black race population percentage below state average.
Hispanic race population percentage below state average.
Median age significantly above state average.
Foreign-born population percentage below state average.
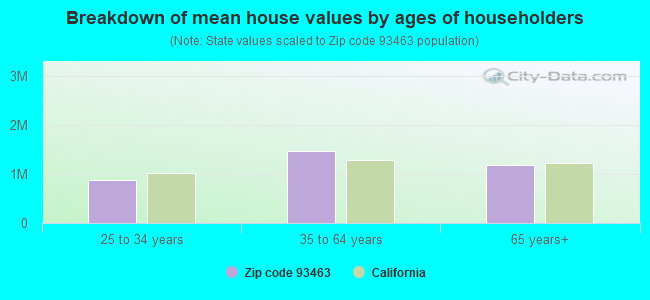
Estimated median house/condo value in 2022: $1,063,154
93463:
$1,063,154
California:
$715,900
According to our research of California and other state lists, there were 6 registered sex offenders living in 93463 zip code as of April 26, 2024. The ratio of all residents to sex offenders in zip code 93463 is 1,336 to 1. The ratio of registered sex offenders to all residents in this zip code is lower than the state average.
Median resident age:
This zip code:
54.5 years
California median age:
37.9 years
Average household size:
This zip code:
2.3 people
California:
2.8 people
Averages for the 2020 tax year for zip code 93463, filed in 2021:
Average Adjusted Gross Income (AGI) in 2020: $115,522 (Individual Income Tax Returns)
Here:
$115,522
State:
$95,910
Salary/wage: $78,353 (reported on 71.0% of returns)
Here:
$78,353
State:
$77,331
(% of AGI for various income ranges: 1357.8% for AGIs below $25k, 3948.3% for AGIs $25k-50k, 6947.6% for AGIs $50k-75k, 10406.7% for AGIs $75k-100k, 19240.0% for AGIs $100k-200k, 87507.3% for AGIs over 200k)
Taxable interest for individuals: $3,297 (reported on 47.4% of returns)
This zip code:
$3,297
California:
$2,294
(% of AGI for various income ranges: 43.2% for AGIs below $25k, 77.2% for AGIs $25k-50k, 94.1% for AGIs $50k-75k, 197.3% for AGIs $75k-100k, 390.0% for AGIs $100k-200k, 3384.5% for AGIs over 200k)
Ordinary dividends: $12,515 (reported on 35.0% of returns)
Here:
$12,515
State:
$10,949
(% of AGI for various income ranges: 121.2% for AGIs below $25k, 209.3% for AGIs $25k-50k, 381.0% for AGIs $50k-75k, 640.0% for AGIs $75k-100k, 1266.0% for AGIs $100k-200k, 8602.7% for AGIs over 200k)
Net capital gain/loss in AGI: +$40,475 (reported on 32.9% of returns)
Here:
+$40,475
State:
+$49,306
(% of AGI for various income ranges: 40.8% for AGIs below $25k, 85.2% for AGIs $25k-50k, 235.2% for AGIs $50k-75k, 428.0% for AGIs $75k-100k, 1720.3% for AGIs $100k-200k, 40292.7% for AGIs over 200k)
Profit/loss from business: +$32,815 (reported on 20.2% of returns)
Here:
+$32,815
State:
+$15,671
(% of AGI for various income ranges: 225.6% for AGIs below $25k, 386.5% for AGIs $25k-50k, 484.8% for AGIs $50k-75k, 882.7% for AGIs $75k-100k, 2198.0% for AGIs $100k-200k, 12150.9% for AGIs over 200k)
Taxable individual retirement arrangement distribution: $31,044 (reported on 14.2% of returns)
93463:
$31,044
California:
$23,505
(% of AGI for various income ranges: 75.6% for AGIs below $25k, 163.5% for AGIs $25k-50k, 454.1% for AGIs $50k-75k, 962.0% for AGIs $75k-100k, 2077.0% for AGIs $100k-200k, 6320.9% for AGIs over 200k)
Self-employed (Keogh) retirement plans: $30,938 (reported on 2.1% of returns)
93463:
$30,938
California:
$30,163
(% of AGI for various income ranges: 146.3% for AGIs $100k-200k, 1850.9% for AGIs over 200k)
Total itemized deductions: $41,018 (reported on 25.6% of returns)
Here:
$41,018
State:
$39,517
(% of AGI for various income ranges: 407.6% for AGIs below $25k, 595.0% for AGIs $25k-50k, 1220.3% for AGIs $50k-75k, 1952.7% for AGIs $75k-100k, 3989.0% for AGIs $100k-200k, 15816.4% for AGIs over 200k)
Charity contributions: $8,802 (reported on 21.5% of returns)
Here:
$8,802
State:
$12,598
(% of AGI for various income ranges: 11.8% for AGIs below $25k, 32.6% for AGIs $25k-50k, 84.5% for AGIs $50k-75k, 146.7% for AGIs $75k-100k, 548.0% for AGIs $100k-200k, 4534.5% for AGIs over 200k)
Taxes paid: $8,671 (reported on 25.6% of returns)
93463:
$8,671
State:
$8,807
(% of AGI for various income ranges: 63.6% for AGIs below $25k, 78.9% for AGIs $25k-50k, 257.2% for AGIs $50k-75k, 501.3% for AGIs $75k-100k, 975.3% for AGIs $100k-200k, 3162.7% for AGIs over 200k)
Earned income credit: $1,559 (reported on 7.0% of returns)
Here:
$1,559
State:
$2,074
(% of AGI for various income ranges: 50.0% for AGIs below $25k, 37.2% for AGIs $25k-50k)
Percentage of individuals using paid preparers for their 2020 taxes: 93.0%
Here:
93%
State:
92%
(% for various income ranges: 91.6% for AGIs below $25k, 90.8% for AGIs $25k-50k, 92.3% for AGIs $50k-75k, 94.1% for AGIs $75k-100k, 94.9% for AGIs $100k-200k, 96.1% for AGIs over 200k)
Averages for the 2012 tax year for zip code 93463, filed in 2013:
Average Adjusted Gross Income (AGI) in 2012: $93,600 (Individual Income Tax Returns)
Here:
$93,600
State:
$72,726
Salary/wage: $61,105 (reported on 71.0% of returns)
Here:
$61,105
State:
$59,079
(% of AGI for various income ranges: 66.7% for AGIs below $25k, 66.0% for AGIs $25k-50k, 58.8% for AGIs $50k-75k, 52.9% for AGIs $75k-100k, 56.9% for AGIs $100k-200k, 31.7% for AGIs over 200k)
Taxable interest for individuals: $3,215 (reported on 47.9% of returns)
This zip code:
$3,215
California:
$2,146
(% of AGI for various income ranges: 3.9% for AGIs below $25k, 1.4% for AGIs $25k-50k, 1.6% for AGIs $50k-75k, 1.3% for AGIs $75k-100k, 1.6% for AGIs $100k-200k, 1.6% for AGIs over 200k)
Ordinary dividends: $12,538 (reported on 34.0% of returns)
Here:
$12,538
State:
$9,308
(% of AGI for various income ranges: 4.5% for AGIs below $25k, 3.7% for AGIs $25k-50k, 3.5% for AGIs $50k-75k, 3.3% for AGIs $75k-100k, 4.2% for AGIs $100k-200k, 5.4% for AGIs over 200k)
Net capital gain/loss in AGI: +$30,672 (reported on 31.1% of returns)
Here:
+$30,672
State:
+$30,460
(% of AGI for various income ranges: 1.1% for AGIs $25k-50k, 1.9% for AGIs $50k-75k, 1.7% for AGIs $75k-100k, 2.8% for AGIs $100k-200k, 20.1% for AGIs over 200k)
Profit/loss from business: +$23,906 (reported on 21.0% of returns)
Here:
+$23,906
State:
+$17,064
(% of AGI for various income ranges: 13.2% for AGIs below $25k, 7.2% for AGIs $25k-50k, 5.1% for AGIs $50k-75k, 6.7% for AGIs $75k-100k, 4.9% for AGIs $100k-200k, 4.4% for AGIs over 200k)
Taxable individual retirement arrangement distribution: $24,248 (reported on 17.2% of returns)
93463:
$24,248
California:
$19,557
(% of AGI for various income ranges: 5.6% for AGIs below $25k, 4.3% for AGIs $25k-50k, 4.4% for AGIs $50k-75k, 6.4% for AGIs $75k-100k, 6.7% for AGIs $100k-200k, 2.7% for AGIs over 200k)
Self-employment retirement plans: $19,380 (reported on 1.5% of returns)
93463:
$19,380
California:
$24,530
Total itemized deductions: $41,657 (26% of AGI, reported on 48.5% of returns)
Here:
$41,657
State:
$34,004
Here:
26.4% of AGI
State:
22.7% of AGI
(% of AGI for various income ranges: 26.0% for AGIs below $25k, 18.8% for AGIs $25k-50k, 19.2% for AGIs $50k-75k, 22.9% for AGIs $75k-100k, 22.8% for AGIs $100k-200k, 21.2% for AGIs over 200k)
Charity contributions: $4,417 (reported on 42.0% of returns)
Here:
$4,417
State:
$4,659
(% of AGI for various income ranges: 1.3% for AGIs below $25k, 1.2% for AGIs $25k-50k, 1.6% for AGIs $50k-75k, 2.3% for AGIs $75k-100k, 2.3% for AGIs $100k-200k, 2.0% for AGIs over 200k)
Taxes paid: $14,790 (reported on 48.2% of returns)
93463:
$14,790
State:
$14,448
(% of AGI for various income ranges: 4.5% for AGIs below $25k, 3.7% for AGIs $25k-50k, 4.6% for AGIs $50k-75k, 6.4% for AGIs $75k-100k, 8.1% for AGIs $100k-200k, 9.1% for AGIs over 200k)
Earned income credit: $2,084 (reported on 9.2% of returns)
Here:
$2,084
State:
$2,286
(% of AGI for various income ranges: 3.7% for AGIs below $25k, 0.8% for AGIs $25k-50k)
Percentage of individuals using paid preparers for their 2012 taxes: 63.3%
Here:
63%
State:
64%
(% for various income ranges: 54.3% for AGIs below $25k, 61.5% for AGIs $25k-50k, 63.6% for AGIs $50k-75k, 64.7% for AGIs $75k-100k, 69.5% for AGIs $100k-200k, 83.9% for AGIs over 200k)
Averages for the 2004 tax year for zip code 93463, filed in 2005:
Average Adjusted Gross Income (AGI) in 2004: $74,571 (Individual Income Tax Returns)
Here:
$74,571
State:
$58,600
Salary/wage: $54,961 (reported on 68.1% of returns)
Here:
$54,961
State:
$49,455
(% of AGI for various income ranges: 57.0% for AGIs $10k-25k, 65.3% for AGIs $25k-50k, 60.3% for AGIs $50k-75k, 58.8% for AGIs $75k-100k, 42.0% for AGIs over 100k)
Taxable interest for individuals: $3,541 (reported on 64.3% of returns)
This zip code:
$3,541
California:
$2,365
(% of AGI for various income ranges: 7.3% for AGIs $10k-25k, 3.6% for AGIs $25k-50k, 3.7% for AGIs $50k-75k, 3.5% for AGIs $75k-100k, 2.2% for AGIs over 100k)
Taxable dividends: $6,453 (reported on 42.5% of returns)
Here:
$6,453
State:
$4,746
(% of AGI for various income ranges: 6.1% for AGIs $10k-25k, 3.8% for AGIs $25k-50k, 3.1% for AGIs $50k-75k, 4.3% for AGIs $75k-100k, 3.1% for AGIs over 100k)
Net capital gain/loss: +$28,752 (reported on 38.2% of returns)
Here:
+$28,752
State:
+$23,418
(% of AGI for various income ranges: -1.7% for AGIs $10k-25k, 1.7% for AGIs $25k-50k, 2.6% for AGIs $50k-75k, 3.0% for AGIs $75k-100k, 21.2% for AGIs over 100k)
Profit/loss from business: +$21,245 (reported on 22.7% of returns)
Here:
+$21,245
State:
+$16,826
(% of AGI for various income ranges: 10.9% for AGIs $10k-25k, 6.9% for AGIs $25k-50k, 6.5% for AGIs $50k-75k, 8.8% for AGIs $75k-100k, 5.3% for AGIs over 100k)
IRA payment deduction: $3,800 (reported on 4.7% of returns)
93463:
$3,800
California:
$3,192
(% of AGI for various income ranges: 0.6% for AGIs $10k-25k, 0.4% for AGIs $25k-50k, 0.3% for AGIs $50k-75k, 0.3% for AGIs $75k-100k, 0.2% for AGIs over 100k)
Self-employed pension: $15,409 (reported on 2.9% of returns)
Here:
$15,409
California:
$17,688
Total itemized deductions: $32,959 (27% of AGI, reported on 52.0% of returns)
Here:
$32,959
State:
$28,113
Here:
26.7% of AGI
State:
25.3% of AGI
(% of AGI for various income ranges: 30.1% for AGIs $10k-25k, 21.1% for AGIs $25k-50k, 24.3% for AGIs $50k-75k, 28.0% for AGIs $75k-100k, 20.3% for AGIs over 100k)
Charity contributions deductions: $4,343 (3% of AGI, reported on 48.6% of returns)
Here:
$4,343
State:
$3,923
Here:
3.4% of AGI
State:
3.3% of AGI
(% of AGI for various income ranges: 3.1% for AGIs $10k-25k, 2.2% for AGIs $25k-50k, 2.8% for AGIs $50k-75k, 3.2% for AGIs $75k-100k, 2.7% for AGIs over 100k)
Total tax: $12,888 (reported on 80.2% of returns)
93463:
$12,888
State:
$10,761
(% of AGI for various income ranges: 5.2% for AGIs $10k-25k, 7.1% for AGIs $25k-50k, 9.0% for AGIs $50k-75k, 9.9% for AGIs $75k-100k, 16.4% for AGIs over 100k)
Earned income credit: $1,511 (reported on 5.9% of returns)
Here:
$1,511
State:
$1,763
Percentage of individuals using paid preparers for their 2004 taxes: 68.7%
Here:
69%
State:
66%
(% for various income ranges: 58.8% for AGIs below $10k, 64.9% for AGIs $10k-25k, 66.7% for AGIs $25k-50k, 72.8% for AGIs $50k-75k, 75.7% for AGIs $75k-100k, 76.8% for AGIs over 100k)
Household received Food Stamps/SNAP in the past 12 months: 99 Household did not receive Food Stamps/SNAP in the past 12 months: 3,209
Women who had a birth in the past 12 months: 69 (32 now married, 37 unmarried) Women who did not have a birth in the past 12 months: 1,247 (436 now married, 814 unmarried)
Housing units in zip code 93463 with a mortgage: 1,244 (163 second mortgage, 140 both second mortgage and home equity loan) Houses without a mortgage: 45
Median monthly owner costs for units with a mortgage: $3,876 Median monthly owner costs for units without a mortgage: $1,059
Residents with income below the poverty level in 2022:
This zip code:
6.6%
Whole state:
12.2%
Residents with income below 50% of the poverty level in 2022:
This zip code:
5.0%
Whole state:
6.2%
Median number of rooms in houses and condos:
Here:
6.5
State:
6.0
Median number of rooms in apartments:
Here:
4.4
State:
3.9
Notable locations in this zip code not listed on our city pages
Notable locations in zip code 93463: Rancho Los Olivos (A), J Carey Cellars (B), Copenhagen Cellars (C), Alisal Golf Course (D), Rancho San Carlos de Jonata (E), Rancho Santa Ynez (F), Windhorse Farm (G), Pollyrich Farms (H), Apple Lane Farm (I), Ballard Apple Farm (J), Hallauer Ranch (K), Double A J Ranch (L), Blackjack Ranch (M), Alisal Ranch (N), Veterans Memorial Building (O), Solvang Visitors Center (P), Solvang Chamber of Commerce (Q), Solvang Branch Santa Barbara Public Library (R), Hans Christian Anderson Museum (S), Ballard Canyon Winery (T). Display/hide their locations on the map
713 married couples with children.
482 single-parent households (214 men, 268 women).
79.1% of residents of 93463 zip code speak English at home.
15.2% of residents speak Spanish at home (57% very well, 20% well, 11% not well, 11% not at all).
2.7% of residents speak other Indo-European language at home (68% very well, 32% well).
2.2% of residents speak Asian or Pacific Island language at home (66% very well, 34% well).
1.6% of residents speak other language at home (95% very well, 5% well).
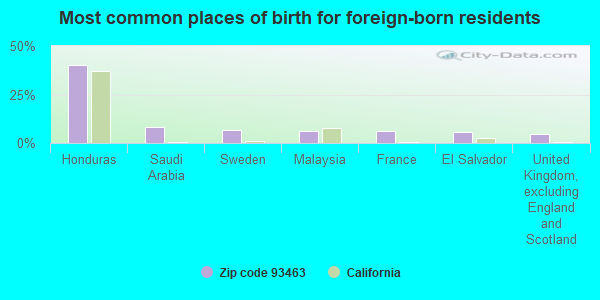
Foreign born population: 1,215 (15.2%) (61.0% of them are naturalized citizens)
This zip code:
15.2%
Whole state:
26.7%
40%Honduras
8%Saudi Arabia
7%Sweden
6%Malaysia
6%France
6%El Salvador
5%United Kingdom, excluding England and Scotland
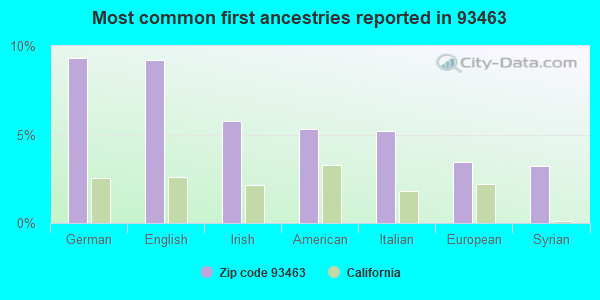
9%German
9%English
6%Irish
5%American
5%Italian
3%European
3%Syrian
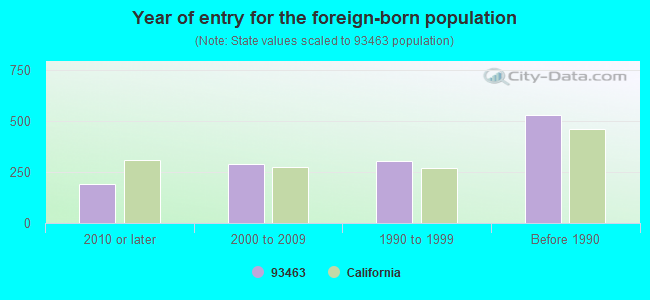
Year of entry for the foreign-born population
1912010 or later
2882000 to 2009
3041990 to 1999
531Before 1990
Facilities with environmental interests located in this zip code:
BALLARD ELEMENTARY (2425 SCHOOL ST. in SOLVANG, CA)
(National Center for Education Statistics) - STATE ID-6045256
GTC TANK SITE (1908 W PINE STREET in SOLVANG, CA)
Small Quantity Generators, between 100 kg and 1000 kg of hazardous waste/month (Resource Conservation and Recovery Act (tracking hazardous waste))
LYNCH READY MIX CONCRETE COMPANY (1230 MISSION DRIVE in SOLVANG, CA)
CRITERIA AND HAZARDOUS AIR POLLUTANT INVENTORY (Inventory of air pollution sources) Business SIC classification: READY-MIXED CONCRETE
Housing units lacking complete plumbing facilities: 0.1% Housing units lacking complete kitchen facilities: 0.5%
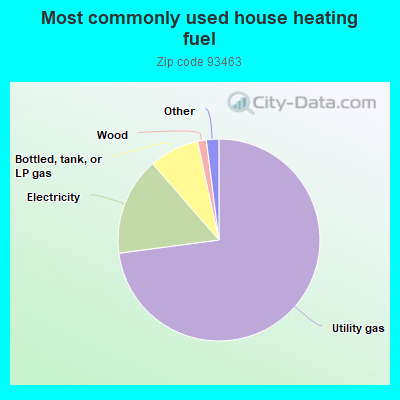
73.0%Utility gas
15.7%Electricity
8.0%Bottled, tank, or LP gas
1.4%Wood
1.0%No fuel used
0.9%Solar energy
Population in 1990: 8,327.
Place of birth for U.S.-born residents:
This state: 4,291
Northeast: 523
Midwest: 816
South: 412
West: 555
51% of the 93463 zip code residents lived in the same house 5 years ago. Out of people who lived in different houses, 64% lived in this county. Out of people who lived in different counties, 50% lived in California.
83% of the 93463 zip code residents lived in the same house 1 year ago. Out of people who lived in different houses, 71% moved from this county. Out of people who lived in different houses, 17% moved from different county within same state. Out of people who lived in different houses, 4% moved from different state. Out of people who lived in different houses, 3% moved from abroad.
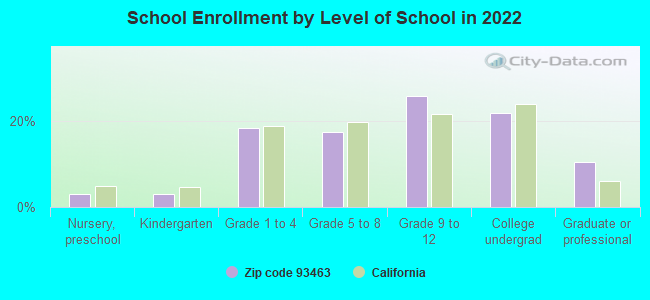
Private vs. public school enrollment:
Students in private schools in grades 1 to 8 (elementary and middle school): 16
Here:
3.2%
California:
10.5%
Students in private schools in grades 9 to 12 (high school): 83
Here:
22.1%
California:
8.5%
Students in private undergraduate colleges: 3
Here:
1.2%
California:
15.9%
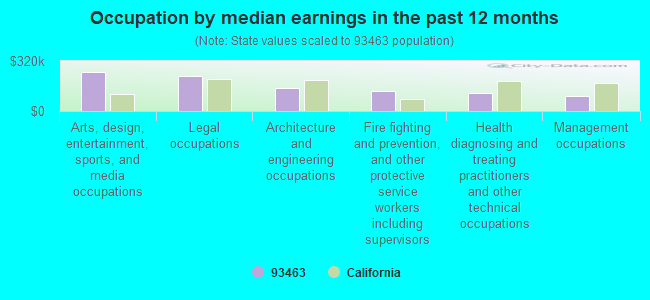
Occupation by median earnings in the past 12 months ($)
249,479Arts, design, entertainment, sports, and media occupations
223,958Legal occupations
146,444Architecture and engineering occupations
127,747Fire fighting and prevention, and other protective service workers including supervisors
113,273Health diagnosing and treating practitioners and other technical occupations
98,799Management occupations
Companies with federal contracts located in this zip code:
TOM GREENE (1518 CRONBERG DR in SOLVANG, CA; small business)
$95,000 with National Oceanic and Atmospheric Administration/Under Secretary for Oceans and Atmosphere for Aerial Photographic Services. Signed on 2003-08-15. Completion date: 2004-06-15.
BREEN AUTOMATION SYSTEMS INC (339 ALISAL RD STE A in SOLVANG, CA; small business) : $16,956 in 2 contractsfrom 2003 to 2006
$10,000 with Air Force for Technical Representation Services -- Plumbing, Heating, and Waste Disposal Equipment. Signed on 2006-06-01. Completion date: 2006-07-02.
$6,956 with Air Force for Maintenance, Repair or Alteration of Real Property -- Other Administrative Facilities and Service Buildings. Signed on 2003-09-26. Completion date: 2003-11-25.
Top industries in this zip code by the number of employees in 2005:
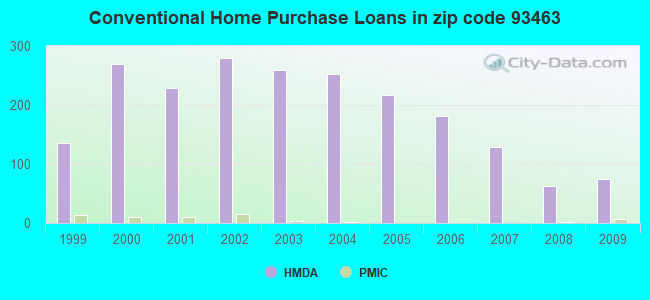
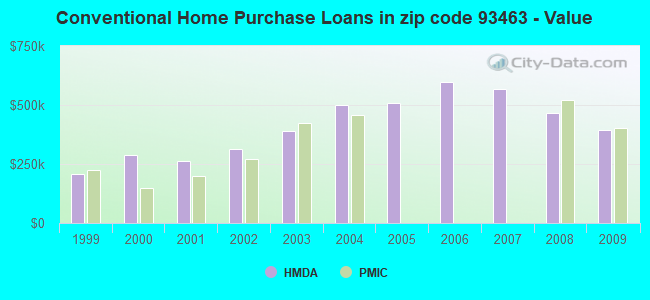
Detailed PMIC statistics for the following Tracts:0019.03
2005 - 2018 National Fire Incident Reporting System (NFIRS) incidents
Based on the data from the years 2005 - 2018 the average number of fire incidents per year is 10. The highest number of reported fires - 17 took place in 2005, and the least - 0 in 2006. The data has a decreasing trend.
When looking into fire subcategories, the most incidents belonged to: Outside Fires (46.4%), and Structure Fires (42.9%).
Fire incident types reported to NFIRS in Zip Code 93463
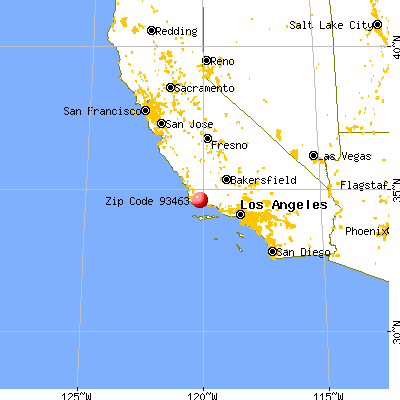


 Nearest zip codes: 93427, 93440, 93460, 93117, 93441, 93436.


 Based on the data from the years 2005 - 2018 the average number of fire incidents per year is 10. The highest number of reported fires - 17 took place in 2005, and the least - 0 in 2006. The data has a decreasing trend.
 When looking into fire subcategories, the most incidents belonged to: Outside Fires (46.4%), and Structure Fires (42.9%).