Averages for the 2020 tax year for zip code 95231, filed in 2021:
Average Adjusted Gross Income (AGI) in 2020: $50,682 (Individual Income Tax Returns)
Here:
$50,682
State:
$95,910
Salary/wage: $43,485 (reported on 83.8% of returns)
Here:
$43,485
State:
$77,331
(% of AGI for various income ranges: 1366.2% for AGIs below $25k, 4184.2% for AGIs $25k-50k, 7315.3% for AGIs $50k-75k, 11521.2% for AGIs $75k-100k, 18553.3% for AGIs $100k-200k)
Taxable interest for individuals: $391 (reported on 24.6% of returns)
This zip code:
$391
California:
$2,294
(% of AGI for various income ranges: 6.4% for AGIs below $25k, 5.8% for AGIs $25k-50k, 13.2% for AGIs $50k-75k, 11.2% for AGIs $75k-100k, 48.9% for AGIs $100k-200k)
Ordinary dividends: $2,008 (reported on 6.3% of returns)
Here:
$2,008
State:
$10,949
(% of AGI for various income ranges: 5.6% for AGIs below $25k, 8.6% for AGIs $25k-50k, 17.4% for AGIs $50k-75k, 165.6% for AGIs $100k-200k)
Net capital gain/loss in AGI: +$9,264 (reported on 7.3% of returns)
Here:
+$9,264
State:
+$49,306
(% of AGI for various income ranges: 2.8% for AGIs below $25k, 27.7% for AGIs $25k-50k, 22.1% for AGIs $50k-75k, 1250.0% for AGIs $100k-200k)
Profit/loss from business: +$17,017 (reported on 12.0% of returns)
Here:
+$17,017
State:
+$15,671
(% of AGI for various income ranges: 123.6% for AGIs below $25k, 181.2% for AGIs $25k-50k, 274.7% for AGIs $50k-75k, 2367.8% for AGIs $100k-200k)
Taxable individual retirement arrangement distribution: $7,583 (reported on 3.1% of returns)
95231:
$7,583
California:
$23,505
(% of AGI for various income ranges: 58.7% for AGIs below $25k, 282.5% for AGIs $75k-100k)
Total itemized deductions: $27,300 (reported on 6.8% of returns)
Here:
$27,300
State:
$39,517
(% of AGI for various income ranges: 184.2% for AGIs $25k-50k, 546.3% for AGIs $50k-75k, 1910.0% for AGIs $100k-200k)
Charity contributions: $3,856 (reported on 4.7% of returns)
Here:
$3,856
State:
$12,598
(% of AGI for various income ranges: 5.9% for AGIs below $25k, 48.9% for AGIs $50k-75k, 256.7% for AGIs $100k-200k)
Taxes paid: $7,300 (reported on 6.8% of returns)
95231:
$7,300
State:
$8,807
(% of AGI for various income ranges: 38.4% for AGIs $25k-50k, 157.9% for AGIs $50k-75k, 537.8% for AGIs $100k-200k)
Earned income credit: $2,246 (reported on 21.5% of returns)
Here:
$2,246
State:
$2,074
(% of AGI for various income ranges: 118.7% for AGIs below $25k, 106.5% for AGIs $25k-50k)
Percentage of individuals using paid preparers for their 2020 taxes: 92.1%
Here:
92%
State:
92%
(% for various income ranges: 90.5% for AGIs below $25k, 92.2% for AGIs $25k-50k, 93.3% for AGIs $50k-75k, 92.3% for AGIs $75k-100k, 94.1% for AGIs $100k-200k, 100.0% for AGIs over 200k)
Averages for the 2012 tax year for zip code 95231, filed in 2013:
Average Adjusted Gross Income (AGI) in 2012: $38,281 (Individual Income Tax Returns)
Here:
$38,281
State:
$72,726
Salary/wage: $33,015 (reported on 86.2% of returns)
Here:
$33,015
State:
$59,079
(% of AGI for various income ranges: 71.3% for AGIs below $25k, 78.2% for AGIs $25k-50k, 81.8% for AGIs $50k-75k, 72.4% for AGIs $75k-100k, 66.8% for AGIs $100k-200k)
Taxable interest for individuals: $267 (reported on 24.5% of returns)
This zip code:
$267
California:
$2,146
(% of AGI for various income ranges: 0.3% for AGIs below $25k, 0.1% for AGIs $25k-50k, 0.2% for AGIs $50k-75k, 0.2% for AGIs $75k-100k, 0.1% for AGIs $100k-200k)
Ordinary dividends: $1,225 (reported on 5.0% of returns)
Here:
$1,225
State:
$9,308
Net capital gain/loss in AGI: +$1,083 (reported on 3.8% of returns)
Here:
+$1,083
State:
+$30,460
Profit/loss from business: +$12,541 (reported on 10.7% of returns)
Here:
+$12,541
State:
+$17,064
(% of AGI for various income ranges: 8.3% for AGIs below $25k, 2.2% for AGIs $25k-50k, 2.5% for AGIs $50k-75k, 8.6% for AGIs $75k-100k)
Taxable individual retirement arrangement distribution: $12,625 (reported on 5.0% of returns)
95231:
$12,625
California:
$19,557
(% of AGI for various income ranges: 1.0% for AGIs below $25k, 2.2% for AGIs $25k-50k, 6.6% for AGIs $75k-100k)
Total itemized deductions: $21,752 (27% of AGI, reported on 19.5% of returns)
Here:
$21,752
State:
$34,004
Here:
26.6% of AGI
State:
22.7% of AGI
(% of AGI for various income ranges: 6.0% for AGIs below $25k, 7.1% for AGIs $25k-50k, 13.2% for AGIs $50k-75k, 16.6% for AGIs $75k-100k, 15.2% for AGIs $100k-200k)
Charity contributions: $2,158 (reported on 16.4% of returns)
Here:
$2,158
State:
$4,659
(% of AGI for various income ranges: 0.4% for AGIs below $25k, 0.4% for AGIs $25k-50k, 0.9% for AGIs $50k-75k, 1.8% for AGIs $75k-100k, 1.5% for AGIs $100k-200k)
Taxes paid: $6,739 (reported on 19.5% of returns)
95231:
$6,739
State:
$14,448
(% of AGI for various income ranges: 1.1% for AGIs below $25k, 1.7% for AGIs $25k-50k, 3.5% for AGIs $50k-75k, 4.7% for AGIs $75k-100k, 6.6% for AGIs $100k-200k)
Earned income credit: $2,588 (reported on 30.2% of returns)
Here:
$2,588
State:
$2,286
(% of AGI for various income ranges: 8.1% for AGIs below $25k, 2.4% for AGIs $25k-50k)
Percentage of individuals using paid preparers for their 2012 taxes: 69.2%
Here:
69%
State:
64%
(% for various income ranges: 66.2% for AGIs below $25k, 73.1% for AGIs $25k-50k, 66.7% for AGIs $50k-75k, 66.7% for AGIs $75k-100k, 77.8% for AGIs $100k-200k)
Averages for the 2004 tax year for zip code 95231, filed in 2005:
Average Adjusted Gross Income (AGI) in 2004: $38,923 (Individual Income Tax Returns)
Here:
$38,923
State:
$58,600
Salary/wage: $31,348 (reported on 88.3% of returns)
Here:
$31,348
State:
$49,455
(% of AGI for various income ranges: 97.0% for AGIs below $10k, 74.3% for AGIs $10k-25k, 84.6% for AGIs $25k-50k, 87.3% for AGIs $50k-75k, 87.9% for AGIs $75k-100k, 39.4% for AGIs over 100k)
Taxable interest for individuals: $766 (reported on 33.4% of returns)
This zip code:
$766
California:
$2,365
(% of AGI for various income ranges: 4.2% for AGIs below $10k, 1.0% for AGIs $10k-25k, 0.4% for AGIs $25k-50k, 0.5% for AGIs $50k-75k, 0.3% for AGIs $75k-100k, 0.7% for AGIs over 100k)
Taxable dividends: $1,536 (reported on 7.4% of returns)
Here:
$1,536
State:
$4,746
(% of AGI for various income ranges: 1.9% for AGIs below $10k, 0.3% for AGIs $10k-25k, 0.2% for AGIs $25k-50k, 0.2% for AGIs $50k-75k, 0.4% for AGIs over 100k)
Net capital gain/loss: +$2,319 (reported on 6.0% of returns)
Here:
+$2,319
State:
+$23,418
(% of AGI for various income ranges: -1.7% for AGIs below $10k, -0.1% for AGIs $10k-25k, 0.0% for AGIs $25k-50k, -0.1% for AGIs $50k-75k, 1.4% for AGIs over 100k)
Profit/loss from business: +$10,732 (reported on 9.8% of returns)
Here:
+$10,732
State:
+$16,826
(% of AGI for various income ranges: 7.2% for AGIs below $10k, 5.2% for AGIs $10k-25k, 2.3% for AGIs $25k-50k, 1.3% for AGIs $50k-75k, 10.1% for AGIs $75k-100k)
IRA payment deduction: $2,562 (reported on 1.1% of returns)
95231:
$2,562
California:
$3,192
Total itemized deductions: $22,066 (26% of AGI, reported on 25.2% of returns)
Here:
$22,066
State:
$28,113
Here:
26.0% of AGI
State:
25.3% of AGI
(% of AGI for various income ranges: 15.9% for AGIs below $10k, 8.0% for AGIs $10k-25k, 11.1% for AGIs $25k-50k, 18.1% for AGIs $50k-75k, 21.3% for AGIs $75k-100k, 15.4% for AGIs over 100k)
Charity contributions deductions: $2,443 (3% of AGI, reported on 21.0% of returns)
Here:
$2,443
State:
$3,923
Here:
2.7% of AGI
State:
3.3% of AGI
(% of AGI for various income ranges: 0.4% for AGIs $10k-25k, 0.9% for AGIs $25k-50k, 1.9% for AGIs $50k-75k, 3.0% for AGIs $75k-100k, 1.4% for AGIs over 100k)
Total tax: $5,197 (reported on 60.1% of returns)
95231:
$5,197
State:
$10,761
(% of AGI for various income ranges: 2.1% for AGIs below $10k, 2.9% for AGIs $10k-25k, 4.6% for AGIs $25k-50k, 7.8% for AGIs $50k-75k, 9.4% for AGIs $75k-100k, 13.8% for AGIs over 100k)
Earned income credit: $1,825 (reported on 28.0% of returns)
Here:
$1,825
State:
$1,763
Percentage of individuals using paid preparers for their 2004 taxes: 70.1%
Here:
70%
State:
66%
(% for various income ranges: 67.6% for AGIs below $10k, 72.6% for AGIs $10k-25k, 70.1% for AGIs $25k-50k, 64.2% for AGIs $50k-75k, 68.2% for AGIs $75k-100k, 77.5% for AGIs over 100k)
Household received Food Stamps/SNAP in the past 12 months: 223 Household did not receive Food Stamps/SNAP in the past 12 months: 491
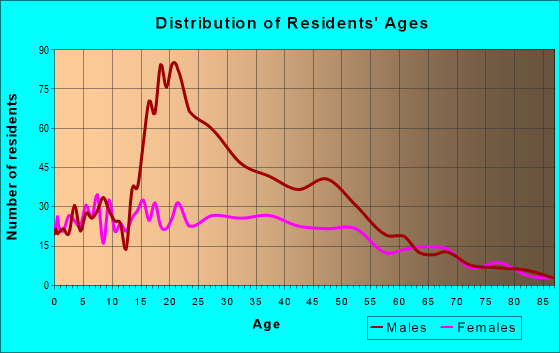
Women who had a birth in the past 12 months: 30 (23 now married, 7 unmarried) Women who did not have a birth in the past 12 months: 863 (514 now married, 341 unmarried)
Housing units in zip code 95231 with a mortgage: 225 (8 second mortgage) Median monthly owner costs for units with a mortgage: $1,944 Median monthly owner costs for units without a mortgage: $497
Residents with income below the poverty level in 2022:
This zip code:
20.1%
Whole state:
12.2%
Residents with income below 50% of the poverty level in 2022:
This zip code:
10.6%
Whole state:
6.2%
Median number of rooms in houses and condos:
Here:
5.8
State:
6.0
Median number of rooms in apartments:
Here:
5.2
State:
3.9
Notable locations in this zip code not listed on our city pages
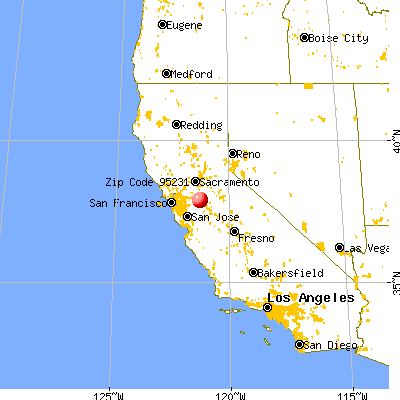
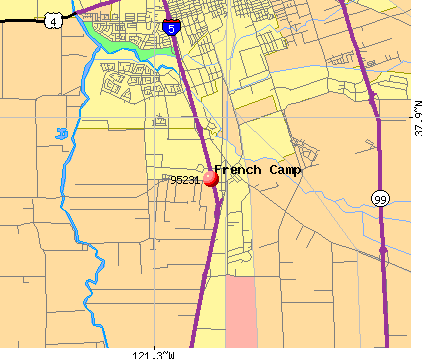
Notable locations in zip code 95231: San Joaquin County Sherrifs Facility (A), Defense Logistics Agency Sharp (B), French Camp McKinley Rural Fire Protection District (C). Display/hide their locations on the map
In group quarters: 2,551 (-1 institutionalized population)
Size of family households: 195 2-persons, 55 3-persons, 85 4-persons, 72 5-persons, 84 6-persons, 44 7-or-more-persons
Size of nonfamily households: 88 1-person, 57 2-persons
499 married couples with children.
42 single-parent households (28 men, 14 women).
48.2% of residents of 95231 zip code speak English at home.
48.2% of residents speak Spanish at home (38% very well, 21% well, 24% not well, 17% not at all).
0.6% of residents speak other Indo-European language at home (82% very well, 18% well).
1.9% of residents speak Asian or Pacific Island language at home (67% very well, 33% well).
0.8% of residents speak other language at home (100% very well).
Foreign born population: 1,651 (34.2%) (9.6% of them are naturalized citizens)
Facilities with environmental interests located in this zip code:
MONIER ROOF TILE (9508 HARLIN ROAD in FRENCH CAMP, CA)
STATE MASTER (California - Hazardous Waste Tracking) - HAZARDOU WASTE PROGRAM CRITERIA AND HAZARDOUS AIR POLLUTANT INVENTORY (Inventory of air pollution sources) Small Quantity Generators, between 100 kg and 1000 kg of hazardous waste/month (Resource Conservation and Recovery Act (tracking hazardous waste)) TRI REPORTER (Tracking of toxic chemicals releasing facilities) Business SIC classification: CONCRETE PRODUCTS, EXCEPT BLOCK AND BRICK; GASOLINE SERVICE STATIONS Alternative names: MONIER INC., MONIERLIFETILE L.L.C., MONIERLIFETILE L.L.C., MONIERLIFETILE LLC
FRENCH CAMP ELEMENTARY (4TH & ELM in FRENCH CAMP, CA)
(National Center for Education Statistics) - STATE ID-6042311 Organizations: MANTECA UNIFIED (SCHOOL DISTRICT)
LATHROP INTERMODAL FACILITY (1000 E ROTH RD in FRENCH CAMP, CA)
Small Quantity Generators, between 100 kg and 1000 kg of hazardous waste/month (Resource Conservation and Recovery Act (tracking hazardous waste)) - notification TRANSPORTER (Resource Conservation and Recovery Act (tracking hazardous waste)) - notification (Resource Conservation and Recovery Act (tracking hazardous waste)) Organizations: UNION PACIFIC RAILROAD (CONTACT/OWNER)
, UNION PACIFIC MOTOR (CONTACT/OWNER)
FRENCH CAMP GRAIN ELEVATORS LLC (9504 SOUTH HARLAN ROAD in FRENCH CAMP, CA)
AIR SYNTHETIC MINOR (AIRS/AFS) CRITERIA AND HAZARDOUS AIR POLLUTANT INVENTORY (Inventory of air pollution sources) Business SIC classification: GRAIN AND FIELD BEANS Alternative names: CONTINENTAL GRAIN COMPANY
AMERICAN HONDA MTR CO. INC. PC (123 VAL DERVIN PARKWAY in FRENCH CAMP, CA)
Small Quantity Generators, between 100 kg and 1000 kg of hazardous waste/month (Resource Conservation and Recovery Act (tracking hazardous waste))
GRANITE CONSTRUCTION (10500 HARLAN RD in FRENCH CAMP, CA)
AIR SYNTHETIC MINOR (AIRS/AFS) CRITERIA AND HAZARDOUS AIR POLLUTANT INVENTORY (Inventory of air pollution sources) Business SIC classification: ASPHALT PAVING MIXTURES AND BLOCKS
J & L MARKET (8115 SOUTH EL DORADO STREET in FRENCH CAMP, CA)
CRITERIA AND HAZARDOUS AIR POLLUTANT INVENTORY (Inventory of air pollution sources) Business SIC classification: GASOLINE SERVICE STATIONS
LAIDLAW TRANSIT SERVICE (500 W DELIVERY DR in FRENCH CAMP, CA)
Small Quantity Generators, between 100 kg and 1000 kg of hazardous waste/month (Resource Conservation and Recovery Act (tracking hazardous waste)) - notification Organizations: LAIDLAW CORPORATION (CONTACT/OWNER)
FRENCH CAMP CEMEX READY MIX (889 E ROTH RD in FRENCH CAMP, CA)
TRI REPORTER (Tracking of toxic chemicals releasing facilities) Business SIC classification: READY-MIXED CONCRETE
J.R. SIMPLOT / FRENCH CAMP (8858 S PRIEST RD in FRENCH CAMP, CA)
CRITERIA AND HAZARDOUS AIR POLLUTANT INVENTORY (Inventory of air pollution sources) Business SIC classification: FERTILIZERS, MIXING ONLY
CALIFORNIA FUEL STOPS, INC. (5777 S. FRENCH CAMP ROAD in FRENCH CAMP, CA)
CRITERIA AND HAZARDOUS AIR POLLUTANT INVENTORY (Inventory of air pollution sources) Business SIC classification: GASOLINE SERVICE STATIONS
Housing units lacking complete plumbing facilities: 5.2% Housing units lacking complete kitchen facilities: 2.7%
48.1%Utility gas
28.3%Electricity
18.0%Bottled, tank, or LP gas
3.0%Other fuel
3.0%No fuel used
Population in 1990: 3,673. Population change in the 1990s: +1,414 (+38.5%).
Place of birth for U.S.-born residents:
This state: 2,746
Northeast: 44
Midwest: 132
South: 91
West: 98
53% of the 95231 zip code residents lived in the same house 5 years ago. Out of people who lived in different houses, 63% lived in this county. Out of people who lived in different counties, 50% lived in California.
68% of the 95231 zip code residents lived in the same house 1 year ago. Out of people who lived in different houses, 57% moved from this county. Out of people who lived in different houses, 16% moved from different county within same state. Out of people who lived in different houses, 0% moved from different state. Out of people who lived in different houses, 25% moved from abroad.
Private vs. public school enrollment:
Students in private schools in grades 1 to 8 (elementary and middle school):
Here:
0.0%
California:
10.5%
Students in private schools in grades 9 to 12 (high school):
Here:
0.0%
California:
8.5%
Students in private undergraduate colleges: 16
Here:
16.8%
California:
15.9%
Occupation by median earnings in the past 12 months ($)
77,615Law enforcement workers including supervisors
59,023Office and administrative support occupations
45,302Production occupations
36,422Installation, maintenance, and repair occupations
28,223Management occupations
27,936Material moving occupations
Companies with federal contracts located in this zip code (FRENCH CAMP, CA):
SAN JOAQUIN, COUNTY OF (500 W HOSPITAL RD) : $794,500 in 3 contractsfrom 2002 to 2003
$278,314 with Department of Veterans Affairs for Lease or Rental of Facilities -- Laboratories and Clinics. Signed on 2003-10-01. Completion date: 2005-09-30.
$264,186, same as above.Signed on 2002-10-15. Completion date: 2005-09-15.
$252,000, same as above.Signed on 2002-04-15. Completion date: 2005-09-15.
SAN JOAQUIN, COUNTY OF (7000 MICHAEL CANLIS WAY) : $60,875 in 9 contractsfrom 2003 to 2006
Contracts for Other Professional Services, Legal Services by Army, U.S. Army Corps of Engineers - civil program financing only Signed by year:2000: $0; 2001: $0; 2002: $0; 2003: $34,958; 2004: -$22,904; 2005: $48,760; 2006: $61.
Biggest contracts:
$41,457 with Army for Other Professional Services. Signed on 2004-05-28. Completion date: 2004-09-30.
$34,958 with U.S. Army Corps of Engineers - civil program financing only for Other Professional Services. Signed on 2003-05-14. Completion date: 2003-09-30.
$24,380 with U.S. Army Corps of Engineers - civil program financing only for Legal Services. Signed on 2005-06-03. Completion date: 2005-09-05.
$24,380 with Army for Legal Services. Signed on 2005-06-03. Completion date: 2005-09-05.
SAN JOAQUIN COUNTY SHERIFFS OF (7000 MICHAEL N CANLIS BLV)
$39,101 with U.S. Army Corps of Engineers - civil program financing only for Other Professional Services. Signed on 2002-03-25. Completion date: 2003-03-31.
SAN JOAQUIN, COUNTY OF (500 W HOSPITAL RD)
$36,000 with Department of Veterans Affairs for Maintenance, Repair or Alteration of Real Property -- Hospitals and Infirmaries. Signed on 2000-03-15. Completion date: 2000-04-15.
NADINE WILSON (11022 S MCKINLEY AVE; small business) : $28,958 in 4 contractsin 2004
$14,479 with Army for Other Housekeeping Services. Signed on 2004-03-12. Completion date: 2004-09-30.
$14,479 with U.S. Army Corps of Engineers - civil program financing only for Other Housekeeping Services. Signed on 2004-03-12. Completion date: 2004-09-30.
$0 with Army for Other Housekeeping Services. Signed on 2004-03-12. Completion date: 2004-09-30.
$0 with U.S. Army Corps of Engineers - civil program financing only for Other Housekeeping Services. Signed on 2004-03-12. Completion date: 2004-09-30.
PAN PACIFIC RV CENTERS, INC (252 W YETTNER RD)
$26,000 with Bureau of Land Management for Trailers. Taking place in OR. Signed on 2000-09-15. Completion date: 2000-10-15.
Top industries in this zip code by the number of employees in 2005:
Health Care and Social Assistance: General Medical and Surgical Hospitals (over 1000 employees: 1 establishment)
Construction: Highway, Street, and Bridge Construction (100-249: 1)
Wholesale Trade: Automobile and Other Motor Vehicle Merchant Wholesalers (50-99: 1, 10-19: 1)
Wholesale Trade: Motor Vehicle Supplies and New Parts Merchant Wholesalers (50-99: 1)
Administrative and Support and Waste Management and Remediation Services: Temporary Help Services (50-99: 1)
Construction: Poured Concrete Foundation and Structure Contractors (50-99: 1)
People in group quarters in 2010:
1,253 people in local jails and other municipal confinement facilities
289 people in workers' group living quarters and job corps centers
157 people in correctional facilities intended for juveniles
38 people in emergency and transitional shelters (with sleeping facilities) for people experiencing homelessness
15 people in residential treatment centers for adults
8 people in nursing facilities/skilled-nursing facilities
7 people in college/university student housing
6 people in group homes intended for adults
People in group quarters in 2000:
1,311 people in local jails and other confinement facilities (including police lockups)
460 people in other nonhousehold living situations
183 people in short-term care, detention or diagnostic centers for delinquent children
178 people in homes for the mentally ill
91 people in other noninstitutional group quarters
41 people in wards in general hospitals for patients who have no usual home elsewhere
35 people in agriculture workers' dormitories on farms
13 people in mental (psychiatric) hospitals or wards
3 people in military barracks, etc.
Fatal accident statistics in 2014:
Fatal accident count: 2
Vehicles involved in fatal accidents: 2
Fatal accidents caused by drunken drivers: 2
Fatalities: 2
Persons involved in fatal accidents: 2
Pedestrians involved in fatal accidents: 0
Fatal accident statistics in 2013:
Fatal accident count: 1
Vehicles involved in fatal accidents: 1
Fatal accidents caused by drunken drivers: 0
Fatalities: 1
Persons involved in fatal accidents: 1
Pedestrians involved in fatal accidents: 1
Home Mortgage Disclosure Act Aggregated Statistics For Year 2009 (Based on 4 partial tracts)
A) FHA, FSA/RHS & VA Home Purchase Loans
B) Conventional Home Purchase Loans
C) Refinancings
D) Home Improvement Loans
F) Non-occupant Loans on < 5 Family Dwellings (A B C & D)
Number
Average Value
Number
Average Value
Number
Average Value
Number
Average Value
Number
Average Value
LOANS ORIGINATED
126
$197,205
75
$180,514
57
$231,945
1
$14,240
24
$188,354
APPLICATIONS APPROVED, NOT ACCEPTED
15
$189,059
16
$185,510
11
$254,094
0
$0
6
$186,443
APPLICATIONS DENIED
32
$203,438
27
$164,369
40
$254,010
2
$54,000
15
$193,875
APPLICATIONS WITHDRAWN
22
$217,380
14
$190,991
22
$207,864
1
$100,640
4
$206,152
FILES CLOSED FOR INCOMPLETENESS
7
$209,554
4
$165,855
9
$209,773
1
$285,820
3
$154,040
Aggregated Statistics For Year 2008 (Based on 4 partial tracts)
A) FHA, FSA/RHS & VA Home Purchase Loans
B) Conventional Home Purchase Loans
C) Refinancings
D) Home Improvement Loans
F) Non-occupant Loans on < 5 Family Dwellings (A B C & D)
G) Loans On Manufactured Home Dwelling (A B C & D)
Number
Average Value
Number
Average Value
Number
Average Value
Number
Average Value
Number
Average Value
Number
Average Value
LOANS ORIGINATED
86
$242,912
105
$216,857
30
$264,075
5
$109,296
23
$176,843
1
$20,570
APPLICATIONS APPROVED, NOT ACCEPTED
11
$257,234
23
$251,364
12
$241,225
4
$176,950
3
$177,230
1
$325,070
APPLICATIONS DENIED
22
$247,658
57
$256,636
75
$296,480
6
$70,868
14
$208,890
3
$326,420
APPLICATIONS WITHDRAWN
17
$221,007
20
$228,931
25
$244,091
3
$187,993
7
$187,970
1
$178,200
FILES CLOSED FOR INCOMPLETENESS
2
$289,975
10
$293,535
8
$332,520
2
$120,770
2
$151,315
1
$276,920
Aggregated Statistics For Year 2007 (Based on 4 partial tracts)
A) FHA, FSA/RHS & VA Home Purchase Loans
B) Conventional Home Purchase Loans
C) Refinancings
D) Home Improvement Loans
E) Loans on Dwellings For 5+ Families
F) Non-occupant Loans on < 5 Family Dwellings (A B C & D)
G) Loans On Manufactured Home Dwelling (A B C & D)
Number
Average Value
Number
Average Value
Number
Average Value
Number
Average Value
Number
Average Value
Number
Average Value
Number
Average Value
LOANS ORIGINATED
2
$318,855
159
$285,507
142
$342,020
24
$181,501
1
$1,509,600
27
$277,688
3
$219,397
APPLICATIONS APPROVED, NOT ACCEPTED
0
$0
55
$295,179
49
$374,834
11
$159,057
0
$0
11
$339,101
0
$0
APPLICATIONS DENIED
1
$366,270
141
$323,491
205
$348,141
29
$181,772
0
$0
32
$354,520
7
$134,221
APPLICATIONS WITHDRAWN
1
$284,440
57
$330,959
54
$332,896
7
$149,507
0
$0
11
$325,160
1
$84,660
FILES CLOSED FOR INCOMPLETENESS
0
$0
22
$304,125
17
$357,299
1
$227,470
0
$0
3
$245,457
0
$0
Aggregated Statistics For Year 2006 (Based on 4 partial tracts)
A) FHA, FSA/RHS & VA Home Purchase Loans
B) Conventional Home Purchase Loans
C) Refinancings
D) Home Improvement Loans
E) Loans on Dwellings For 5+ Families
F) Non-occupant Loans on < 5 Family Dwellings (A B C & D)
G) Loans On Manufactured Home Dwelling (A B C & D)
Number
Average Value
Number
Average Value
Number
Average Value
Number
Average Value
Number
Average Value
Number
Average Value
Number
Average Value
LOANS ORIGINATED
1
$296,890
190
$284,013
203
$299,868
28
$228,845
0
$0
25
$271,736
3
$317,900
APPLICATIONS APPROVED, NOT ACCEPTED
0
$0
57
$287,492
38
$288,023
6
$126,893
0
$0
12
$258,932
1
$304,940
APPLICATIONS DENIED
0
$0
93
$297,254
161
$337,336
30
$189,275
0
$0
25
$305,941
5
$245,012
APPLICATIONS WITHDRAWN
0
$0
54
$296,105
107
$318,143
9
$252,609
0
$0
11
$250,803
1
$251,600
FILES CLOSED FOR INCOMPLETENESS
0
$0
21
$317,472
25
$326,066
4
$333,918
1
$1,710,880
3
$281,740
0
$0
Aggregated Statistics For Year 2005 (Based on 4 partial tracts)
B) Conventional Home Purchase Loans
C) Refinancings
D) Home Improvement Loans
E) Loans on Dwellings For 5+ Families
F) Non-occupant Loans on < 5 Family Dwellings (A B C & D)
G) Loans On Manufactured Home Dwelling (A B C & D)
Number
Average Value
Number
Average Value
Number
Average Value
Number
Average Value
Number
Average Value
Number
Average Value
LOANS ORIGINATED
196
$296,177
238
$286,030
39
$260,921
0
$0
33
$299,034
4
$258,058
APPLICATIONS APPROVED, NOT ACCEPTED
57
$287,437
53
$281,660
6
$249,217
0
$0
8
$391,782
5
$154,000
APPLICATIONS DENIED
104
$293,520
137
$285,513
33
$169,776
1
$223,420
25
$310,288
3
$251,633
APPLICATIONS WITHDRAWN
46
$323,252
115
$254,001
10
$228,438
0
$0
14
$291,426
2
$388,975
FILES CLOSED FOR INCOMPLETENESS
17
$306,437
27
$257,315
1
$219,320
2
$965,140
3
$290,530
0
$0
Aggregated Statistics For Year 2004 (Based on 4 partial tracts)
A) FHA, FSA/RHS & VA Home Purchase Loans
B) Conventional Home Purchase Loans
C) Refinancings
D) Home Improvement Loans
E) Loans on Dwellings For 5+ Families
F) Non-occupant Loans on < 5 Family Dwellings (A B C & D)
G) Loans On Manufactured Home Dwelling (A B C & D)
Number
Average Value
Number
Average Value
Number
Average Value
Number
Average Value
Number
Average Value
Number
Average Value
Number
Average Value
LOANS ORIGINATED
1
$232,480
96
$222,518
138
$193,415
15
$118,172
2
$815,685
16
$166,954
6
$147,582
APPLICATIONS APPROVED, NOT ACCEPTED
0
$0
40
$250,850
34
$232,395
2
$155,745
1
$131,840
8
$168,758
1
$233,480
APPLICATIONS DENIED
0
$0
63
$254,869
93
$199,158
20
$156,802
1
$150,960
8
$289,789
7
$163,464
APPLICATIONS WITHDRAWN
1
$228,450
30
$241,869
41
$214,695
6
$124,138
1
$422,690
2
$234,590
2
$193,730
FILES CLOSED FOR INCOMPLETENESS
0
$0
2
$416,370
20
$201,656
0
$0
0
$0
1
$176,120
0
$0
Aggregated Statistics For Year 2003 (Based on 4 partial tracts)
A) FHA, FSA/RHS & VA Home Purchase Loans
B) Conventional Home Purchase Loans
C) Refinancings
D) Home Improvement Loans
F) Non-occupant Loans on < 5 Family Dwellings (A B C & D)
Number
Average Value
Number
Average Value
Number
Average Value
Number
Average Value
Number
Average Value
LOANS ORIGINATED
2
$215,185
74
$188,087
158
$177,756
3
$36,103
21
$172,962
APPLICATIONS APPROVED, NOT ACCEPTED
0
$0
28
$214,708
27
$166,681
1
$119,440
4
$218,320
APPLICATIONS DENIED
1
$167,060
69
$176,661
95
$163,033
8
$42,726
9
$177,593
APPLICATIONS WITHDRAWN
1
$164,040
15
$188,483
51
$158,387
1
$30,190
4
$209,802
FILES CLOSED FOR INCOMPLETENESS
0
$0
10
$216,188
15
$163,590
2
$21,640
3
$187,097
Aggregated Statistics For Year 2002 (Based on 2 partial tracts)
B) Conventional Home Purchase Loans
C) Refinancings
D) Home Improvement Loans
F) Non-occupant Loans on < 5 Family Dwellings (A B C & D)
Number
Average Value
Number
Average Value
Number
Average Value
Number
Average Value
LOANS ORIGINATED
12
$250,481
16
$188,578
1
$86,240
2
$212,635
APPLICATIONS APPROVED, NOT ACCEPTED
4
$208,680
5
$160,218
0
$0
1
$122,640
APPLICATIONS DENIED
13
$217,823
11
$216,465
0
$0
1
$276,920
APPLICATIONS WITHDRAWN
1
$231,430
4
$242,305
0
$0
0
$0
FILES CLOSED FOR INCOMPLETENESS
2
$275,535
3
$243,030
0
$0
0
$0
Aggregated Statistics For Year 2001 (Based on 2 partial tracts)
B) Conventional Home Purchase Loans
C) Refinancings
D) Home Improvement Loans
F) Non-occupant Loans on < 5 Family Dwellings (A B C & D)
Number
Average Value
Number
Average Value
Number
Average Value
Number
Average Value
LOANS ORIGINATED
8
$210,509
13
$166,791
1
$102,460
2
$143,800
APPLICATIONS APPROVED, NOT ACCEPTED
6
$156,987
4
$115,418
0
$0
0
$0
APPLICATIONS DENIED
6
$232,415
8
$127,284
2
$28,485
2
$184,150
APPLICATIONS WITHDRAWN
2
$72,790
3
$100,747
1
$23,740
1
$96,130
FILES CLOSED FOR INCOMPLETENESS
2
$200,570
2
$132,130
0
$0
0
$0
Aggregated Statistics For Year 2000 (Based on 2 partial tracts)
B) Conventional Home Purchase Loans
C) Refinancings
D) Home Improvement Loans
F) Non-occupant Loans on < 5 Family Dwellings (A B C & D)
Number
Average Value
Number
Average Value
Number
Average Value
Number
Average Value
LOANS ORIGINATED
11
$146,947
2
$126,195
1
$45,490
1
$66,070
APPLICATIONS APPROVED, NOT ACCEPTED
3
$82,943
3
$64,613
0
$0
0
$0
APPLICATIONS DENIED
9
$86,504
2
$142,220
1
$41,930
2
$80,110
APPLICATIONS WITHDRAWN
1
$150,330
1
$229,050
0
$0
0
$0
FILES CLOSED FOR INCOMPLETENESS
2
$92,965
0
$0
0
$0
0
$0
Aggregated Statistics For Year 1999 (Based on 2 partial tracts)
A) FHA, FSA/RHS & VA Home Purchase Loans
B) Conventional Home Purchase Loans
C) Refinancings
D) Home Improvement Loans
E) Loans on Dwellings For 5+ Families
F) Non-occupant Loans on < 5 Family Dwellings (A B C & D)
Detailed PMIC statistics for the following Tracts:0038.03
, 0051.19
2007 - 2018 National Fire Incident Reporting System (NFIRS) incidents
According to the data from the years 2007 - 2018 the average number of fires per year is 36. The highest number of fire incidents - 171 took place in 2018, and the least - 1 in 2009. The data has a rising trend.
When looking into fire subcategories, the most reports belonged to: Outside Fires (58.9%), and Structure Fires (15.6%).
Fire incident types reported to NFIRS in Zip Code 95231


 Nearest zip codes: 95330, 95202, 95203, 95205, 95336, 95204.


 According to the data from the years 2007 - 2018 the average number of fires per year is 36. The highest number of fire incidents - 171 took place in 2018, and the least - 1 in 2009. The data has a rising trend.
 When looking into fire subcategories, the most reports belonged to: Outside Fires (58.9%), and Structure Fires (15.6%).