Estimated zip code population in 2022: 1,770 Zip code population in 2010: 1,507 Zip code population in 2000: 1,359
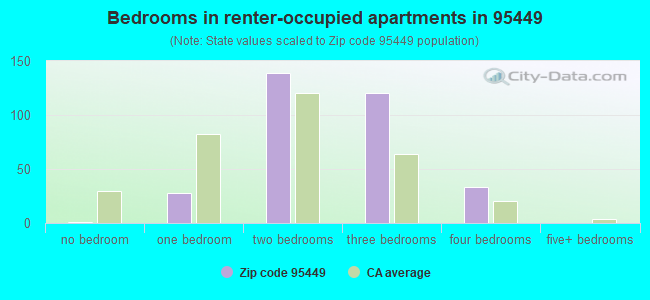
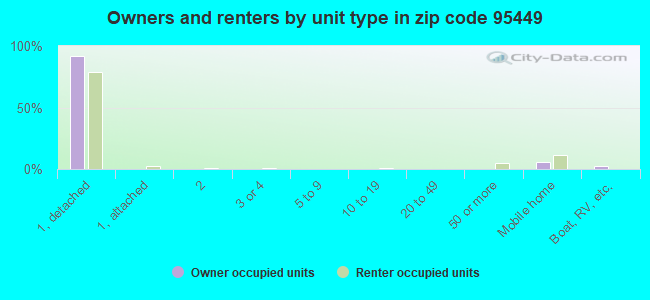
Houses and condos: 767 Renter-occupied apartments: 322
% of renters here:
54%
State:
44%
March 2022 cost of living index in zip code 95449: 101.3 (near average, U.S. average is 100)
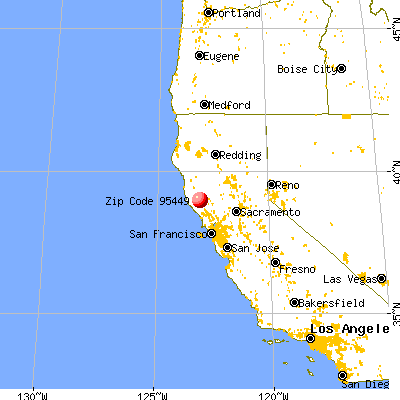
Land area: 130.6 sq. mi. Water area: 0.4 sq. mi.
Population density: 14 people per square mile
(very low).
OSM Map
General Map
Google Map
MSN Map
OSM Map
General Map
Google Map
MSN Map
OSM Map
General Map
Google Map
MSN Map
OSM Map
General Map
Google Map
MSN Map
Please wait while loading the map...
Real estate property taxes paid for housing units in 2022:
This zip code:
0.7% ($3,976)
California:
0.7% ($4,831)
Median real estate property taxes paid for housing units with mortgages in 2022: $3,471 (0.5%) Median real estate property taxes paid for housing units with no mortgage in 2022: $4,727 (0.9%)
Business Search- 14 Million verified businesses
Males: 1,031
(58.3%)
Females: 738
(41.7%)
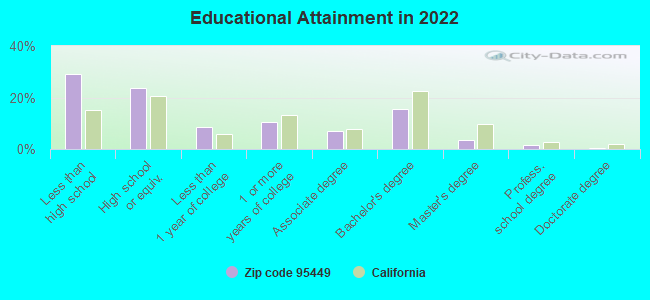
For population 25 years and over in 95449:
High school or higher: 69.7%
Bachelor's degree or higher: 20.8%
Graduate or professional degree: 5.5%
Unemployed: 15.7%
Mean travel time to work (commute): 28.3 minutes
For population 15 years and over in 95449:
Never married: 50.0%
Now married: 33.6%
Separated: 1.1%
Widowed: 3.6%
Divorced: 11.6%
Zip code 95449 compared to state average:
Unemployed percentage significantly above state average.
Black race population percentage significantly below state average.
Percentage of population with a bachelor's degree or higher below state average.
Averages for the 2020 tax year for zip code 95449, filed in 2021:
Average Adjusted Gross Income (AGI) in 2020: $57,784 (Individual Income Tax Returns)
Here:
$57,784
State:
$95,910
Salary/wage: $44,829 (reported on 80.5% of returns)
Here:
$44,829
State:
$77,331
(% of AGI for various income ranges: 1568.6% for AGIs below $25k, 5140.0% for AGIs $25k-50k, 7492.5% for AGIs $50k-75k, 16170.0% for AGIs $75k-100k, 22935.0% for AGIs $100k-200k)
Taxable interest for individuals: $984 (reported on 24.7% of returns)
This zip code:
$984
California:
$2,294
(% of AGI for various income ranges: 3.6% for AGIs below $25k, 2.9% for AGIs $25k-50k, 92.5% for AGIs $50k-75k, 260.0% for AGIs $100k-200k)
Ordinary dividends: $4,675 (reported on 10.4% of returns)
Here:
$4,675
State:
$10,949
(% of AGI for various income ranges: 11.4% for AGIs below $25k, 123.8% for AGIs $50k-75k, 647.5% for AGIs $100k-200k)
Net capital gain/loss in AGI: +$18,189 (reported on 11.7% of returns)
Here:
+$18,189
State:
+$49,306
(% of AGI for various income ranges: 21.4% for AGIs below $25k, 67.5% for AGIs $50k-75k, 3882.5% for AGIs $100k-200k)
Profit/loss from business: +$18,892 (reported on 15.6% of returns)
Here:
+$18,892
State:
+$15,671
(% of AGI for various income ranges: 118.6% for AGIs below $25k, 130.7% for AGIs $25k-50k, 638.8% for AGIs $50k-75k, 3517.5% for AGIs $100k-200k)
Taxable individual retirement arrangement distribution: $16,225 (reported on 5.2% of returns)
95449:
$16,225
California:
$23,505
(% of AGI for various income ranges: 811.3% for AGIs $50k-75k)
Total itemized deductions: $28,550 (reported on 7.8% of returns)
Here:
$28,550
State:
$39,517
(% of AGI for various income ranges: 401.4% for AGIs $25k-50k, 2877.5% for AGIs $100k-200k)
Charity contributions: $3,733 (reported on 3.9% of returns)
Here:
$3,733
State:
$12,598
(% of AGI for various income ranges: 280.0% for AGIs $100k-200k)
Taxes paid: $8,017 (reported on 7.8% of returns)
95449:
$8,017
State:
$8,807
(% of AGI for various income ranges: 127.9% for AGIs $25k-50k, 755.0% for AGIs $100k-200k)
Earned income credit: $1,853 (reported on 19.5% of returns)
Here:
$1,853
State:
$2,074
(% of AGI for various income ranges: 122.1% for AGIs below $25k, 76.4% for AGIs $25k-50k)
Percentage of individuals using paid preparers for their 2020 taxes: 90.9%
Here:
91%
State:
92%
(% for various income ranges: 92.0% for AGIs below $25k, 87.5% for AGIs $25k-50k, 100.0% for AGIs $50k-75k, 83.3% for AGIs $75k-100k, 112.5% for AGIs $100k-200k, 0.0% for AGIs over 200k)
Averages for the 2012 tax year for zip code 95449, filed in 2013:
Average Adjusted Gross Income (AGI) in 2012: $42,325 (Individual Income Tax Returns)
Here:
$42,325
State:
$72,726
Salary/wage: $35,909 (reported on 82.4% of returns)
Here:
$35,909
State:
$59,079
(% of AGI for various income ranges: 78.5% for AGIs below $25k, 81.1% for AGIs $25k-50k, 75.8% for AGIs $50k-75k, 65.1% for AGIs $75k-100k, 55.3% for AGIs $100k-200k)
Taxable interest for individuals: $1,488 (reported on 23.5% of returns)
This zip code:
$1,488
California:
$2,146
(% of AGI for various income ranges: 1.3% for AGIs below $25k, 0.7% for AGIs $25k-50k, 0.5% for AGIs $50k-75k, 1.1% for AGIs $75k-100k, 0.8% for AGIs $100k-200k)
Ordinary dividends: $3,050 (reported on 11.8% of returns)
Here:
$3,050
State:
$9,308
(% of AGI for various income ranges: 1.9% for AGIs below $25k, 1.5% for AGIs $50k-75k, 1.2% for AGIs $100k-200k)
Net capital gain/loss in AGI: +$15,633 (reported on 8.8% of returns)
Here:
+$15,633
State:
+$30,460
(% of AGI for various income ranges: 0.3% for AGIs below $25k, 10.6% for AGIs $100k-200k)
Profit/loss from business: +$10,025 (reported on 17.6% of returns)
Here:
+$10,025
State:
+$17,064
(% of AGI for various income ranges: 7.6% for AGIs below $25k, 7.6% for AGIs $25k-50k, 8.2% for AGIs $75k-100k)
Taxable individual retirement arrangement distribution: $7,425 (reported on 5.9% of returns)
95449:
$7,425
California:
$19,557
Total itemized deductions: $23,638 (25% of AGI, reported on 19.1% of returns)
Here:
$23,638
State:
$34,004
Here:
24.9% of AGI
State:
22.7% of AGI
(% of AGI for various income ranges: 8.0% for AGIs $25k-50k, 11.8% for AGIs $50k-75k, 14.6% for AGIs $75k-100k, 15.6% for AGIs $100k-200k)
Charity contributions: $1,633 (reported on 13.2% of returns)
Here:
$1,633
State:
$4,659
(% of AGI for various income ranges: 0.6% for AGIs below $25k, 1.4% for AGIs $50k-75k, 0.7% for AGIs $100k-200k)
Taxes paid: $9,085 (reported on 19.1% of returns)
95449:
$9,085
State:
$14,448
(% of AGI for various income ranges: 1.8% for AGIs $25k-50k, 3.6% for AGIs $50k-75k, 5.5% for AGIs $75k-100k, 7.6% for AGIs $100k-200k)
Earned income credit: $2,327 (reported on 22.1% of returns)
Here:
$2,327
State:
$2,286
(% of AGI for various income ranges: 5.1% for AGIs below $25k, 1.9% for AGIs $25k-50k)
Percentage of individuals using paid preparers for their 2012 taxes: 69.1%
Here:
69%
State:
64%
(% for various income ranges: 60.0% for AGIs below $25k, 68.2% for AGIs $25k-50k, 85.7% for AGIs $50k-75k, 75.0% for AGIs $75k-100k, 100.0% for AGIs $100k-200k)
Averages for the 2004 tax year for zip code 95449, filed in 2005:
Average Adjusted Gross Income (AGI) in 2004: $37,847 (Individual Income Tax Returns)
Here:
$37,847
State:
$58,600
Salary/wage: $35,000 (reported on 83.1% of returns)
Here:
$35,000
State:
$49,455
(% of AGI for various income ranges: 83.4% for AGIs $10k-25k, 84.6% for AGIs $25k-50k, 70.9% for AGIs $50k-75k, 88.6% for AGIs $75k-100k, 52.9% for AGIs over 100k)
Taxable interest for individuals: $2,536 (reported on 37.0% of returns)
This zip code:
$2,536
California:
$2,365
(% of AGI for various income ranges: 1.2% for AGIs $10k-25k, 0.8% for AGIs $25k-50k, 0.9% for AGIs $50k-75k, 0.1% for AGIs $75k-100k, 2.6% for AGIs over 100k)
Taxable dividends: $3,086 (reported on 18.1% of returns)
Here:
$3,086
State:
$4,746
(% of AGI for various income ranges: 1.1% for AGIs $10k-25k, 0.3% for AGIs $25k-50k, 1.0% for AGIs $50k-75k, 1.6% for AGIs over 100k)
Net capital gain/loss: +$26,733 (reported on 15.8% of returns)
Here:
+$26,733
State:
+$23,418
(% of AGI for various income ranges: -0.5% for AGIs $10k-25k, -0.2% for AGIs $25k-50k, 0.2% for AGIs $50k-75k, 29.0% for AGIs over 100k)
Profit/loss from business: +$9,953 (reported on 13.4% of returns)
Here:
+$9,953
State:
+$16,826
(% of AGI for various income ranges: 5.1% for AGIs $10k-25k, 4.2% for AGIs $25k-50k, 8.1% for AGIs $50k-75k, 0.0% for AGIs over 100k)
IRA payment deduction: $2,909 (reported on 1.7% of returns)
95449:
$2,909
California:
$3,192
Total itemized deductions: $22,423 (25% of AGI, reported on 23.3% of returns)
Here:
$22,423
State:
$28,113
Here:
25.5% of AGI
State:
25.3% of AGI
(% of AGI for various income ranges: 11.2% for AGIs $10k-25k, 8.7% for AGIs $25k-50k, 13.8% for AGIs $50k-75k, 15.9% for AGIs $75k-100k, 16.9% for AGIs over 100k)
Charity contributions deductions: $2,190 (2% of AGI, reported on 18.1% of returns)
Here:
$2,190
State:
$3,923
Here:
2.2% of AGI
State:
3.3% of AGI
(% of AGI for various income ranges: 0.3% for AGIs $10k-25k, 0.4% for AGIs $25k-50k, 1.1% for AGIs $50k-75k, 0.7% for AGIs $75k-100k, 1.7% for AGIs over 100k)
Total tax: $6,070 (reported on 64.7% of returns)
95449:
$6,070
State:
$10,761
(% of AGI for various income ranges: 3.3% for AGIs $10k-25k, 5.8% for AGIs $25k-50k, 8.9% for AGIs $50k-75k, 9.6% for AGIs $75k-100k, 16.0% for AGIs over 100k)
Earned income credit: $1,778 (reported on 18.3% of returns)
Here:
$1,778
State:
$1,763
Percentage of individuals using paid preparers for their 2004 taxes: 70.6%
Here:
71%
State:
66%
(% for various income ranges: 63.3% for AGIs below $10k, 68.2% for AGIs $10k-25k, 74.2% for AGIs $25k-50k, 76.7% for AGIs $50k-75k, 47.6% for AGIs $75k-100k, 87.5% for AGIs over 100k)
Likely homosexual households (counted as self-reported same-sex unmarried-partner households)
Lesbian couples: 1.2% of all households
Gay men: 0.0% of all households
Household received Food Stamps/SNAP in the past 12 months: 44 Household did not receive Food Stamps/SNAP in the past 12 months: 546
Women who had a birth in the past 12 months: 36 (19 now married, 17 unmarried) Women who did not have a birth in the past 12 months: 288 (64 now married, 225 unmarried)
Housing units in zip code 95449 with a mortgage: 137 (16 second mortgage, 8 both second mortgage and home equity loan) Houses without a mortgage: 10
Median monthly owner costs for units with a mortgage: $2,701 Median monthly owner costs for units without a mortgage: $713
Residents with income below the poverty level in 2022:
This zip code:
24.4%
Whole state:
12.2%
Residents with income below 50% of the poverty level in 2022:
This zip code:
10.7%
Whole state:
6.2%
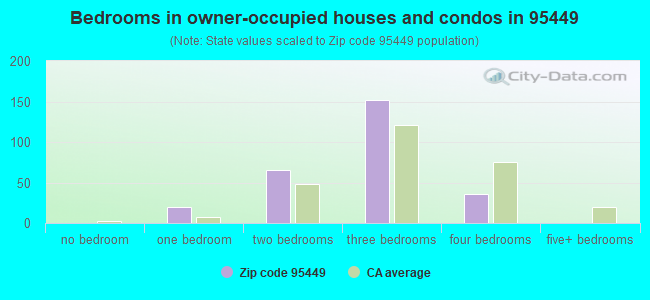
Median number of rooms in houses and condos:
Here:
5.2
State:
6.0
Median number of rooms in apartments:
Here:
4.5
State:
3.9
Notable locations in this zip code not listed on our city pages
Streams, rivers, and creeks: Coleman Creek (A), Crawford Creek (B), Cummiskey Creek (C), Dooley Creek (D), Duncan Creek (E), Edwards Creek (F), Feliz Creek (G), Jakes Creek (H), Johnson Creek (I). Display/hide their locations on the map
173 married couples with children.
74 single-parent households (74 women).
63.0% of residents of 95449 zip code speak English at home.
36.5% of residents speak Spanish at home (63% very well, 6% well, 19% not well, 12% not at all).
0.2% of residents speak Asian or Pacific Island language at home (100% well).
0.2% of residents speak other language at home (100% very well).
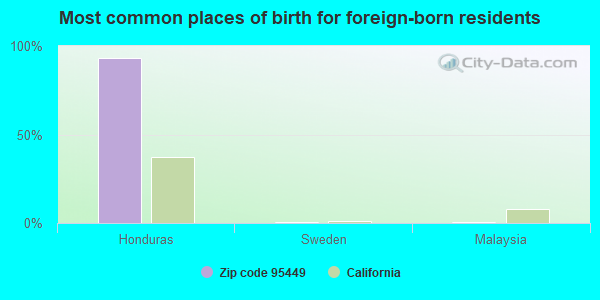
Foreign born population: 318 (18.0%) (67.1% of them are naturalized citizens)
This zip code:
18.0%
Whole state:
26.7%
93%Honduras
1%Sweden
1%Malaysia
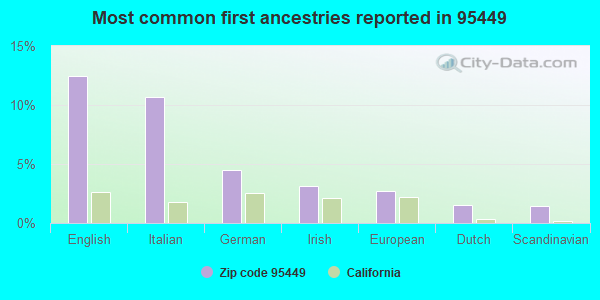
12%English
11%Italian
4%German
3%Irish
3%European
2%Dutch
1%Scandinavian
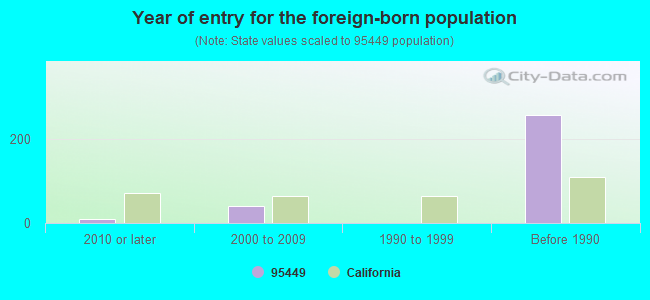
Year of entry for the foreign-born population
102010 or later
412000 to 2009
11990 to 1999
256Before 1990
Facilities with environmental interests located in this zip code:
FETZER VINEYARDS (12901 OLD RIVER RD in HOPLAND, CA)
STATE MASTER (California - Hazardous Waste Tracking) - HAZARDOU WASTE PROGRAM Small Quantity Generators, between 100 kg and 1000 kg of hazardous waste/month (Resource Conservation and Recovery Act (tracking hazardous waste)) - notification
HOPLAND ELEMENTARY (13710 MOUNTAIN HOUSE ROAD in HOPLAND, CA)
(National Center for Education Statistics) - STATE ID-6025209 Organizations: UKIAH UNIFIED (SCHOOL DISTRICT)
HOPLAND BAND OF POMO INDIANS (3000 SHANEL ROAD in HOPLAND, CA)
ENFORCEMENT/COMPLIANCE ACTIVITY (Integrated Compliance Information System) National Pollutant Discharge Elimination System NON-MAJOR (Tracking pollutant discharge elimination systems) - permit
ENFORCEMENT/COMPLIANCE ACTIVITY (Integrated Compliance Information System)
Housing units lacking complete plumbing facilities: 5.9% Housing units lacking complete kitchen facilities: 4.7%
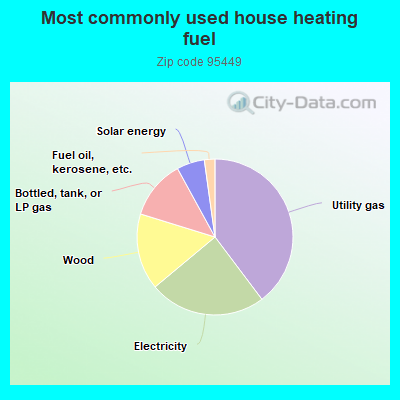
39.9%Utility gas
24.3%Electricity
15.9%Wood
12.3%Bottled, tank, or LP gas
5.8%Solar energy
2.2%Fuel oil, kerosene, etc.
Population in 1990: 1,648.
Place of birth for U.S.-born residents:
This state: 1,224
Northeast: 31
Midwest: 40
South: 77
West: 72
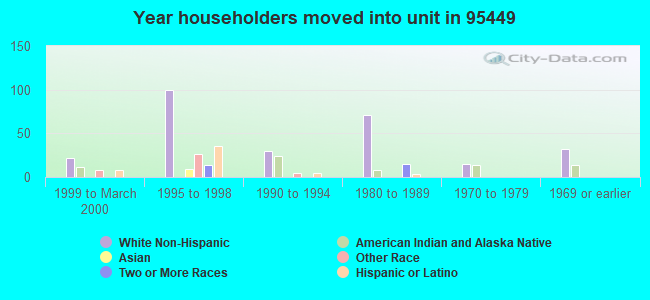
49% of the 95449 zip code residents lived in the same house 5 years ago. Out of people who lived in different houses, 65% lived in this county. Out of people who lived in different counties, 50% lived in California.
87% of the 95449 zip code residents lived in the same house 1 year ago. Out of people who lived in different houses, 47% moved from this county. Out of people who lived in different houses, 34% moved from different county within same state. Out of people who lived in different houses, 18% moved from different state.
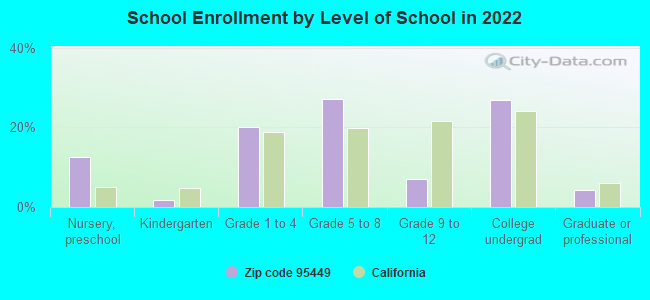
Private vs. public school enrollment:
Students in private schools in grades 1 to 8 (elementary and middle school): 36
Here:
25.6%
California:
10.5%
Students in private schools in grades 9 to 12 (high school):
Here:
0.0%
California:
8.5%
Students in private undergraduate colleges:
Here:
0.0%
California:
15.9%
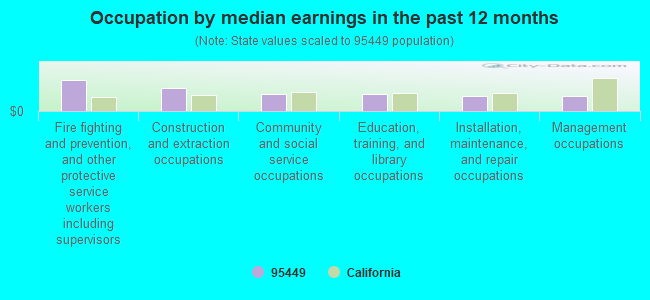
Occupation by median earnings in the past 12 months ($)
114,776Fire fighting and prevention, and other protective service workers including supervisors
85,660Construction and extraction occupations
62,687Community and social service occupations
62,396Education, training, and library occupations
56,783Installation, maintenance, and repair occupations
54,298Management occupations
Companies with federal contracts located in this zip code:
CUPPLES CONSTRUCTION (501 SAINT MARYS DR in HOPLAND, CA; small business)
$35,490 with U.S. Army Corps of Engineers - civil program financing only for Construction of Structures and Facilities -- Other Utilities. Signed on 2000-09-12. Completion date: 2000-09-12.
Top industries in this zip code by the number of employees in 2005:
Accommodation and Food Services: Limited-Service Restaurants (10-19: 1)
Construction: New Single-Family Housing Construction (except Operative Builders) (5-9: 1, 1-4: 1)
Construction: Site Preparation Contractors (1-4: 4)
Other Services (except Public Administration): Other Similar Organizations (except Business, Professional, Labor, and Political Organizations) (5-9: 1)
People in group quarters in 2010:
71 people in workers' group living quarters and job corps centers
People in group quarters in 2000:
17 people in agriculture workers' dormitories on farms
Fatal accident statistics in 2014:
Fatal accident count: 1
Vehicles involved in fatal accidents: 2
Fatal accidents caused by drunken drivers: 0
Fatalities: 1
Persons involved in fatal accidents: 5
Pedestrians involved in fatal accidents: 0
Fatal accident statistics in 2012:
Fatal accident count: 1
Vehicles involved in fatal accidents: 1
Fatal accidents caused by drunken drivers: 0
Fatalities: 1
Persons involved in fatal accidents: 1
Pedestrians involved in fatal accidents: 0
2005 - 2018 National Fire Incident Reporting System (NFIRS) incidents
According to the data from the years 2005 - 2018 the average number of fire incidents per year is 19. The highest number of reported fire incidents - 39 took place in 2018, and the least - 2 in 2010. The data has a growing trend.
When looking into fire subcategories, the most reports belonged to: Outside Fires (70.2%), and Mobile Property/Vehicle Fires (18.4%).
Fire incident types reported to NFIRS in Zip Code 95449


 Nearest zip codes: 95425, 95453, 95482, 95435, 95494, 95493.


 According to the data from the years 2005 - 2018 the average number of fire incidents per year is 19. The highest number of reported fire incidents - 39 took place in 2018, and the least - 2 in 2010. The data has a growing trend.
 When looking into fire subcategories, the most reports belonged to: Outside Fires (70.2%), and Mobile Property/Vehicle Fires (18.4%).