Estimated zip code population in 2022: 1,325 Zip code population in 2010: 1,648 Zip code population in 2000: 1,831
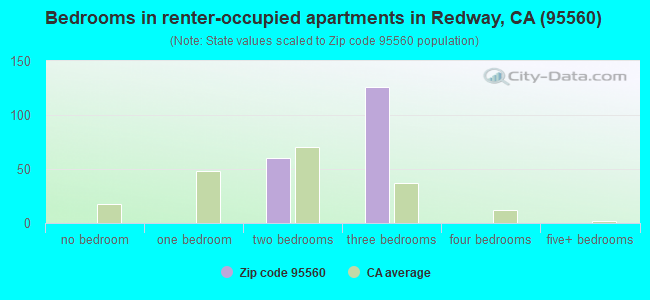
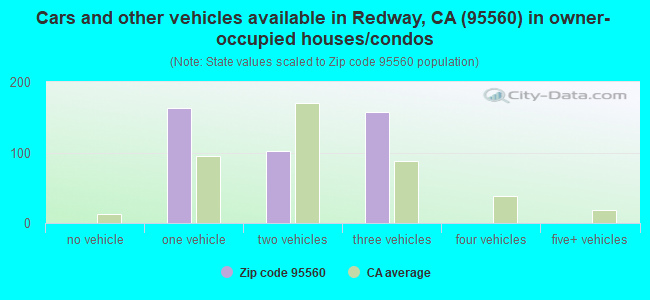
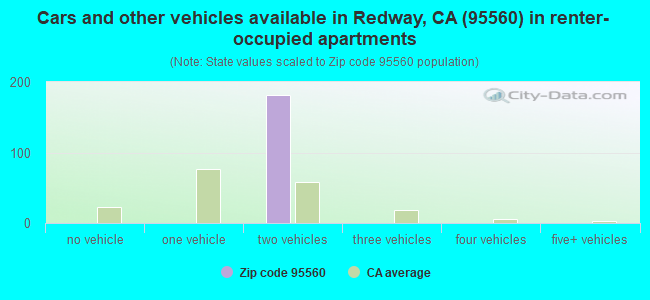
Houses and condos: 875 Renter-occupied apartments: 187
% of renters here:
31%
State:
44%
March 2022 cost of living index in zip code 95560: 95.0 (less than average, U.S. average is 100)
Land area: 33.3 sq. mi. Water area: 0.1 sq. mi.
Population density: 40 people per square mile
(very low).
OSM Map
General Map
Google Map
MSN Map
OSM Map
General Map
Google Map
MSN Map
OSM Map
General Map
Google Map
MSN Map
OSM Map
General Map
Google Map
MSN Map
Please wait while loading the map...
Real estate property taxes paid for housing units in 2022:
This zip code:
0.6% ($2,658)
California:
0.7% ($4,831)
Median real estate property taxes paid for housing units with mortgages in 2022: $2,538 (0.7%) Median real estate property taxes paid for housing units with no mortgage in 2022: $2,824 (0.5%)
Business Search- 14 Million verified businesses
Males: 562
(42.4%)
Females: 763
(57.6%)
For population 25 years and over in 95560:
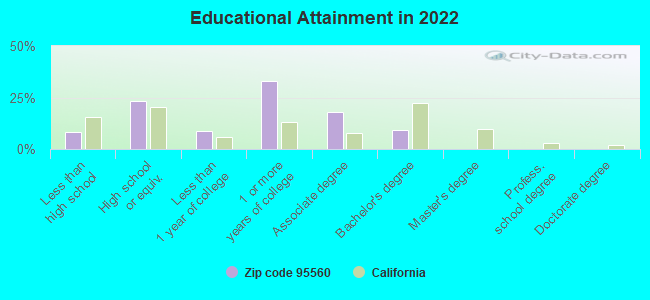
High school or higher: 89.1%
Bachelor's degree or higher: 8.9%
Graduate or professional degree: 0.0%
Mean travel time to work (commute): 18.9 minutes
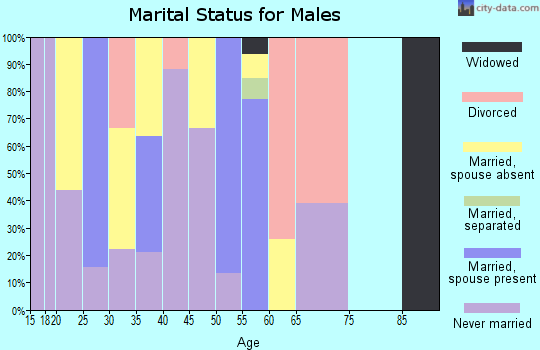
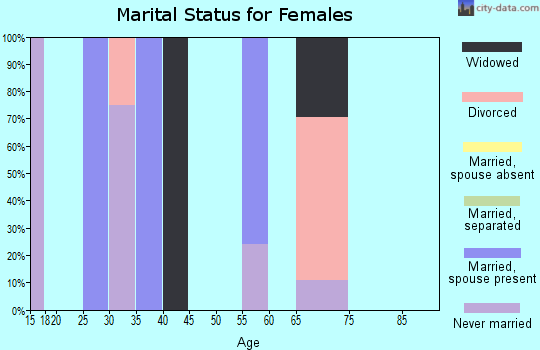
For population 15 years and over in 95560:
Never married: 42.2%
Now married: 28.7%
Separated: 0.4%
Widowed: 0.0%
Divorced: 28.7%
Zip code 95560 compared to state average:
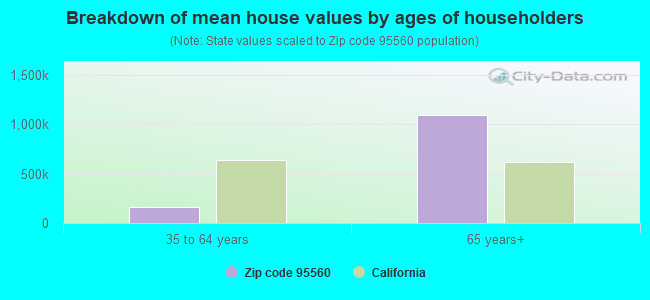
Median house value below state average.
Unemployed percentage significantly below state average.
Black race population percentage significantly below state average.
Hispanic race population percentage significantly below state average.
Median age above state average.
Foreign-born population percentage significantly below state average.
Length of stay since moving in above state average.
Number of rooms per house below state average.
Percentage of population with a bachelor's degree or higher significantly below state average.
Averages for the 2020 tax year for zip code 95560, filed in 2021:
Average Adjusted Gross Income (AGI) in 2020: $51,938 (Individual Income Tax Returns)
Here:
$51,938
State:
$95,910
Salary/wage: $31,475 (reported on 49.5% of returns)
Here:
$31,475
State:
$77,331
(% of AGI for various income ranges: 1064.7% for AGIs below $25k, 4367.0% for AGIs $25k-50k, 8295.0% for AGIs $50k-75k, 6246.7% for AGIs $75k-100k)
Taxable interest for individuals: $3,062 (reported on 40.2% of returns)
This zip code:
$3,062
California:
$2,294
(% of AGI for various income ranges: 72.1% for AGIs below $25k, 289.0% for AGIs $25k-50k, 252.5% for AGIs $50k-75k, 756.7% for AGIs $75k-100k)
Ordinary dividends: $3,775 (reported on 12.4% of returns)
Here:
$3,775
State:
$10,949
(% of AGI for various income ranges: 28.9% for AGIs below $25k, 73.0% for AGIs $25k-50k, 540.0% for AGIs $50k-75k)
Net capital gain/loss in AGI: +$14,760 (reported on 15.5% of returns)
Here:
+$14,760
State:
+$49,306
(% of AGI for various income ranges: 18.9% for AGIs below $25k, 246.0% for AGIs $25k-50k, 970.0% for AGIs $50k-75k)
Profit/loss from business: +$28,498 (reported on 45.4% of returns)
Here:
+$28,498
State:
+$15,671
(% of AGI for various income ranges: 848.9% for AGIs below $25k, 3617.0% for AGIs $25k-50k, 4482.5% for AGIs $50k-75k, 4460.0% for AGIs $75k-100k)
Taxable individual retirement arrangement distribution: $7,167 (reported on 6.2% of returns)
95560:
$7,167
California:
$23,505
(% of AGI for various income ranges: 87.9% for AGIs below $25k, 657.5% for AGIs $50k-75k)
Total itemized deductions: $30,757 (reported on 7.2% of returns)
Here:
$30,757
State:
$39,517
(% of AGI for various income ranges: 338.4% for AGIs below $25k, 1870.0% for AGIs $50k-75k)
Charity contributions: $867 (reported on 3.1% of returns)
Here:
$867
State:
$12,598
(% of AGI for various income ranges: 65.0% for AGIs $50k-75k)
Taxes paid: $6,625 (reported on 8.2% of returns)
95560:
$6,625
State:
$8,807
(% of AGI for various income ranges: 65.8% for AGIs below $25k, 440.0% for AGIs $50k-75k)
Earned income credit: $1,704 (reported on 23.7% of returns)
Here:
$1,704
State:
$2,074
(% of AGI for various income ranges: 144.7% for AGIs below $25k, 117.0% for AGIs $25k-50k)
Percentage of individuals using paid preparers for their 2020 taxes: 86.6%
Here:
87%
State:
92%
(% for various income ranges: 85.7% for AGIs below $25k, 82.8% for AGIs $25k-50k, 91.7% for AGIs $50k-75k, 83.3% for AGIs $75k-100k, 100.0% for AGIs $100k-200k, 100.0% for AGIs over 200k)
Averages for the 2012 tax year for zip code 95560, filed in 2013:
Average Adjusted Gross Income (AGI) in 2012: $34,395 (Individual Income Tax Returns)
Here:
$34,395
State:
$72,726
Salary/wage: $26,169 (reported on 44.1% of returns)
Here:
$26,169
State:
$59,079
(% of AGI for various income ranges: 36.1% for AGIs below $25k, 41.5% for AGIs $25k-50k, 35.8% for AGIs $50k-75k, 53.5% for AGIs $75k-100k)
Taxable interest for individuals: $2,005 (reported on 39.2% of returns)
This zip code:
$2,005
California:
$2,146
(% of AGI for various income ranges: 3.2% for AGIs below $25k, 1.6% for AGIs $25k-50k, 2.7% for AGIs $50k-75k, 2.6% for AGIs $75k-100k, 1.7% for AGIs $100k-200k)
Ordinary dividends: $3,964 (reported on 10.8% of returns)
Here:
$3,964
State:
$9,308
(% of AGI for various income ranges: 1.7% for AGIs below $25k, 1.2% for AGIs $25k-50k, 2.6% for AGIs $50k-75k)
Net capital gain/loss in AGI: +$6,041 (reported on 16.7% of returns)
Here:
+$6,041
State:
+$30,460
(% of AGI for various income ranges: 0.3% for AGIs below $25k, 2.0% for AGIs $25k-50k, 0.8% for AGIs $50k-75k, 6.4% for AGIs $75k-100k, 7.5% for AGIs $100k-200k)
Profit/loss from business: +$23,336 (reported on 54.9% of returns)
Here:
+$23,336
State:
+$17,064
(% of AGI for various income ranges: 49.6% for AGIs below $25k, 38.4% for AGIs $25k-50k, 39.4% for AGIs $50k-75k, 31.9% for AGIs $75k-100k, 22.5% for AGIs $100k-200k)
Taxable individual retirement arrangement distribution: $4,917 (reported on 5.9% of returns)
95560:
$4,917
California:
$19,557
Total itemized deductions: $19,052 (37% of AGI, reported on 26.5% of returns)
Here:
$19,052
State:
$34,004
Here:
36.7% of AGI
State:
22.7% of AGI
(% of AGI for various income ranges: 10.6% for AGIs below $25k, 14.8% for AGIs $25k-50k, 18.9% for AGIs $50k-75k, 11.5% for AGIs $75k-100k, 16.2% for AGIs $100k-200k)
Charity contributions: $1,609 (reported on 10.8% of returns)
Here:
$1,609
State:
$4,659
(% of AGI for various income ranges: 0.3% for AGIs below $25k, 0.4% for AGIs $25k-50k, 0.6% for AGIs $50k-75k, 1.6% for AGIs $75k-100k)
Taxes paid: $5,622 (reported on 26.5% of returns)
95560:
$5,622
State:
$14,448
(% of AGI for various income ranges: 2.6% for AGIs below $25k, 3.5% for AGIs $25k-50k, 4.6% for AGIs $50k-75k, 3.6% for AGIs $75k-100k, 7.9% for AGIs $100k-200k)
Earned income credit: $1,572 (reported on 24.5% of returns)
Here:
$1,572
State:
$2,286
(% of AGI for various income ranges: 4.5% for AGIs below $25k, 0.8% for AGIs $25k-50k)
Percentage of individuals using paid preparers for their 2012 taxes: 65.7%
Here:
66%
State:
64%
(% for various income ranges: 58.5% for AGIs below $25k, 66.7% for AGIs $25k-50k, 76.9% for AGIs $50k-75k, 100.0% for AGIs $75k-100k, 75.0% for AGIs $100k-200k)
Averages for the 2004 tax year for zip code 95560, filed in 2005:
Average Adjusted Gross Income (AGI) in 2004: $27,004 (Individual Income Tax Returns)
Here:
$27,004
State:
$58,600
Salary/wage: $20,582 (reported on 57.5% of returns)
Here:
$20,582
State:
$49,455
(% of AGI for various income ranges: 66.3% for AGIs below $10k, 47.0% for AGIs $10k-25k, 49.4% for AGIs $25k-50k, 40.4% for AGIs $50k-75k, 41.4% for AGIs $75k-100k, 28.4% for AGIs over 100k)
Taxable interest for individuals: $2,257 (reported on 45.1% of returns)
This zip code:
$2,257
California:
$2,365
(% of AGI for various income ranges: 2.4% for AGIs below $10k, 3.5% for AGIs $10k-25k, 2.1% for AGIs $25k-50k, 4.8% for AGIs $50k-75k, 6.8% for AGIs $75k-100k, 4.8% for AGIs over 100k)
Taxable dividends: $1,587 (reported on 17.5% of returns)
Here:
$1,587
State:
$4,746
(% of AGI for various income ranges: 4.6% for AGIs below $10k, 1.5% for AGIs $10k-25k, 0.7% for AGIs $25k-50k, 1.0% for AGIs $50k-75k, 0.2% for AGIs $75k-100k, 0.7% for AGIs over 100k)
Net capital gain/loss: +$7,645 (reported on 17.6% of returns)
Here:
+$7,645
State:
+$23,418
(% of AGI for various income ranges: -3.2% for AGIs below $10k, 1.5% for AGIs $10k-25k, 2.1% for AGIs $25k-50k, 5.5% for AGIs $50k-75k, 0.6% for AGIs $75k-100k, 19.2% for AGIs over 100k)
Profit/loss from business: +$16,716 (reported on 46.9% of returns)
Here:
+$16,716
State:
+$16,826
(% of AGI for various income ranges: 42.5% for AGIs below $10k, 36.7% for AGIs $10k-25k, 33.8% for AGIs $25k-50k, 33.6% for AGIs $50k-75k, 31.9% for AGIs $75k-100k)
Profit/loss from farming: +$2,158 (reported on 1.7% of returns)
Here:
+$2,158
State:
-$7,562
IRA payment deduction: $3,415 (reported on 3.7% of returns)
95560:
$3,415
California:
$3,192
Self-employed pension: $8,538 (reported on 1.2% of returns)
Here:
$8,538
California:
$17,688
Total itemized deductions: $16,574 (29% of AGI, reported on 19.3% of returns)
Here:
$16,574
State:
$28,113
Here:
29.2% of AGI
State:
25.3% of AGI
(% of AGI for various income ranges: 9.8% for AGIs below $10k, 8.8% for AGIs $10k-25k, 10.8% for AGIs $25k-50k, 13.6% for AGIs $50k-75k, 16.6% for AGIs $75k-100k, 14.1% for AGIs over 100k)
Charity contributions deductions: $1,824 (3% of AGI, reported on 12.1% of returns)
Here:
$1,824
State:
$3,923
Here:
3.0% of AGI
State:
3.3% of AGI
(% of AGI for various income ranges: 0.5% for AGIs $10k-25k, 0.6% for AGIs $25k-50k, 1.6% for AGIs $50k-75k, 0.8% for AGIs $75k-100k, 1.1% for AGIs over 100k)
Total tax: $4,202 (reported on 78.8% of returns)
95560:
$4,202
State:
$10,761
(% of AGI for various income ranges: 8.3% for AGIs below $10k, 8.9% for AGIs $10k-25k, 10.6% for AGIs $25k-50k, 12.9% for AGIs $50k-75k, 13.0% for AGIs $75k-100k, 19.7% for AGIs over 100k)
Earned income credit: $1,387 (reported on 22.9% of returns)
Here:
$1,387
State:
$1,763
Percentage of individuals using paid preparers for their 2004 taxes: 61.7%
Here:
62%
State:
66%
(% for various income ranges: 54.4% for AGIs below $10k, 56.3% for AGIs $10k-25k, 71.9% for AGIs $25k-50k, 77.5% for AGIs $50k-75k, 61.8% for AGIs $75k-100k, 77.4% for AGIs over 100k)
Household received Food Stamps/SNAP in the past 12 months: 0 Household did not receive Food Stamps/SNAP in the past 12 months: 593
Women who did not have a birth in the past 12 months: 232 (0 now married, 236 unmarried)
Housing units in zip code 95560 with a mortgage: 282 Median monthly owner costs for units with a mortgage: $2,254 Median monthly owner costs for units without a mortgage: $603
Residents with income below the poverty level in 2022:
This zip code:
22.1%
Whole state:
12.2%
Residents with income below 50% of the poverty level in 2022:
This zip code:
17.1%
Whole state:
6.2%
Median number of rooms in houses and condos:
Here:
4.3
State:
6.0
Notable locations in this zip code not listed on our city pages
Notable locations in zip code 95560: Wood Ranch (A), North Coast Conservation Center (B), Eel River Conservation Camp (C), Redway Fire Protection District (D). Display/hide their locations on the map
Churches in zip code 95560 include: Saint Andrews Episcopal Church (A), Grace Lutheran Church (B), First Baptist Church (C). Display/hide their locations on the map
Creeks: Dean Creek (A), Hacker Creek (B), Hooker Creek (C), Leggett Creek (D), Williams Creek (E), Tuttle Creek (F), Seely Creek (G), Redwood Creek (H). Display/hide their locations on the map
In group quarters: 81 (-1 institutionalized population)
Size of family households: 232 2-persons, 50 4-persons
Size of nonfamily households: 227 1-person, 108 2-persons
97.5% of residents of 95560 zip code speak English at home.
1.7% of residents speak Spanish at home (59% very well, 41% well).
0.3% of residents speak Asian or Pacific Island language at home (100% well).
Foreign born population: 9 (0.7%) (0.0% of them are naturalized citizens)
:
0.7%
Whole state:
26.7%
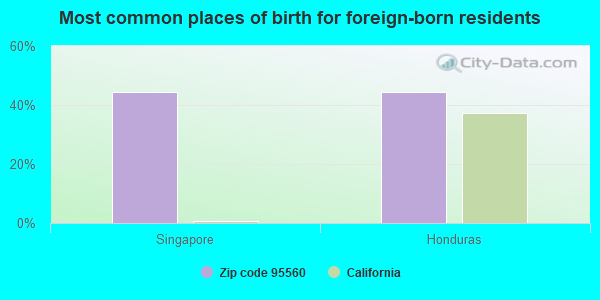
44%Singapore
44%Honduras
45%European
11%English
11%Welsh
10%Polish
8%Northern European
1%Portuguese
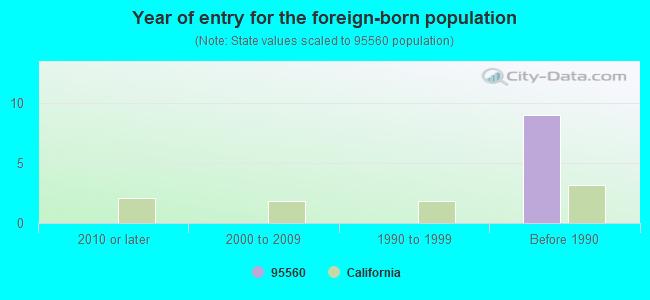
Year of entry for the foreign-born population
02010 or later
02000 to 2009
01990 to 1999
9Before 1990
Facilities with environmental interests located in this zip code:
MILE MARKER 5.3 ON BRICELAND RD (MILE MARKER 5.3 BRICELAND RD in REDWAY, CA)
(Resource Conservation and Recovery Act (tracking hazardous waste)) Organizations: DAVID MCGREGOR (CONTACT/OPERATOR)
Housing units lacking complete kitchen facilities: 3.9%
46.9%Bottled, tank, or LP gas
44.9%Wood
8.7%Electricity
Population in 1990: 148. Population change in the 1990s: +1,683 (+1137.2%).
Place of birth for U.S.-born residents:
This state: 1,167
Midwest: 48
West: 98
61% of the 95560 zip code residents lived in the same house 5 years ago. Out of people who lived in different houses, 73% lived in this county. Out of people who lived in different counties, 50% lived in California.
94% of the 95560 zip code residents lived in the same house 1 year ago. Out of people who lived in different houses, 30% moved from this county. Out of people who lived in different houses, 70% moved from different county within same state. Out of people who lived in different houses, 5% moved from different state.
Private vs. public school enrollment:
Students in private schools in grades 1 to 8 (elementary and middle school):
Here:
0.0%
California:
10.5%
Students in private undergraduate colleges: 48
Here:
47.0%
California:
15.9%
Top industries in this zip code by the number of employees in 2005:
Health Care and Social Assistance: Services for the Elderly and Persons with Disabilities (20-49 employees: 1 establishment, 5-9 employees: 1 establishment, 1-4 employees: 1 establishment)
Professional, Scientific, and Technical Services: Engineering Services (20-49: 1)
Health Care and Social Assistance: All Other Outpatient Care Centers (20-49: 1)
Accommodation and Food Services: Snack and Nonalcoholic Beverage Bars (5-9: 3, 1-4: 1)
Construction: New Single-Family Housing Construction (except Operative Builders) (10-19: 1, 5-9: 1)
Health Care and Social Assistance: Offices of Dentists (5-9: 3)
Accommodation and Food Services: Full-Service Restaurants (10-19: 1, 1-4: 3)
People in group quarters in 2010:
104 people in state prisons
32 people in other noninstitutional facilities
People in group quarters in 2000:
127 people in state prisons
Fatal accident statistics in 2014:
Fatal accident count: 1
Vehicles involved in fatal accidents: 2
Fatal accidents caused by drunken drivers: 0
Fatalities: 1
Persons involved in fatal accidents: 3
Pedestrians involved in fatal accidents: 0
Fatal accident statistics in 2012:
Fatal accident count: 2
Vehicles involved in fatal accidents: 3
Fatal accidents caused by drunken drivers: 1
Fatalities: 2
Persons involved in fatal accidents: 2
Pedestrians involved in fatal accidents: 0
2006 - 2018 National Fire Incident Reporting System (NFIRS) incidents
Based on the data from the years 2006 - 2018 the average number of fires per year is 10. The highest number of reported fires - 20 took place in 2015, and the least - 2 in 2006. The data has an increasing trend.
When looking into fire subcategories, the most reports belonged to: Outside Fires (63.6%), and Structure Fires (13.6%).
Fire incident types reported to NFIRS in Zip Code 95560


+$2,158
-$7,562
 Nearest zip codes: 95559, 95542, 95553, 95554, 95511, 95571.


 Based on the data from the years 2006 - 2018 the average number of fires per year is 10. The highest number of reported fires - 20 took place in 2015, and the least - 2 in 2006. The data has an increasing trend.
 When looking into fire subcategories, the most reports belonged to: Outside Fires (63.6%), and Structure Fires (13.6%).