Estimated zip code population in 2022: 2,888 Zip code population in 2010: 3,422 Zip code population in 2000: 2,951
Houses and condos: 1,659 Renter-occupied apartments: 245
% of renters here:
17%
State:
44%
March 2022 cost of living index in zip code 95684: 99.3 (near average, U.S. average is 100)
Land area: 145.4 sq. mi. Water area: 0.1 sq. mi.
Population density: 20 people per square mile
(very low).
OSM Map
General Map
Google Map
MSN Map
OSM Map
General Map
Google Map
MSN Map
OSM Map
General Map
Google Map
MSN Map
OSM Map
General Map
Google Map
MSN Map
Please wait while loading the map...
Real estate property taxes paid for housing units in 2022:
This zip code:
0.5% ($3,064)
California:
0.7% ($4,831)
Median real estate property taxes paid for housing units with mortgages in 2022: $3,920 (0.6%) Median real estate property taxes paid for housing units with no mortgage in 2022: $2,676 (0.5%)
Business Search- 14 Million verified businesses
Males: 1,479
(51.2%)
Females: 1,408
(48.8%)
For population 25 years and over in 95684:
High school or higher: 93.5%
Bachelor's degree or higher: 38.4%
Graduate or professional degree: 12.5%
Unemployed: 3.8%
Mean travel time to work (commute): 41.1 minutes
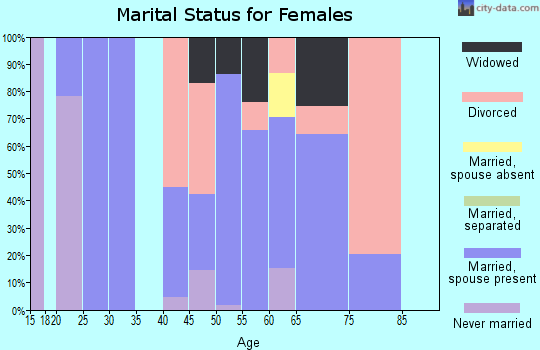
For population 15 years and over in 95684:
Never married: 18.3%
Now married: 62.9%
Separated: 1.1%
Widowed: 7.3%
Divorced: 10.5%
Zip code 95684 compared to state average:
Black race population percentage significantly below state average.
Hispanic race population percentage below state average.
Median age significantly above state average.
Foreign-born population percentage significantly below state average.
Renting percentage significantly below state average.
Length of stay since moving in significantly above state average.
Averages for the 2020 tax year for zip code 95684, filed in 2021:
Average Adjusted Gross Income (AGI) in 2020: $67,839 (Individual Income Tax Returns)
Here:
$67,839
State:
$95,910
Salary/wage: $60,540 (reported on 67.4% of returns)
Here:
$60,540
State:
$77,331
(% of AGI for various income ranges: 1090.9% for AGIs below $25k, 3604.7% for AGIs $25k-50k, 5985.5% for AGIs $50k-75k, 9768.8% for AGIs $75k-100k, 15039.2% for AGIs $100k-200k)
Taxable interest for individuals: $560 (reported on 45.9% of returns)
This zip code:
$560
California:
$2,294
(% of AGI for various income ranges: 20.5% for AGIs below $25k, 26.3% for AGIs $25k-50k, 80.9% for AGIs $50k-75k, 81.2% for AGIs $75k-100k, 50.0% for AGIs $100k-200k)
Ordinary dividends: $4,769 (reported on 19.3% of returns)
Here:
$4,769
State:
$10,949
(% of AGI for various income ranges: 31.4% for AGIs below $25k, 110.5% for AGIs $25k-50k, 67.3% for AGIs $50k-75k, 258.8% for AGIs $75k-100k, 357.7% for AGIs $100k-200k)
Net capital gain/loss in AGI: +$7,878 (reported on 20.0% of returns)
Here:
+$7,878
State:
+$49,306
(% of AGI for various income ranges: 13.6% for AGIs below $25k, 95.8% for AGIs $25k-50k, 133.6% for AGIs $50k-75k, 336.2% for AGIs $75k-100k, 560.0% for AGIs $100k-200k)
Profit/loss from business: +$10,355 (reported on 21.5% of returns)
Here:
+$10,355
State:
+$15,671
(% of AGI for various income ranges: 255.9% for AGIs below $25k, 386.8% for AGIs $25k-50k, 470.9% for AGIs $50k-75k, 962.5% for AGIs $75k-100k, 520.8% for AGIs $100k-200k)
Taxable individual retirement arrangement distribution: $20,207 (reported on 11.1% of returns)
95684:
$20,207
California:
$23,505
(% of AGI for various income ranges: 89.1% for AGIs below $25k, 212.1% for AGIs $25k-50k, 407.3% for AGIs $50k-75k, 453.7% for AGIs $75k-100k, 1246.9% for AGIs $100k-200k)
Total itemized deductions: $29,111 (reported on 14.1% of returns)
Here:
$29,111
State:
$39,517
(% of AGI for various income ranges: 449.5% for AGIs $25k-50k, 681.8% for AGIs $50k-75k, 706.2% for AGIs $75k-100k, 1775.4% for AGIs $100k-200k)
Charity contributions: $4,485 (reported on 9.6% of returns)
Here:
$4,485
State:
$12,598
(% of AGI for various income ranges: 124.5% for AGIs $50k-75k, 260.8% for AGIs $100k-200k)
Taxes paid: $7,811 (reported on 14.1% of returns)
95684:
$7,811
State:
$8,807
(% of AGI for various income ranges: 96.3% for AGIs $25k-50k, 141.8% for AGIs $50k-75k, 235.0% for AGIs $75k-100k, 521.5% for AGIs $100k-200k)
Earned income credit: $1,759 (reported on 12.6% of returns)
Here:
$1,759
State:
$2,074
(% of AGI for various income ranges: 82.3% for AGIs below $25k, 62.1% for AGIs $25k-50k)
Percentage of individuals using paid preparers for their 2020 taxes: 91.1%
Here:
91%
State:
92%
(% for various income ranges: 87.2% for AGIs below $25k, 90.6% for AGIs $25k-50k, 90.0% for AGIs $50k-75k, 93.8% for AGIs $75k-100k, 95.5% for AGIs $100k-200k, 100.0% for AGIs over 200k)
Averages for the 2012 tax year for zip code 95684, filed in 2013:
Average Adjusted Gross Income (AGI) in 2012: $55,435 (Individual Income Tax Returns)
Here:
$55,435
State:
$72,726
Salary/wage: $47,285 (reported on 68.7% of returns)
Here:
$47,285
State:
$59,079
(% of AGI for various income ranges: 54.4% for AGIs below $25k, 64.9% for AGIs $25k-50k, 62.9% for AGIs $50k-75k, 63.5% for AGIs $75k-100k, 81.4% for AGIs $100k-200k)
Taxable interest for individuals: $774 (reported on 49.6% of returns)
This zip code:
$774
California:
$2,146
(% of AGI for various income ranges: 2.0% for AGIs below $25k, 0.9% for AGIs $25k-50k, 1.0% for AGIs $50k-75k, 0.5% for AGIs $75k-100k, 0.5% for AGIs $100k-200k)
Ordinary dividends: $2,796 (reported on 20.9% of returns)
Here:
$2,796
State:
$9,308
(% of AGI for various income ranges: 1.7% for AGIs below $25k, 0.9% for AGIs $25k-50k, 1.4% for AGIs $50k-75k, 0.5% for AGIs $75k-100k, 1.6% for AGIs $100k-200k)
Net capital gain/loss in AGI: +$640 (reported on 13.0% of returns)
Here:
+$640
State:
+$30,460
(% of AGI for various income ranges: 0.6% for AGIs $100k-200k)
Profit/loss from business: +$10,928 (reported on 21.7% of returns)
Here:
+$10,928
State:
+$17,064
(% of AGI for various income ranges: 13.7% for AGIs below $25k, 8.5% for AGIs $25k-50k, 1.8% for AGIs $50k-75k, 4.4% for AGIs $75k-100k, 3.0% for AGIs $100k-200k)
Taxable individual retirement arrangement distribution: $16,154 (reported on 11.3% of returns)
95684:
$16,154
California:
$19,557
(% of AGI for various income ranges: 5.1% for AGIs below $25k, 2.3% for AGIs $25k-50k, 3.2% for AGIs $50k-75k, 4.1% for AGIs $75k-100k, 4.5% for AGIs $100k-200k)
Total itemized deductions: $23,402 (26% of AGI, reported on 41.7% of returns)
Here:
$23,402
State:
$34,004
Here:
26.2% of AGI
State:
22.7% of AGI
(% of AGI for various income ranges: 20.7% for AGIs below $25k, 18.2% for AGIs $25k-50k, 18.1% for AGIs $50k-75k, 16.9% for AGIs $75k-100k, 18.8% for AGIs $100k-200k, 13.6% for AGIs over 200k)
Charity contributions: $2,058 (reported on 34.8% of returns)
Here:
$2,058
State:
$4,659
(% of AGI for various income ranges: 0.8% for AGIs below $25k, 1.4% for AGIs $25k-50k, 1.5% for AGIs $50k-75k, 1.1% for AGIs $75k-100k, 2.1% for AGIs $100k-200k)
Taxes paid: $7,800 (reported on 41.7% of returns)
95684:
$7,800
State:
$14,448
(% of AGI for various income ranges: 3.3% for AGIs below $25k, 4.0% for AGIs $25k-50k, 4.7% for AGIs $50k-75k, 4.8% for AGIs $75k-100k, 7.3% for AGIs $100k-200k, 9.2% for AGIs over 200k)
Earned income credit: $1,658 (reported on 16.5% of returns)
Here:
$1,658
State:
$2,286
(% of AGI for various income ranges: 4.2% for AGIs below $25k, 1.0% for AGIs $25k-50k)
Percentage of individuals using paid preparers for their 2012 taxes: 51.3%
Here:
51%
State:
64%
(% for various income ranges: 39.5% for AGIs below $25k, 52.0% for AGIs $25k-50k, 64.7% for AGIs $50k-75k, 53.3% for AGIs $75k-100k, 76.9% for AGIs $100k-200k)
Averages for the 2004 tax year for zip code 95684, filed in 2005:
Average Adjusted Gross Income (AGI) in 2004: $45,775 (Individual Income Tax Returns)
Here:
$45,775
State:
$58,600
Salary/wage: $43,174 (reported on 75.6% of returns)
Here:
$43,174
State:
$49,455
(% of AGI for various income ranges: 191.7% for AGIs below $10k, 62.6% for AGIs $10k-25k, 66.8% for AGIs $25k-50k, 76.6% for AGIs $50k-75k, 72.3% for AGIs $75k-100k, 68.0% for AGIs over 100k)
Taxable interest for individuals: $1,538 (reported on 57.8% of returns)
This zip code:
$1,538
California:
$2,365
(% of AGI for various income ranges: 26.2% for AGIs below $10k, 3.2% for AGIs $10k-25k, 1.7% for AGIs $25k-50k, 1.0% for AGIs $50k-75k, 2.0% for AGIs $75k-100k, 1.9% for AGIs over 100k)
Taxable dividends: $1,710 (reported on 22.6% of returns)
Here:
$1,710
State:
$4,746
(% of AGI for various income ranges: 12.6% for AGIs below $10k, 2.1% for AGIs $10k-25k, 1.1% for AGIs $25k-50k, 0.3% for AGIs $50k-75k, 0.4% for AGIs $75k-100k, 0.8% for AGIs over 100k)
Net capital gain/loss: +$6,338 (reported on 20.9% of returns)
Here:
+$6,338
State:
+$23,418
(% of AGI for various income ranges: -9.9% for AGIs below $10k, -0.6% for AGIs $10k-25k, -0.5% for AGIs $25k-50k, 2.1% for AGIs $50k-75k, 1.9% for AGIs $75k-100k, 8.0% for AGIs over 100k)
Profit/loss from business: +$13,327 (reported on 24.5% of returns)
Here:
+$13,327
State:
+$16,826
(% of AGI for various income ranges: -42.2% for AGIs below $10k, 14.1% for AGIs $10k-25k, 10.6% for AGIs $25k-50k, 5.4% for AGIs $50k-75k, 6.9% for AGIs $75k-100k, 6.0% for AGIs over 100k)
IRA payment deduction: $3,452 (reported on 2.4% of returns)
95684:
$3,452
California:
$3,192
Total itemized deductions: $20,838 (30% of AGI, reported on 47.5% of returns)
Here:
$20,838
State:
$28,113
Here:
30.3% of AGI
State:
25.3% of AGI
(% of AGI for various income ranges: 76.7% for AGIs below $10k, 24.3% for AGIs $10k-25k, 20.8% for AGIs $25k-50k, 20.2% for AGIs $50k-75k, 21.6% for AGIs $75k-100k, 21.3% for AGIs over 100k)
Charity contributions deductions: $2,111 (3% of AGI, reported on 40.6% of returns)
Here:
$2,111
State:
$3,923
Here:
2.9% of AGI
State:
3.3% of AGI
(% of AGI for various income ranges: 3.6% for AGIs below $10k, 1.2% for AGIs $10k-25k, 2.1% for AGIs $25k-50k, 1.5% for AGIs $50k-75k, 1.9% for AGIs $75k-100k, 2.2% for AGIs over 100k)
Total tax: $5,996 (reported on 78.3% of returns)
95684:
$5,996
State:
$10,761
(% of AGI for various income ranges: 11.0% for AGIs below $10k, 5.2% for AGIs $10k-25k, 7.4% for AGIs $25k-50k, 8.5% for AGIs $50k-75k, 10.1% for AGIs $75k-100k, 15.3% for AGIs over 100k)
Earned income credit: $1,432 (reported on 12.1% of returns)
Here:
$1,432
State:
$1,763
Percentage of individuals using paid preparers for their 2004 taxes: 58.2%
Here:
58%
State:
66%
(% for various income ranges: 48.5% for AGIs below $10k, 51.9% for AGIs $10k-25k, 61.3% for AGIs $25k-50k, 65.8% for AGIs $50k-75k, 64.2% for AGIs $75k-100k, 61.1% for AGIs over 100k)
Household received Food Stamps/SNAP in the past 12 months: 33 Household did not receive Food Stamps/SNAP in the past 12 months: 1,369
Women who did not have a birth in the past 12 months: 416 (195 now married, 219 unmarried)
Housing units in zip code 95684 with a mortgage: 738 (25 second mortgage, 26 both second mortgage and home equity loan) Median monthly owner costs for units with a mortgage: $3,114 Median monthly owner costs for units without a mortgage: $667
Residents with income below the poverty level in 2022:
This zip code:
9.5%
Whole state:
12.2%
Residents with income below 50% of the poverty level in 2022:
This zip code:
6.1%
Whole state:
6.2%
Median number of rooms in houses and condos:
Here:
5.8
State:
6.0
Median number of rooms in apartments:
Here:
3.1
State:
3.9
Notable locations in this zip code not listed on our city pages
Notable locations in zip code 95684: Cedarville (A), D'Agostini Ranch (B), Brownsville (C), Coles Station (D), Five Corners (E), Fort Grizzly Site (F), Pi-Pi Campground (G), Armstrong Hill Lookout (H), Leoni Fire Tank (I), Henrys Diggings (J), Loveless Dredgings (K), Windwalker Vineyard (L), Seven Up Bar Guest Ranch (M), Perry Creek Vineyards (N), Oliver Vineyards (O), Latcham Vineyards (P), Granite Springs Winery and Vineyards (Q), Fitzpatrick Winery (R), Charles B Mitchell Vineyards (S), Hams Station (T). Display/hide their locations on the map
Rivers and creeks: Diamond Creek (A), Flat Creek (B), Sly Park Creek (C), Sopiago Creek (D), Snow Creek (E), McKinney Creek (F), Perry Creek (G), Tennessee Creek (H), Middle Dry Creek (I). Display/hide their locations on the map
Size of family households: 498 2-persons, 176 3-persons, 94 4-persons, 30 5-persons
Size of nonfamily households: 527 1-person, 100 2-persons, 20 3-persons
134 married couples with children.
49 single-parent households (2 men, 47 women).
85.1% of residents of 95684 zip code speak English at home.
14.5% of residents speak Spanish at home (94% very well, 6% not well).
0.8% of residents speak other Indo-European language at home (86% very well, 14% well).
Foreign born population: 232 (8.0%) (97.9% of them are naturalized citizens)
This zip code:
8.0%
Whole state:
26.7%
40%Costa Rica
34%Azores Islands
18%Honduras
3%Belgium
2%Bosnia and Herzegovina
1%Albania
17%Irish
15%European
12%American
9%English
5%German
5%Italian
3%Armenian
Year of entry for the foreign-born population
02010 or later
02000 to 2009
531990 to 1999
206Before 1990
Public elementary/middle schools in in zip code 95684 not listed on the city page:
Facilities with environmental interests located in this zip code:
INDIAN DIGGINGS ELEMENTARY (6020 OMO RANCH ROAD in SOMERSET, CA)
(National Center for Education Statistics) - STATE ID-6005524
MOUNTAIN CREEK MIDDLE (6862 MOUNT AUKUM ROAD in SOMERSET, CA)
(National Center for Education Statistics) - STATE ID-6112569 Organizations: PIONEER UNION ELEMENTARY (SCHOOL DISTRICT)
Housing units lacking complete plumbing facilities: 0.2% Housing units lacking complete kitchen facilities: 1.3%
29.8%Wood
28.4%Electricity
27.0%Bottled, tank, or LP gas
11.2%Utility gas
3.6%Solar energy
Population in 1990: 2,892. Population change in the 1990s: +59 (+2.0%).
Place of birth for U.S.-born residents:
This state: 1,883
Northeast: 184
Midwest: 228
South: 101
West: 201
63% of the 95684 zip code residents lived in the same house 5 years ago. Out of people who lived in different houses, 41% lived in this county. Out of people who lived in different counties, 50% lived in California.
90% of the 95684 zip code residents lived in the same house 1 year ago. Out of people who lived in different houses, 28% moved from this county. Out of people who lived in different houses, 64% moved from different county within same state. Out of people who lived in different houses, 10% moved from abroad.
Private vs. public school enrollment:
Students in private schools in grades 1 to 8 (elementary and middle school): 8
Here:
8.5%
California:
10.5%
Students in private schools in grades 9 to 12 (high school): 7
Here:
32.0%
California:
8.5%
Students in private undergraduate colleges:
Here:
0.0%
California:
15.9%
Occupation by median earnings in the past 12 months ($)
254,821Computer and mathematical occupations
172,498Health diagnosing and treating practitioners and other technical occupations
164,320Business and financial operations occupations
83,689Life, physical, and social science occupations
76,877Sales and related occupations
70,719Health technologists and technicians
Top industries in this zip code by the number of employees in 2005:
Construction: New Single-Family Housing Construction (except Operative Builders) (5-9 employees: 1 establishment, 1-4 employees: 3 establishments)
Construction: Residential Remodelers (1-4: 4)
Administrative and Support and Waste Management and Remediation Services: Landscaping Services (1-4: 4)
Accommodation and Food Services: Bed-and-Breakfast Inns (5-9: 1)
Construction: Tile and Terrazzo Contractors (5-9: 1)
Other Services (except Public Administration): Religious Organizations (5-9: 1)
Real Estate and Rental and Leasing: Lessors of Other Real Estate Property (5-9: 1)
Fatal accident statistics in 2014:
Fatal accident count: 2
Vehicles involved in fatal accidents: 2
Fatal accidents caused by drunken drivers: 1
Fatalities: 2
Persons involved in fatal accidents: 2
Pedestrians involved in fatal accidents: 0
Fatal accident statistics in 2012:
Fatal accident count: 1
Vehicles involved in fatal accidents: 2
Fatal accidents caused by drunken drivers: 1
Fatalities: 1
Persons involved in fatal accidents: 3
Pedestrians involved in fatal accidents: 0
Home Mortgage Disclosure Act Aggregated Statistics For Year 2009 (Based on 2 partial tracts)
A) FHA, FSA/RHS & VA Home Purchase Loans
B) Conventional Home Purchase Loans
C) Refinancings
D) Home Improvement Loans
F) Non-occupant Loans on < 5 Family Dwellings (A B C & D)
G) Loans On Manufactured Home Dwelling (A B C & D)
Number
Average Value
Number
Average Value
Number
Average Value
Number
Average Value
Number
Average Value
Number
Average Value
LOANS ORIGINATED
16
$205,580
24
$161,833
103
$224,170
6
$176,958
20
$172,570
14
$182,219
APPLICATIONS APPROVED, NOT ACCEPTED
0
$0
2
$224,905
13
$230,727
1
$251,090
1
$360,130
0
$0
APPLICATIONS DENIED
3
$145,870
7
$225,059
52
$247,779
8
$204,908
6
$234,590
7
$192,366
APPLICATIONS WITHDRAWN
1
$286,240
6
$237,938
34
$239,274
4
$247,145
4
$162,850
3
$181,503
FILES CLOSED FOR INCOMPLETENESS
1
$158,550
1
$120,520
6
$220,362
0
$0
1
$120,520
0
$0
Aggregated Statistics For Year 2008 (Based on 2 partial tracts)
A) FHA, FSA/RHS & VA Home Purchase Loans
B) Conventional Home Purchase Loans
C) Refinancings
D) Home Improvement Loans
F) Non-occupant Loans on < 5 Family Dwellings (A B C & D)
G) Loans On Manufactured Home Dwelling (A B C & D)
Number
Average Value
Number
Average Value
Number
Average Value
Number
Average Value
Number
Average Value
Number
Average Value
LOANS ORIGINATED
8
$211,902
36
$240,010
76
$251,722
10
$92,760
28
$211,403
11
$215,415
APPLICATIONS APPROVED, NOT ACCEPTED
2
$251,805
8
$169,575
14
$264,567
1
$22,960
6
$161,295
1
$140,610
APPLICATIONS DENIED
4
$225,442
14
$196,260
72
$280,244
17
$99,888
9
$159,422
6
$258,862
APPLICATIONS WITHDRAWN
1
$333,590
9
$200,154
29
$228,232
3
$235,547
12
$206,372
1
$479,220
FILES CLOSED FOR INCOMPLETENESS
0
$0
1
$140,610
7
$328,261
3
$99,480
1
$111,200
1
$247,500
Aggregated Statistics For Year 2007 (Based on 2 partial tracts)
A) FHA, FSA/RHS & VA Home Purchase Loans
B) Conventional Home Purchase Loans
C) Refinancings
D) Home Improvement Loans
E) Loans on Dwellings For 5+ Families
F) Non-occupant Loans on < 5 Family Dwellings (A B C & D)
G) Loans On Manufactured Home Dwelling (A B C & D)
Number
Average Value
Number
Average Value
Number
Average Value
Number
Average Value
Number
Average Value
Number
Average Value
Number
Average Value
LOANS ORIGINATED
4
$194,775
60
$245,877
143
$270,284
13
$97,512
1
$114,780
27
$243,677
26
$186,579
APPLICATIONS APPROVED, NOT ACCEPTED
0
$0
15
$265,390
37
$284,517
3
$203,740
0
$0
10
$306,975
6
$249,417
APPLICATIONS DENIED
0
$0
24
$281,938
146
$277,978
27
$147,864
0
$0
21
$229,534
18
$252,883
APPLICATIONS WITHDRAWN
0
$0
9
$273,648
56
$239,881
10
$128,128
0
$0
9
$285,047
6
$146,828
FILES CLOSED FOR INCOMPLETENESS
0
$0
5
$155,962
20
$324,265
1
$57,390
0
$0
5
$175,620
0
$0
Aggregated Statistics For Year 2006 (Based on 2 partial tracts)
A) FHA, FSA/RHS & VA Home Purchase Loans
B) Conventional Home Purchase Loans
C) Refinancings
D) Home Improvement Loans
F) Non-occupant Loans on < 5 Family Dwellings (A B C & D)
G) Loans On Manufactured Home Dwelling (A B C & D)
Number
Average Value
Number
Average Value
Number
Average Value
Number
Average Value
Number
Average Value
Number
Average Value
LOANS ORIGINATED
1
$282,660
102
$251,835
180
$247,300
44
$128,838
37
$249,578
33
$185,415
APPLICATIONS APPROVED, NOT ACCEPTED
0
$0
21
$288,360
52
$256,664
6
$123,393
6
$248,220
8
$186,434
APPLICATIONS DENIED
2
$234,950
34
$222,457
121
$283,391
30
$175,213
12
$266,574
22
$173,220
APPLICATIONS WITHDRAWN
1
$177,920
18
$234,151
77
$293,789
5
$123,106
6
$314,580
4
$175,942
FILES CLOSED FOR INCOMPLETENESS
0
$0
9
$266,633
17
$284,091
3
$198,240
2
$438,690
1
$182,220
Aggregated Statistics For Year 2005 (Based on 2 partial tracts)
A) FHA, FSA/RHS & VA Home Purchase Loans
B) Conventional Home Purchase Loans
C) Refinancings
D) Home Improvement Loans
F) Non-occupant Loans on < 5 Family Dwellings (A B C & D)
G) Loans On Manufactured Home Dwelling (A B C & D)
Number
Average Value
Number
Average Value
Number
Average Value
Number
Average Value
Number
Average Value
Number
Average Value
LOANS ORIGINATED
2
$269,025
143
$242,496
245
$238,232
48
$129,595
30
$245,901
41
$195,885
APPLICATIONS APPROVED, NOT ACCEPTED
0
$0
24
$266,514
37
$261,793
9
$157,908
6
$247,025
9
$205,893
APPLICATIONS DENIED
1
$354,400
52
$288,657
138
$260,260
27
$180,997
11
$243,068
20
$196,675
APPLICATIONS WITHDRAWN
1
$218,810
28
$205,381
103
$259,309
8
$145,721
10
$280,575
10
$225,694
FILES CLOSED FOR INCOMPLETENESS
0
$0
6
$230,763
26
$333,618
3
$120,523
0
$0
2
$237,100
Aggregated Statistics For Year 2004 (Based on 2 partial tracts)
A) FHA, FSA/RHS & VA Home Purchase Loans
B) Conventional Home Purchase Loans
C) Refinancings
D) Home Improvement Loans
F) Non-occupant Loans on < 5 Family Dwellings (A B C & D)
G) Loans On Manufactured Home Dwelling (A B C & D)
Number
Average Value
Number
Average Value
Number
Average Value
Number
Average Value
Number
Average Value
Number
Average Value
LOANS ORIGINATED
4
$175,045
136
$214,692
247
$197,927
44
$126,947
46
$191,873
29
$170,642
APPLICATIONS APPROVED, NOT ACCEPTED
2
$232,080
24
$177,437
42
$207,106
6
$110,240
5
$156,106
7
$131,899
APPLICATIONS DENIED
3
$189,393
37
$214,231
133
$205,236
21
$128,380
9
$185,328
19
$159,112
APPLICATIONS WITHDRAWN
0
$0
21
$233,189
95
$191,599
13
$80,735
6
$182,100
9
$168,270
FILES CLOSED FOR INCOMPLETENESS
0
$0
2
$357,625
23
$217,622
2
$199,435
3
$205,893
2
$255,395
Aggregated Statistics For Year 2003 (Based on 2 partial tracts)
A) FHA, FSA/RHS & VA Home Purchase Loans
B) Conventional Home Purchase Loans
C) Refinancings
D) Home Improvement Loans
E) Loans on Dwellings For 5+ Families
F) Non-occupant Loans on < 5 Family Dwellings (A B C & D)
Number
Average Value
Number
Average Value
Number
Average Value
Number
Average Value
Number
Average Value
Number
Average Value
LOANS ORIGINATED
9
$162,052
80
$175,969
461
$174,862
17
$56,759
1
$416,090
62
$195,954
APPLICATIONS APPROVED, NOT ACCEPTED
0
$0
13
$189,228
60
$181,311
6
$29,413
0
$0
6
$202,547
APPLICATIONS DENIED
4
$205,535
34
$203,678
119
$183,883
20
$48,998
0
$0
14
$219,729
APPLICATIONS WITHDRAWN
1
$243,200
19
$166,852
91
$182,196
3
$28,697
0
$0
6
$131,165
FILES CLOSED FOR INCOMPLETENESS
0
$0
6
$210,318
17
$167,956
1
$64,570
0
$0
1
$208,050
Aggregated Statistics For Year 2002 (Based on 2 partial tracts)
A) FHA, FSA/RHS & VA Home Purchase Loans
B) Conventional Home Purchase Loans
C) Refinancings
D) Home Improvement Loans
E) Loans on Dwellings For 5+ Families
F) Non-occupant Loans on < 5 Family Dwellings (A B C & D)
Number
Average Value
Number
Average Value
Number
Average Value
Number
Average Value
Number
Average Value
Number
Average Value
LOANS ORIGINATED
7
$142,147
72
$152,956
294
$159,702
14
$44,940
1
$358,700
48
$181,965
APPLICATIONS APPROVED, NOT ACCEPTED
1
$101,870
13
$137,355
39
$170,759
3
$28,697
0
$0
5
$194,990
APPLICATIONS DENIED
0
$0
17
$158,376
104
$155,690
12
$34,674
0
$0
7
$171,049
APPLICATIONS WITHDRAWN
4
$199,975
9
$149,618
58
$158,904
6
$37,663
0
$0
6
$154,480
FILES CLOSED FOR INCOMPLETENESS
1
$284,810
3
$158,783
17
$160,065
1
$43,040
0
$0
1
$71,740
Aggregated Statistics For Year 2001 (Based on 2 partial tracts)
A) FHA, FSA/RHS & VA Home Purchase Loans
B) Conventional Home Purchase Loans
C) Refinancings
D) Home Improvement Loans
F) Non-occupant Loans on < 5 Family Dwellings (A B C & D)
Number
Average Value
Number
Average Value
Number
Average Value
Number
Average Value
Number
Average Value
LOANS ORIGINATED
17
$136,897
65
$142,244
225
$147,545
14
$22,137
27
$167,553
APPLICATIONS APPROVED, NOT ACCEPTED
1
$210,920
11
$122,805
22
$125,154
2
$38,380
4
$166,438
APPLICATIONS DENIED
1
$119,090
17
$121,831
67
$140,011
17
$29,076
1
$55,240
APPLICATIONS WITHDRAWN
2
$139,895
8
$136,396
55
$130,397
5
$25,970
4
$124,648
FILES CLOSED FOR INCOMPLETENESS
0
$0
4
$145,095
14
$133,180
0
$0
1
$163,570
Aggregated Statistics For Year 2000 (Based on 2 partial tracts)
A) FHA, FSA/RHS & VA Home Purchase Loans
B) Conventional Home Purchase Loans
C) Refinancings
D) Home Improvement Loans
F) Non-occupant Loans on < 5 Family Dwellings (A B C & D)
Number
Average Value
Number
Average Value
Number
Average Value
Number
Average Value
Number
Average Value
LOANS ORIGINATED
24
$123,542
78
$130,594
62
$125,487
10
$32,355
22
$146,676
APPLICATIONS APPROVED, NOT ACCEPTED
0
$0
9
$140,052
19
$108,592
4
$14,528
1
$99,000
APPLICATIONS DENIED
3
$104,980
24
$129,580
47
$120,890
8
$75,058
4
$132,360
APPLICATIONS WITHDRAWN
1
$60,980
11
$108,393
16
$65,194
2
$34,075
2
$105,815
FILES CLOSED FOR INCOMPLETENESS
0
$0
2
$77,120
15
$119,423
1
$115,500
1
$107,610
Aggregated Statistics For Year 1999 (Based on 1 partial tract)
A) FHA, FSA/RHS & VA Home Purchase Loans
B) Conventional Home Purchase Loans
C) Refinancings
D) Home Improvement Loans
F) Non-occupant Loans on < 5 Family Dwellings (A B C & D)
Detailed PMIC statistics for the following Tracts:0314.02
2005 - 2018 National Fire Incident Reporting System (NFIRS) incidents
Based on the data from the years 2005 - 2018 the average number of fire incidents per year is 16. The highest number of fires - 32 took place in 2015, and the least - 2 in 2006. The data has a growing trend.
When looking into fire subcategories, the most reports belonged to: Outside Fires (75.1%), and Structure Fires (17.0%).
Fire incident types reported to NFIRS in Zip Code 95684


 Nearest zip codes: 95689, 95629, 95675, 95709, 95665, 95636.


 (Students: 149, Location: 6862 MT. AUKUM RD., Grades: 5-8)


 Based on the data from the years 2005 - 2018 the average number of fire incidents per year is 16. The highest number of fires - 32 took place in 2015, and the least - 2 in 2006. The data has a growing trend.
 When looking into fire subcategories, the most reports belonged to: Outside Fires (75.1%), and Structure Fires (17.0%).