Estimated zip code population in 2022: 3,019 Zip code population in 2010: 3,435 Zip code population in 2000: 3,289
Houses and condos: 1,713 Renter-occupied apartments: 273
% of renters here:
21%
State:
37%
March 2022 cost of living index in zip code 97368: 88.9 (less than average, U.S. average is 100)
Land area: 54.9 sq. mi. Water area: 1.3 sq. mi.
Population density: 55 people per square mile
(very low).
OSM Map
General Map
Google Map
MSN Map
OSM Map
General Map
Google Map
MSN Map
OSM Map
General Map
Google Map
MSN Map
OSM Map
General Map
Google Map
MSN Map
Please wait while loading the map...
Real estate property taxes paid for housing units in 2022:
This zip code:
0.7% ($1,797)
Oregon:
0.8% ($3,646)
Median real estate property taxes paid for housing units with mortgages in 2022: $1,986 (0.6%) Median real estate property taxes paid for housing units with no mortgage in 2022: $1,495 (0.7%)
Business Search- 14 Million verified businesses
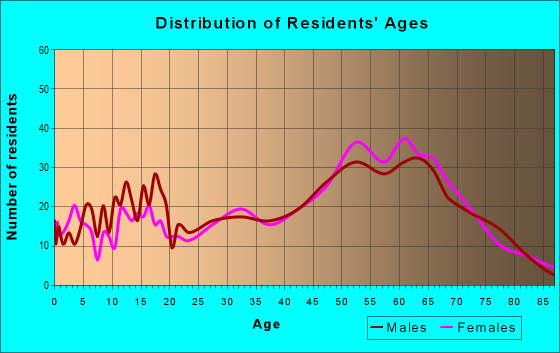
Males: 1,539
(51.0%)
Females: 1,480
(49.0%)
For population 25 years and over in 97368:
High school or higher: 93.2%
Bachelor's degree or higher: 26.9%
Graduate or professional degree: 3.5%
Mean travel time to work (commute): 26.1 minutes
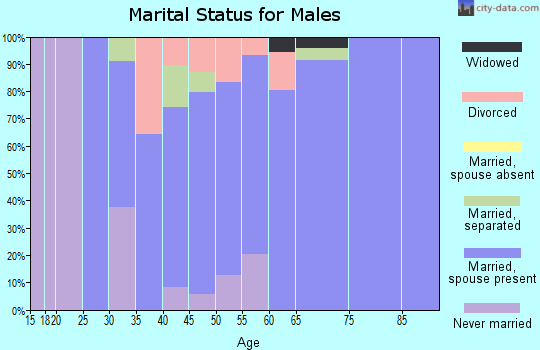
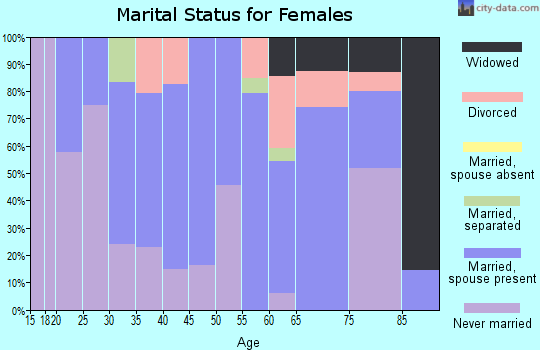
For population 15 years and over in 97368:
Never married: 24.7%
Now married: 50.0%
Separated: 4.6%
Widowed: 5.3%
Divorced: 15.3%
Zip code 97368 compared to state average:
Median house value below state average.
Unemployed percentage significantly below state average.
Black race population percentage significantly below state average.
Median age significantly above state average.
Renting percentage below state average.
Length of stay since moving in below state average.
Number of college students significantly below state average.
Averages for the 2020 tax year for zip code 97368, filed in 2021:
Average Adjusted Gross Income (AGI) in 2020: $49,866 (Individual Income Tax Returns)
Here:
$49,866
State:
$76,001
Salary/wage: $38,379 (reported on 76.1% of returns)
Here:
$38,379
State:
$61,959
(% of AGI for various income ranges: 1121.1% for AGIs below $25k, 3466.2% for AGIs $25k-50k, 6050.8% for AGIs $50k-75k, 8995.0% for AGIs $75k-100k, 15002.0% for AGIs $100k-200k)
Taxable interest for individuals: $743 (reported on 26.1% of returns)
This zip code:
$743
Oregon:
$1,628
(% of AGI for various income ranges: 19.4% for AGIs below $25k, 15.5% for AGIs $25k-50k, 13.8% for AGIs $50k-75k, 73.3% for AGIs $75k-100k, 170.0% for AGIs $100k-200k)
Ordinary dividends: $4,720 (reported on 11.2% of returns)
Here:
$4,720
State:
$7,165
(% of AGI for various income ranges: 39.7% for AGIs below $25k, 18.3% for AGIs $25k-50k, 72.3% for AGIs $50k-75k, 844.0% for AGIs $100k-200k)
Net capital gain/loss in AGI: +$13,861 (reported on 13.4% of returns)
Here:
+$13,861
State:
+$23,403
(% of AGI for various income ranges: 16.9% for AGIs below $25k, 4.8% for AGIs $25k-50k, 247.7% for AGIs $50k-75k, 962.0% for AGIs $100k-200k)
Profit/loss from business: +$19,979 (reported on 14.2% of returns)
Here:
+$19,979
State:
+$16,511
(% of AGI for various income ranges: 130.0% for AGIs below $25k, 271.0% for AGIs $25k-50k, 579.2% for AGIs $50k-75k, 3604.0% for AGIs $100k-200k)
Taxable individual retirement arrangement distribution: $14,562 (reported on 11.9% of returns)
97368:
$14,562
Oregon:
$20,730
(% of AGI for various income ranges: 80.6% for AGIs below $25k, 97.9% for AGIs $25k-50k, 428.5% for AGIs $50k-75k, 2414.0% for AGIs $100k-200k)
Total itemized deductions: $37,808 (reported on 9.7% of returns)
Here:
$37,808
State:
$31,050
(% of AGI for various income ranges: 128.0% for AGIs below $25k, 225.5% for AGIs $25k-50k, 815.4% for AGIs $50k-75k, 1578.3% for AGIs $75k-100k, 3612.0% for AGIs $100k-200k)
Charity contributions: $5,300 (reported on 4.5% of returns)
Here:
$5,300
State:
$8,791
(% of AGI for various income ranges: 26.6% for AGIs $25k-50k, 482.0% for AGIs $100k-200k)
Taxes paid: $7,018 (reported on 8.2% of returns)
97368:
$7,018
State:
$8,487
(% of AGI for various income ranges: 35.4% for AGIs below $25k, 189.2% for AGIs $50k-75k, 804.0% for AGIs $100k-200k)
Earned income credit: $1,885 (reported on 20.1% of returns)
Here:
$1,885
State:
$1,977
(% of AGI for various income ranges: 87.1% for AGIs below $25k, 70.3% for AGIs $25k-50k)
Percentage of individuals using paid preparers for their 2020 taxes: 93.3%
Here:
93%
State:
93%
(% for various income ranges: 92.2% for AGIs below $25k, 94.9% for AGIs $25k-50k, 94.7% for AGIs $50k-75k, 100.0% for AGIs $75k-100k, 83.3% for AGIs $100k-200k, 100.0% for AGIs over 200k)
Averages for the 2012 tax year for zip code 97368, filed in 2013:
Average Adjusted Gross Income (AGI) in 2012: $37,977 (Individual Income Tax Returns)
Here:
$37,977
State:
$57,845
Salary/wage: $28,967 (reported on 79.7% of returns)
Here:
$28,967
State:
$47,723
(% of AGI for various income ranges: 69.6% for AGIs below $25k, 75.7% for AGIs $25k-50k, 65.8% for AGIs $50k-75k, 66.9% for AGIs $75k-100k, 64.7% for AGIs $100k-200k)
Taxable interest for individuals: $1,215 (reported on 21.1% of returns)
This zip code:
$1,215
Oregon:
$1,848
(% of AGI for various income ranges: 1.3% for AGIs below $25k, 0.3% for AGIs $25k-50k, 0.7% for AGIs $50k-75k, 1.6% for AGIs $100k-200k)
Ordinary dividends: $3,523 (reported on 10.6% of returns)
Here:
$3,523
State:
$5,987
(% of AGI for various income ranges: 1.6% for AGIs below $25k, 0.7% for AGIs $25k-50k, 1.2% for AGIs $50k-75k, 2.6% for AGIs $75k-100k)
Net capital gain/loss in AGI: +$3,514 (reported on 11.4% of returns)
Here:
+$3,514
State:
+$13,095
(% of AGI for various income ranges: 0.4% for AGIs $25k-50k, 0.3% for AGIs $50k-75k, 6.2% for AGIs $100k-200k)
Profit/loss from business: +$7,624 (reported on 13.8% of returns)
Here:
+$7,624
State:
+$13,871
(% of AGI for various income ranges: 6.3% for AGIs below $25k, 3.1% for AGIs $25k-50k, 4.7% for AGIs $50k-75k)
Taxable individual retirement arrangement distribution: $13,342 (reported on 9.8% of returns)
97368:
$13,342
Oregon:
$16,036
(% of AGI for various income ranges: 4.6% for AGIs below $25k, 1.9% for AGIs $25k-50k, 4.3% for AGIs $50k-75k, 11.2% for AGIs $75k-100k)
Total itemized deductions: $19,778 (29% of AGI, reported on 29.3% of returns)
Here:
$19,778
State:
$24,430
Here:
29.2% of AGI
State:
23.2% of AGI
(% of AGI for various income ranges: 12.0% for AGIs below $25k, 13.7% for AGIs $25k-50k, 15.6% for AGIs $50k-75k, 19.3% for AGIs $75k-100k, 30.5% for AGIs $100k-200k)
Charity contributions: $2,435 (reported on 21.1% of returns)
Here:
$2,435
State:
$3,648
(% of AGI for various income ranges: 0.7% for AGIs below $25k, 0.9% for AGIs $25k-50k, 1.2% for AGIs $50k-75k, 2.6% for AGIs $75k-100k, 3.3% for AGIs $100k-200k)
Taxes paid: $6,331 (reported on 28.5% of returns)
97368:
$6,331
State:
$10,269
(% of AGI for various income ranges: 1.9% for AGIs below $25k, 3.6% for AGIs $25k-50k, 4.6% for AGIs $50k-75k, 6.5% for AGIs $75k-100k, 12.6% for AGIs $100k-200k)
Earned income credit: $1,926 (reported on 22.0% of returns)
Here:
$1,926
State:
$2,021
(% of AGI for various income ranges: 5.0% for AGIs below $25k, 1.1% for AGIs $25k-50k)
Percentage of individuals using paid preparers for their 2012 taxes: 40.7%
Here:
41%
State:
47%
(% for various income ranges: 34.9% for AGIs below $25k, 37.5% for AGIs $25k-50k, 46.7% for AGIs $50k-75k, 66.7% for AGIs $75k-100k, 100.0% for AGIs $100k-200k)
Averages for the 2004 tax year for zip code 97368, filed in 2005:
Average Adjusted Gross Income (AGI) in 2004: $32,493 (Individual Income Tax Returns)
Here:
$32,493
State:
$46,788
Salary/wage: $25,873 (reported on 79.5% of returns)
Here:
$25,873
State:
$39,788
(% of AGI for various income ranges: 97.1% for AGIs below $10k, 71.7% for AGIs $10k-25k, 70.9% for AGIs $25k-50k, 68.3% for AGIs $50k-75k, 58.2% for AGIs $75k-100k, 37.9% for AGIs over 100k)
Taxable interest for individuals: $2,220 (reported on 33.6% of returns)
This zip code:
$2,220
Oregon:
$2,126
(% of AGI for various income ranges: 6.6% for AGIs below $10k, 1.8% for AGIs $10k-25k, 2.2% for AGIs $25k-50k, 1.5% for AGIs $50k-75k, 2.0% for AGIs $75k-100k, 3.3% for AGIs over 100k)
Taxable dividends: $1,683 (reported on 16.4% of returns)
Here:
$1,683
State:
$3,427
(% of AGI for various income ranges: 3.2% for AGIs below $10k, 1.7% for AGIs $10k-25k, 0.6% for AGIs $25k-50k, 0.9% for AGIs $50k-75k, 0.3% for AGIs $75k-100k, 0.5% for AGIs over 100k)
Net capital gain/loss: +$12,074 (reported on 15.4% of returns)
Here:
+$12,074
State:
+$12,447
(% of AGI for various income ranges: -3.4% for AGIs below $10k, 0.6% for AGIs $10k-25k, 1.3% for AGIs $25k-50k, 4.4% for AGIs $50k-75k, 6.8% for AGIs $75k-100k, 18.7% for AGIs over 100k)
Profit/loss from business: +$9,562 (reported on 16.3% of returns)
Here:
+$9,562
State:
+$11,682
(% of AGI for various income ranges: 1.8% for AGIs below $10k, 5.0% for AGIs $10k-25k, 5.6% for AGIs $25k-50k, 3.8% for AGIs $50k-75k, 8.2% for AGIs over 100k)
IRA payment deduction: $3,132 (reported on 3.3% of returns)
97368:
$3,132
Oregon:
$3,035
Total itemized deductions: $17,117 (30% of AGI, reported on 33.1% of returns)
Here:
$17,117
State:
$20,209
Here:
30.1% of AGI
State:
24.7% of AGI
(% of AGI for various income ranges: 19.6% for AGIs below $10k, 11.5% for AGIs $10k-25k, 18.4% for AGIs $25k-50k, 20.0% for AGIs $50k-75k, 18.0% for AGIs $75k-100k, 17.6% for AGIs over 100k)
Charity contributions deductions: $2,235 (4% of AGI, reported on 25.4% of returns)
Here:
$2,235
State:
$3,145
Here:
3.7% of AGI
State:
3.6% of AGI
(% of AGI for various income ranges: 1.3% for AGIs below $10k, 1.0% for AGIs $10k-25k, 1.4% for AGIs $25k-50k, 2.0% for AGIs $50k-75k, 1.8% for AGIs $75k-100k, 2.6% for AGIs over 100k)
Total tax: $4,074 (reported on 67.8% of returns)
97368:
$4,074
State:
$7,148
(% of AGI for various income ranges: 1.6% for AGIs below $10k, 3.9% for AGIs $10k-25k, 6.6% for AGIs $25k-50k, 7.3% for AGIs $50k-75k, 10.6% for AGIs $75k-100k, 16.2% for AGIs over 100k)
Earned income credit: $1,668 (reported on 18.8% of returns)
Here:
$1,668
State:
$1,605
Percentage of individuals using paid preparers for their 2004 taxes: 54.4%
Here:
54%
State:
53%
(% for various income ranges: 46.4% for AGIs below $10k, 55.7% for AGIs $10k-25k, 49.5% for AGIs $25k-50k, 63.3% for AGIs $50k-75k, 70.4% for AGIs $75k-100k, 74.4% for AGIs over 100k)
Likely homosexual households (counted as self-reported same-sex unmarried-partner households)
Lesbian couples: 1.3% of all households
Gay men: 1.0% of all households
Household received Food Stamps/SNAP in the past 12 months: 218 Household did not receive Food Stamps/SNAP in the past 12 months: 1,099
Women who had a birth in the past 12 months: 139 (13 now married, 123 unmarried) Women who did not have a birth in the past 12 months: 296 (141 now married, 153 unmarried)
Housing units in zip code 97368 with a mortgage: 478 (8 second mortgage, 9 both second mortgage and home equity loan) Median monthly owner costs for units with a mortgage: $1,355 Median monthly owner costs for units without a mortgage: $542
Residents with income below the poverty level in 2022:
This zip code:
25.6%
Whole state:
12.1%
Residents with income below 50% of the poverty level in 2022:
This zip code:
13.3%
Whole state:
6.2%
Median number of rooms in houses and condos:
Here:
5.4
State:
6.2
Median number of rooms in apartments:
Here:
4.8
State:
4.0
Notable locations in this zip code not listed on our city pages
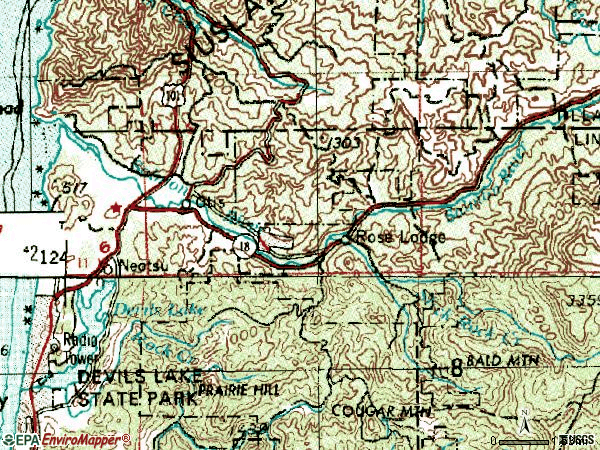
Notable locations in zip code 97368: Panther Creek (A), Salmon River Hatchery (B), Minski Place (C), Cascade Experimental Forest Headquarters (D), Otis Junction (E), Blue Heron Dock (F), Knight Park (G), Sand Point Boat Launch (H), East Devils Lake State Park Boat Ramp (I), North Lincoln Fire and Rescue District 1 Station 1300 Otis (J), North Lincoln Fire and Rescue District 1 Station 1200 Rose Lodge (K). Display/hide their locations on the map
Streams, rivers, and creeks: Curl Creek (A), McMillin Creek (B), Morton Creek (C), Baxter Creek (D), McAllister Creek (E), Swampy Creek (F), Little Creek (G), Telephone Creek (H), Mink Creek (I). Display/hide their locations on the map
Parks in zip code 97368 include: H B Van Duzer Forest State Scenic Corridor (1), Knight County Park (2), Cascade Head Scenic Research Area (3). Display/hide their locations on the map
Size of family households: 446 2-persons, 220 3-persons, 21 4-persons, 43 5-persons, 89 7-or-more-persons
Size of nonfamily households: 451 1-person, 43 2-persons
240 married couples with children.
292 single-parent households (9 men, 283 women).
86.6% of residents of 97368 zip code speak English at home.
14.6% of residents speak Spanish at home (36% very well, 31% well, 10% not well, 23% not at all).
Foreign born population: 326 (10.8%) (57.4% of them are naturalized citizens)
This zip code:
10.8%
Whole state:
9.9%
82%Honduras
6%Malaysia
4%France
10%European
9%Norwegian
8%German
4%English
3%Irish
3%Italian
3%American
Year of entry for the foreign-born population
1602010 or later
1432000 to 2009
01990 to 1999
53Before 1990
Housing units lacking complete kitchen facilities: 0.6%
57.0%Electricity
29.8%Utility gas
8.9%Wood
3.3%Bottled, tank, or LP gas
1.1%Fuel oil, kerosene, etc.
Population in 1990: 2,506. Population change in the 1990s: +783 (+31.2%).
Place of birth for U.S.-born residents:
This state: 1,566
Northeast: 62
Midwest: 216
South: 166
West: 664
51% of the 97368 zip code residents lived in the same house 5 years ago. Out of people who lived in different houses, 51% lived in this county. Out of people who lived in different counties, 50% lived in Oregon.
87% of the 97368 zip code residents lived in the same house 1 year ago. Out of people who lived in different houses, 34% moved from this county. Out of people who lived in different houses, 71% moved from different county within same state.
Private vs. public school enrollment:
Students in private schools in grades 1 to 8 (elementary and middle school): 108
Here:
35.5%
Oregon:
13.7%
Students in private schools in grades 9 to 12 (high school): 28
Here:
17.0%
Oregon:
8.8%
Occupation by median earnings in the past 12 months ($)
59,204Construction and extraction occupations
46,370Management occupations
40,559Personal care and service occupations
28,542Office and administrative support occupations
28,319Sales and related occupations
27,859Production occupations
Top industries in this zip code by the number of employees in 2005:
Construction: New Single-Family Housing Construction (except Operative Builders) (5-9 employees: 2 establishments, 1-4 employees: 3 establishments)
Accommodation and Food Services: Full-Service Restaurants (10-19: 1, 1-4: 1)
Arts, Entertainment, and Recreation: Nature Parks and Other Similar Institutions (10-19: 1, 1-4: 1)
Construction: Residential Remodelers (1-4: 5)
Construction: Commercial and Institutional Building Construction (5-9: 1)
Educational Services: Fine Arts Schools (5-9: 1)
Accommodation and Food Services: Recreational and Vacation Camps (except Campgrounds) (5-9: 1)
Construction: Roofing Contractors (5-9: 1)
Administrative and Support and Waste Management and Remediation Services: Landscaping Services (1-4: 3)
People in group quarters in 2010:
4 people in group homes intended for adults
3 people in nursing facilities/skilled-nursing facilities
Fatal accident statistics in 2010:
Fatal accident count: 1
Vehicles involved in fatal accidents: 2
Fatal accidents caused by drunken drivers: 0
Fatalities: 1
Persons involved in fatal accidents: 2
Pedestrians involved in fatal accidents: 0
2002 - 2018 National Fire Incident Reporting System (NFIRS) incidents
According to the data from the years 2002 - 2018 the average number of fires per year is 9. The highest number of fires - 27 took place in 2015, and the least - 1 in 2013. The data has a dropping trend.
When looking into fire subcategories, the most incidents belonged to: Structure Fires (42.3%), and Outside Fires (35.9%).
Fire incident types reported to NFIRS in Zip Code 97368


 Nearest zip codes: 97364, 97149, 97367, 97122, 97388, 97135.


 According to the data from the years 2002 - 2018 the average number of fires per year is 9. The highest number of fires - 27 took place in 2015, and the least - 1 in 2013. The data has a dropping trend.
 When looking into fire subcategories, the most incidents belonged to: Structure Fires (42.3%), and Outside Fires (35.9%).