Estimated zip code population in 2022: 2,008 Zip code population in 2010: 1,953 Zip code population in 2000: 1,874
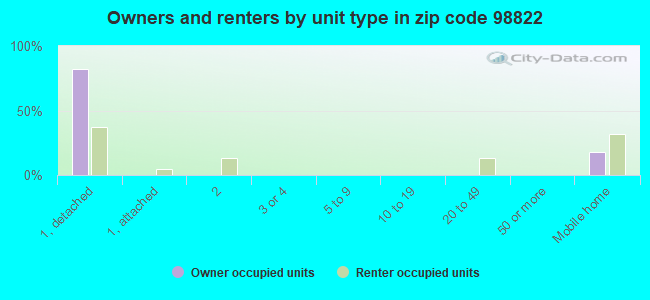
Houses and condos: 940 Renter-occupied apartments: 166
% of renters here:
22%
State:
36%
March 2022 cost of living index in zip code 98822: 88.1 (less than average, U.S. average is 100)
Land area: 437.0 sq. mi. Water area: 2.2 sq. mi.
Population density: 5 people per square mile
(very low).
OSM Map
General Map
Google Map
MSN Map
OSM Map
General Map
Google Map
MSN Map
OSM Map
General Map
Google Map
MSN Map
OSM Map
General Map
Google Map
MSN Map
Please wait while loading the map...
Real estate property taxes paid for housing units in 2022:
This zip code:
0.6% ($2,354)
Washington:
0.8% ($4,283)
Median real estate property taxes paid for housing units with mortgages in 2022: $2,477 (0.6%) Median real estate property taxes paid for housing units with no mortgage in 2022: $1,933 (0.7%)
Business Search- 14 Million verified businesses
Males: 951
(47.4%)
Females: 1,056
(52.6%)
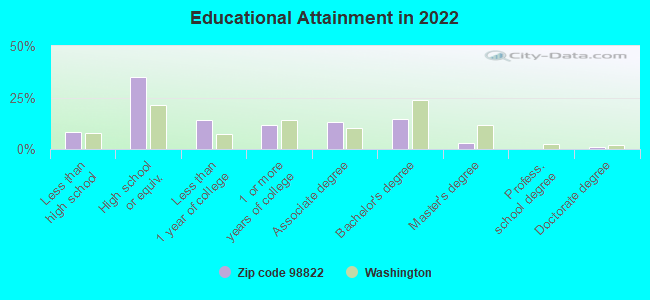
For population 25 years and over in 98822:
High school or higher: 90.0%
Bachelor's degree or higher: 18.0%
Graduate or professional degree: 3.6%
Unemployed: 2.4%
Mean travel time to work (commute): 35.2 minutes
For population 15 years and over in 98822:
Never married: 34.0%
Now married: 43.1%
Separated: 0.7%
Widowed: 11.2%
Divorced: 10.9%
Zip code 98822 compared to state average:
Median house value below state average.
Black race population percentage significantly below state average.
Median age above state average.
Renting percentage below state average.
Length of stay since moving in significantly above state average.
Percentage of population with a bachelor's degree or higher below state average.
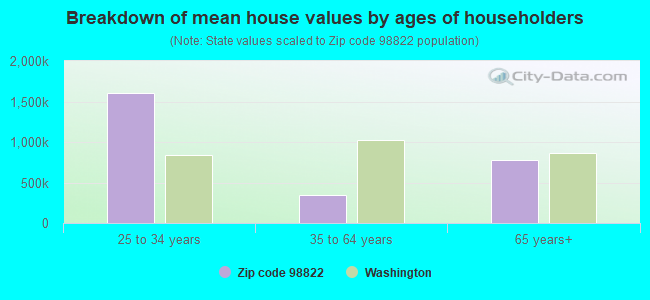
Estimated median house/condo value in 2022: $363,426
98822:
$363,426
Washington:
$569,500
According to our research of Washington and other state lists, there was 1 registered sex offender living in 98822 zip code as of April 27, 2024. The ratio of all residents to sex offenders in zip code 98822 is 2,086 to 1. The ratio of registered sex offenders to all residents in this zip code is lower than the state average.
Median resident age:
This zip code:
43.1 years
Washington median age:
38.4 years
Average household size:
This zip code:
2.6 people
Washington:
2.5 people
Averages for the 2020 tax year for zip code 98822, filed in 2021:
Average Adjusted Gross Income (AGI) in 2020: $64,980 (Individual Income Tax Returns)
Here:
$64,980
State:
$99,264
Salary/wage: $52,772 (reported on 81.8% of returns)
Here:
$52,772
State:
$80,347
(% of AGI for various income ranges: 1156.4% for AGIs below $25k, 3249.6% for AGIs $25k-50k, 6692.5% for AGIs $50k-75k, 9066.0% for AGIs $75k-100k, 16201.1% for AGIs $100k-200k)
Taxable interest for individuals: $658 (reported on 32.7% of returns)
This zip code:
$658
Washington:
$2,077
(% of AGI for various income ranges: 17.7% for AGIs below $25k, 10.4% for AGIs $25k-50k, 50.8% for AGIs $50k-75k, 18.0% for AGIs $75k-100k, 64.4% for AGIs $100k-200k)
Ordinary dividends: $2,976 (reported on 15.5% of returns)
Here:
$2,976
State:
$10,013
(% of AGI for various income ranges: 20.5% for AGIs below $25k, 21.2% for AGIs $25k-50k, 27.5% for AGIs $50k-75k, 26.0% for AGIs $75k-100k, 231.1% for AGIs $100k-200k)
Net capital gain/loss in AGI: +$18,771 (reported on 15.5% of returns)
Here:
+$18,771
State:
+$40,092
(% of AGI for various income ranges: 4.1% for AGIs below $25k, 30.8% for AGIs $25k-50k, 197.5% for AGIs $50k-75k, 83.0% for AGIs $75k-100k, 944.4% for AGIs $100k-200k)
Profit/loss from business: +$12,842 (reported on 10.9% of returns)
Here:
+$12,842
State:
+$18,312
(% of AGI for various income ranges: 116.8% for AGIs below $25k, 217.1% for AGIs $25k-50k, 65.0% for AGIs $75k-100k, 775.6% for AGIs $100k-200k)
Taxable individual retirement arrangement distribution: $16,900 (reported on 9.1% of returns)
98822:
$16,900
Washington:
$24,221
(% of AGI for various income ranges: 172.7% for AGIs below $25k, 228.3% for AGIs $50k-75k, 1151.1% for AGIs $100k-200k)
Total itemized deductions: $31,814 (reported on 6.4% of returns)
Here:
$31,814
State:
$39,068
(% of AGI for various income ranges: 355.4% for AGIs $25k-50k, 1526.7% for AGIs $100k-200k)
Charity contributions: $7,300 (reported on 4.5% of returns)
Here:
$7,300
State:
$15,331
(% of AGI for various income ranges: 405.6% for AGIs $100k-200k)
Taxes paid: $6,029 (reported on 6.4% of returns)
98822:
$6,029
State:
$7,774
(% of AGI for various income ranges: 57.9% for AGIs $25k-50k, 314.4% for AGIs $100k-200k)
Earned income credit: $2,120 (reported on 13.6% of returns)
Here:
$2,120
State:
$2,020
(% of AGI for various income ranges: 70.9% for AGIs below $25k, 67.5% for AGIs $25k-50k)
Percentage of individuals using paid preparers for their 2020 taxes: 92.7%
Here:
93%
State:
93%
(% for various income ranges: 90.0% for AGIs below $25k, 96.6% for AGIs $25k-50k, 88.9% for AGIs $50k-75k, 92.3% for AGIs $75k-100k, 93.8% for AGIs $100k-200k, 100.0% for AGIs over 200k)
Averages for the 2012 tax year for zip code 98822, filed in 2013:
Average Adjusted Gross Income (AGI) in 2012: $44,075 (Individual Income Tax Returns)
Here:
$44,075
State:
$69,533
Salary/wage: $38,338 (reported on 83.5% of returns)
Here:
$38,338
State:
$57,267
(% of AGI for various income ranges: 69.4% for AGIs below $25k, 74.4% for AGIs $25k-50k, 78.7% for AGIs $50k-75k, 74.2% for AGIs $75k-100k, 66.0% for AGIs $100k-200k)
Taxable interest for individuals: $592 (reported on 30.6% of returns)
This zip code:
$592
Washington:
$1,816
(% of AGI for various income ranges: 1.1% for AGIs below $25k, 0.6% for AGIs $25k-50k, 0.2% for AGIs $50k-75k, 0.2% for AGIs $75k-100k, 0.2% for AGIs $100k-200k)
Ordinary dividends: $3,018 (reported on 12.9% of returns)
Here:
$3,018
State:
$8,163
(% of AGI for various income ranges: 3.9% for AGIs below $25k, 1.3% for AGIs $25k-50k, 0.4% for AGIs $75k-100k, 0.4% for AGIs $100k-200k)
Net capital gain/loss in AGI: +$1,312 (reported on 9.4% of returns)
Here:
+$1,312
State:
+$21,568
(% of AGI for various income ranges: 0.2% for AGIs $75k-100k, 1.1% for AGIs $100k-200k)
Profit/loss from business: +$9,622 (reported on 10.6% of returns)
Here:
+$9,622
State:
+$16,521
(% of AGI for various income ranges: 4.4% for AGIs below $25k, 3.2% for AGIs $25k-50k, 4.8% for AGIs $50k-75k)
Taxable individual retirement arrangement distribution: $13,914 (reported on 8.2% of returns)
98822:
$13,914
Washington:
$18,648
Total itemized deductions: $20,438 (28% of AGI, reported on 24.7% of returns)
Here:
$20,438
State:
$23,872
Here:
27.7% of AGI
State:
18.2% of AGI
(% of AGI for various income ranges: 8.0% for AGIs below $25k, 10.7% for AGIs $25k-50k, 12.1% for AGIs $50k-75k, 11.8% for AGIs $75k-100k, 12.9% for AGIs $100k-200k)
Charity contributions: $2,227 (reported on 17.6% of returns)
Here:
$2,227
State:
$4,465
(% of AGI for various income ranges: 1.0% for AGIs $25k-50k, 0.9% for AGIs $50k-75k, 1.0% for AGIs $75k-100k, 1.1% for AGIs $100k-200k)
Taxes paid: $4,410 (reported on 24.7% of returns)
98822:
$4,410
State:
$6,400
(% of AGI for various income ranges: 1.4% for AGIs below $25k, 1.9% for AGIs $25k-50k, 2.0% for AGIs $50k-75k, 3.2% for AGIs $75k-100k, 3.4% for AGIs $100k-200k)
Earned income credit: $2,147 (reported on 17.6% of returns)
Here:
$2,147
State:
$2,073
(% of AGI for various income ranges: 5.0% for AGIs below $25k, 1.3% for AGIs $25k-50k)
Percentage of individuals using paid preparers for their 2012 taxes: 47.1%
Here:
47%
State:
43%
(% for various income ranges: 38.2% for AGIs below $25k, 52.4% for AGIs $25k-50k, 46.7% for AGIs $50k-75k, 50.0% for AGIs $75k-100k, 71.4% for AGIs $100k-200k)
Averages for the 2004 tax year for zip code 98822, filed in 2005:
Average Adjusted Gross Income (AGI) in 2004: $33,614 (Individual Income Tax Returns)
Here:
$33,614
State:
$54,331
Salary/wage: $30,692 (reported on 85.7% of returns)
Here:
$30,692
State:
$45,761
(% of AGI for various income ranges: 95.7% for AGIs below $10k, 77.7% for AGIs $10k-25k, 83.4% for AGIs $25k-50k, 79.5% for AGIs $50k-75k, 72.6% for AGIs $75k-100k, 66.8% for AGIs over 100k)
Taxable interest for individuals: $1,166 (reported on 39.7% of returns)
This zip code:
$1,166
Washington:
$2,110
(% of AGI for various income ranges: 7.7% for AGIs below $10k, 1.7% for AGIs $10k-25k, 1.3% for AGIs $25k-50k, 0.6% for AGIs $50k-75k, 0.8% for AGIs $75k-100k, 2.2% for AGIs over 100k)
Taxable dividends: $1,144 (reported on 14.0% of returns)
Here:
$1,144
State:
$5,879
(% of AGI for various income ranges: 1.8% for AGIs below $10k, 0.6% for AGIs $10k-25k, 0.4% for AGIs $25k-50k, 0.8% for AGIs $50k-75k, 0.2% for AGIs $75k-100k)
Net capital gain/loss: +$2,167 (reported on 12.1% of returns)
Here:
+$2,167
State:
+$15,835
(% of AGI for various income ranges: -0.6% for AGIs below $10k, -0.4% for AGIs $10k-25k, -0.3% for AGIs $25k-50k, 1.1% for AGIs $50k-75k, 4.0% for AGIs $75k-100k)
Profit/loss from business: +$8,233 (reported on 12.1% of returns)
Here:
+$8,233
State:
+$13,994
(% of AGI for various income ranges: 6.5% for AGIs below $10k, 5.9% for AGIs $10k-25k, 2.8% for AGIs $25k-50k, 3.4% for AGIs $50k-75k, 1.6% for AGIs $75k-100k)
Profit/loss from farming: +$1,632 (reported on 2.6% of returns)
Here:
+$1,632
State:
-$6,197
IRA payment deduction: $2,160 (reported on 3.4% of returns)
98822:
$2,160
Washington:
$3,001
Total itemized deductions: $15,277 (27% of AGI, reported on 23.3% of returns)
Here:
$15,277
State:
$19,669
Here:
26.9% of AGI
State:
20.7% of AGI
(% of AGI for various income ranges: 15.3% for AGIs $10k-25k, 8.0% for AGIs $25k-50k, 12.7% for AGIs $50k-75k, 10.8% for AGIs $75k-100k, 9.1% for AGIs over 100k)
Charity contributions deductions: $1,953 (3% of AGI, reported on 17.4% of returns)
Here:
$1,953
State:
$3,569
Here:
3.1% of AGI
State:
3.5% of AGI
(% of AGI for various income ranges: 0.9% for AGIs $10k-25k, 0.4% for AGIs $25k-50k, 1.0% for AGIs $50k-75k, 2.0% for AGIs $75k-100k, 1.6% for AGIs over 100k)
Total tax: $4,154 (reported on 65.5% of returns)
98822:
$4,154
State:
$9,065
(% of AGI for various income ranges: 2.8% for AGIs below $10k, 3.4% for AGIs $10k-25k, 5.9% for AGIs $25k-50k, 8.0% for AGIs $50k-75k, 10.8% for AGIs $75k-100k, 17.0% for AGIs over 100k)
Earned income credit: $1,905 (reported on 19.8% of returns)
Here:
$1,905
State:
$1,607
Percentage of individuals using paid preparers for their 2004 taxes: 45.6%
Here:
46%
State:
49%
(% for various income ranges: 32.1% for AGIs below $10k, 48.0% for AGIs $10k-25k, 44.0% for AGIs $25k-50k, 51.9% for AGIs $50k-75k, 63.0% for AGIs $75k-100k, 75.0% for AGIs over 100k)
Household received Food Stamps/SNAP in the past 12 months: 71 Household did not receive Food Stamps/SNAP in the past 12 months: 686
Women who had a birth in the past 12 months: 12 (9 now married, 3 unmarried) Women who did not have a birth in the past 12 months: 514 (147 now married, 369 unmarried)
Housing units in zip code 98822 with a mortgage: 368 (18 second mortgage, 18 both second mortgage and home equity loan) Houses without a mortgage: 8
Median monthly owner costs for units with a mortgage: $1,621 Median monthly owner costs for units without a mortgage: $416
Residents with income below the poverty level in 2022:
This zip code:
2.9%
Whole state:
10.0%
Residents with income below 50% of the poverty level in 2022:
This zip code:
1.7%
Whole state:
4.6%
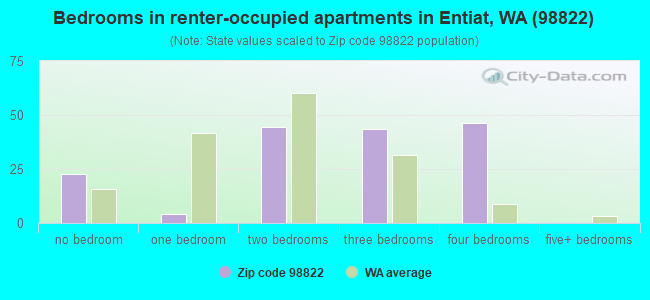
Median number of rooms in houses and condos:
Here:
5.4
State:
6.5
Median number of rooms in apartments:
Here:
4.2
State:
3.9
Notable locations in this zip code not listed on our city pages
Notable locations in zip code 98822: Cougar Creek Shelter (A), Cottonwood Guard Station (B), Fox Creek Campground (C), North Fork Campground (D), Shady Pass Campground (E), Miners Corral (F), Lake Creek Campground (G), Three Creek Ridge Camp (H), Prairie Spring Campground (I), Camp Nine (J), Entiat Ranger Station (K), Brief (L), Steliko (M), Entiat Fish Hatchery (N), Blue Creek Campground (O), Berg Camp (P), Pine Flat Campground (Q), Silver Falls Campground (R), Sugarloaf Peak Lookout (S), Cottonwood Campground (T). Display/hide their locations on the map
Churches in zip code 98822 include: Entiat Warehouse Community Church (A), Entiat Federated Church (B), Friends Church (C). Display/hide their locations on the map
Lakes and swamps: Larch Lakes (A), Ice Lakes (B), Lower Pawn Lake (C), Devil Lake (D), Upper Pawn Lake (E), Mad Lake (F), Choral Lake (G), Myrtle Lake (H). Display/hide their locations on the map
Rivers and creeks: Berg Creek (A), Billy Creek (B), Blue Creek (C), Brennegan Creek (D), Burns Creek (E), Butte Creek (F), Choral Creek (G), Cool Creek (H), Corral Creek (I). Display/hide their locations on the map
In group quarters: 21 (-1 institutionalized population)
Size of family households: 235 2-persons, 84 3-persons, 73 4-persons, 87 5-persons, 2 6-persons, 7 7-or-more-persons
Size of nonfamily households: 230 1-person, 28 2-persons, 9 3-persons
173 married couples with children.
114 single-parent households (16 men, 98 women).
87.6% of residents of 98822 zip code speak English at home.
9.0% of residents speak Spanish at home (30% very well, 40% well, 7% not well, 23% not at all).
1.9% of residents speak other Indo-European language at home (100% very well).
1.4% of residents speak Asian or Pacific Island language at home (100% very well).
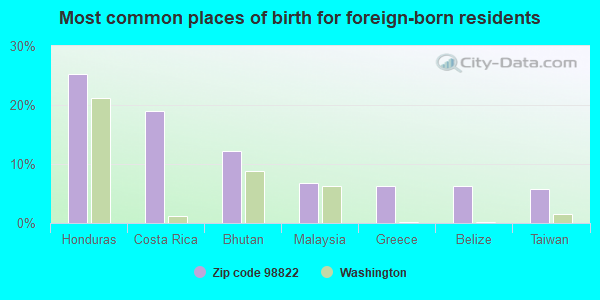
Foreign born population: 207 (10.3%) (58.9% of them are naturalized citizens)
This zip code:
10.3%
Whole state:
15.3%
25%Honduras
19%Costa Rica
12%Bhutan
7%Malaysia
6%Greece
6%Belize
6%Taiwan
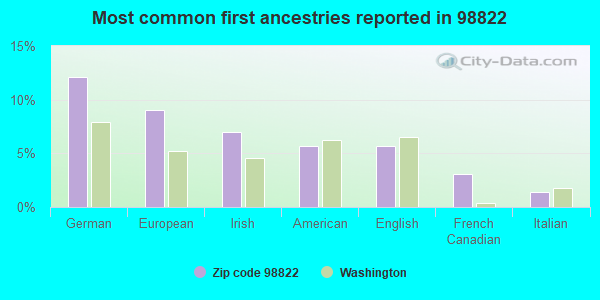
12%German
9%European
7%Irish
6%American
6%English
3%French Canadian
1%Italian
Year of entry for the foreign-born population
572010 or later
902000 to 2009
471990 to 1999
48Before 1990
Housing units lacking complete plumbing facilities: 5.4% Housing units lacking complete kitchen facilities: 2.2%
93.7%Electricity
5.9%Wood
0.5%Utility gas
Population in 1990: 1,507. Population change in the 1990s: +367 (+24.4%).
Place of birth for U.S.-born residents:
This state: 1,063
Northeast: 72
Midwest: 60
South: 104
West: 455
50% of the 98822 zip code residents lived in the same house 5 years ago. Out of people who lived in different houses, 48% lived in this county. Out of people who lived in different counties, 50% lived in Washington.
92% of the 98822 zip code residents lived in the same house 1 year ago. Out of people who lived in different houses, 69% moved from this county. Out of people who lived in different houses, 12% moved from different county within same state. Out of people who lived in different houses, 15% moved from different state. Out of people who lived in different houses, 3% moved from abroad.
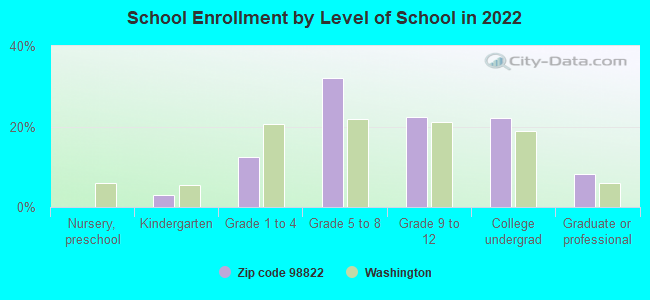
Private vs. public school enrollment:
Students in private schools in grades 1 to 8 (elementary and middle school): 48
Here:
27.8%
Washington:
12.4%
Students in private schools in grades 9 to 12 (high school):
Here:
0.0%
Washington:
9.2%
Students in private undergraduate colleges:
Here:
1.0%
Washington:
16.5%
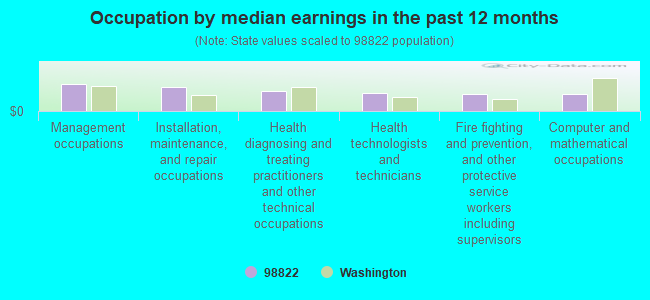
Occupation by median earnings in the past 12 months ($)
101,743Management occupations
87,806Installation, maintenance, and repair occupations
73,812Health diagnosing and treating practitioners and other technical occupations
67,369Health technologists and technicians
63,435Fire fighting and prevention, and other protective service workers including supervisors
61,344Computer and mathematical occupations
Companies with federal contracts located in this zip code:
U S CASTINGS, LLC (14351 SHAMEL in ENTIAT, WA; small business) : $95,205 in 8 contractsfrom 2003 to 2006
Contracts for Marine Hardware and Hull Items, Nonferrous Base Metal Refinery and Intermediate Forms, Miscellaneous Items, Miscellaneous Prefabricated Structures, and moreby Navy Signed by year:2000: $0; 2001: $0; 2002: $0; 2003: $24,818; 2004: $19,750; 2005: $45,137; 2006: $5,500.
Biggest contracts:
$23,700 with Navy for Marine Hardware and Hull Items. Signed on 2005-04-14. Completion date: 2005-06-29.
$19,750, same as above.Signed on 2004-09-08. Completion date: 2004-11-30.
$19,293 with Navy for Nonferrous Base Metal Refinery and Intermediate Forms. Signed on 2003-02-06. Completion date: 2003-04-03.
$13,600 with Navy for Miscellaneous Items. Signed on 2005-06-30. Completion date: 2005-09-22.
Top industries in this zip code by the number of employees in 2005:
Administrative and Support and Waste Management and Remediation Services: All Other Support Services (10-19 employees: 2 establishments)
Construction: Plumbing, Heating, and Air-Conditioning Contractors (10-19: 1, 1-4: 1)
Accommodation and Food Services: Drinking Places (Alcoholic Beverages) (5-9: 1)
Arts, Entertainment, and Recreation: All Other Amusement and Recreation Industries (1-4: 2)
Administrative and Support and Waste Management and Remediation Services: Other Services to Buildings and Dwellings (1-4: 1)
Construction: Poured Concrete Foundation and Structure Contractors (1-4: 1)
Health Care and Social Assistance: Homes for the Elderly (1-4: 1)
People in group quarters in 2010:
4 people in workers' group living quarters and job corps centers
2 people in correctional residential facilities
People in group quarters in 2000:
3 people in other noninstitutional group quarters
Fatal accident statistics in 2014:
Fatal accident count: 1
Vehicles involved in fatal accidents: 1
Fatal accidents caused by drunken drivers: 0
Fatalities: 1
Persons involved in fatal accidents: 2
Pedestrians involved in fatal accidents: 0
Fatal accident statistics in 2013:
Fatal accident count: 1
Vehicles involved in fatal accidents: 1
Fatal accidents caused by drunken drivers: 0
Fatalities: 1
Persons involved in fatal accidents: 2
Pedestrians involved in fatal accidents: 0
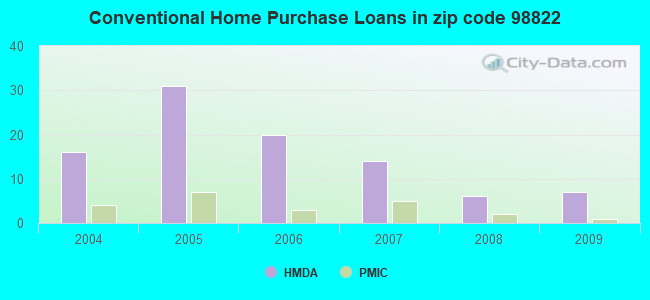
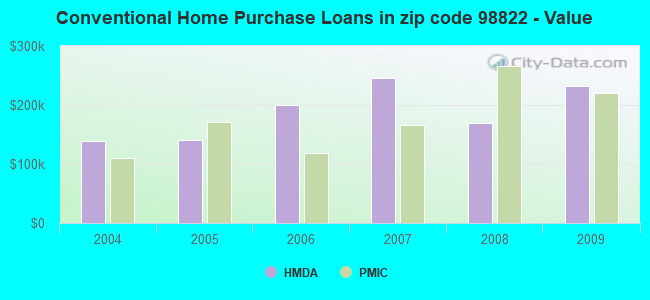
Home Mortgage Disclosure Act Aggregated Statistics For Year 2009 (Based on 2 partial tracts)
A) FHA, FSA/RHS & VA Home Purchase Loans
B) Conventional Home Purchase Loans
C) Refinancings
D) Home Improvement Loans
F) Non-occupant Loans on < 5 Family Dwellings (A B C & D)
G) Loans On Manufactured Home Dwelling (A B C & D)
Number
Average Value
Number
Average Value
Number
Average Value
Number
Average Value
Number
Average Value
Number
Average Value
LOANS ORIGINATED
6
$172,022
7
$231,917
39
$172,298
3
$179,287
7
$237,091
10
$146,623
APPLICATIONS APPROVED, NOT ACCEPTED
0
$0
1
$198,320
4
$176,065
0
$0
1
$214,900
1
$49,120
APPLICATIONS DENIED
0
$0
2
$160,870
18
$157,048
0
$0
3
$256,243
8
$101,310
APPLICATIONS WITHDRAWN
1
$262,180
1
$518,830
7
$179,200
1
$103,150
1
$758,900
4
$137,998
FILES CLOSED FOR INCOMPLETENESS
0
$0
0
$0
4
$215,360
0
$0
0
$0
2
$167,315
Aggregated Statistics For Year 2008 (Based on 2 partial tracts)
A) FHA, FSA/RHS & VA Home Purchase Loans
B) Conventional Home Purchase Loans
C) Refinancings
D) Home Improvement Loans
F) Non-occupant Loans on < 5 Family Dwellings (A B C & D)
G) Loans On Manufactured Home Dwelling (A B C & D)
Number
Average Value
Number
Average Value
Number
Average Value
Number
Average Value
Number
Average Value
Number
Average Value
LOANS ORIGINATED
4
$157,185
6
$168,952
20
$206,488
9
$116,319
10
$183,095
10
$168,175
APPLICATIONS APPROVED, NOT ACCEPTED
1
$128,330
1
$122,800
4
$214,592
0
$0
1
$127,710
1
$128,330
APPLICATIONS DENIED
2
$182,665
1
$284,900
9
$203,643
1
$90,870
1
$445,760
5
$112,362
APPLICATIONS WITHDRAWN
1
$204,460
1
$118,500
6
$248,363
1
$150,430
1
$353,050
2
$155,650
FILES CLOSED FOR INCOMPLETENESS
0
$0
0
$0
1
$170,690
1
$30,700
1
$30,700
0
$0
Aggregated Statistics For Year 2007 (Based on 2 partial tracts)
A) FHA, FSA/RHS & VA Home Purchase Loans
B) Conventional Home Purchase Loans
C) Refinancings
D) Home Improvement Loans
F) Non-occupant Loans on < 5 Family Dwellings (A B C & D)
G) Loans On Manufactured Home Dwelling (A B C & D)
Number
Average Value
Number
Average Value
Number
Average Value
Number
Average Value
Number
Average Value
Number
Average Value
LOANS ORIGINATED
2
$171,305
14
$246,609
32
$171,287
6
$107,040
6
$234,957
13
$117,463
APPLICATIONS APPROVED, NOT ACCEPTED
1
$167,010
2
$141,220
3
$150,840
1
$71,840
0
$0
4
$132,930
APPLICATIONS DENIED
1
$96,400
8
$146,746
14
$163,763
4
$109,138
1
$136,920
11
$124,084
APPLICATIONS WITHDRAWN
1
$73,680
1
$419,360
10
$146,255
1
$43,590
0
$0
2
$133,850
FILES CLOSED FOR INCOMPLETENESS
0
$0
0
$0
2
$244,985
0
$0
0
$0
0
$0
Aggregated Statistics For Year 2006 (Based on 2 partial tracts)
A) FHA, FSA/RHS & VA Home Purchase Loans
B) Conventional Home Purchase Loans
C) Refinancings
D) Home Improvement Loans
F) Non-occupant Loans on < 5 Family Dwellings (A B C & D)
G) Loans On Manufactured Home Dwelling (A B C & D)
Number
Average Value
Number
Average Value
Number
Average Value
Number
Average Value
Number
Average Value
Number
Average Value
LOANS ORIGINATED
4
$167,162
20
$200,840
28
$173,959
10
$79,759
12
$310,684
15
$92,673
APPLICATIONS APPROVED, NOT ACCEPTED
0
$0
2
$164,550
6
$104,175
2
$26,400
1
$46,660
1
$73,680
APPLICATIONS DENIED
0
$0
4
$334,170
23
$142,421
7
$81,487
2
$171,305
12
$110,622
APPLICATIONS WITHDRAWN
1
$84,120
1
$491,200
10
$163,754
1
$73,680
0
$0
1
$105,610
FILES CLOSED FOR INCOMPLETENESS
1
$84,730
1
$74,290
3
$137,330
0
$0
0
$0
2
$105,300
Aggregated Statistics For Year 2005 (Based on 2 partial tracts)
A) FHA, FSA/RHS & VA Home Purchase Loans
B) Conventional Home Purchase Loans
C) Refinancings
D) Home Improvement Loans
F) Non-occupant Loans on < 5 Family Dwellings (A B C & D)
G) Loans On Manufactured Home Dwelling (A B C & D)
Number
Average Value
Number
Average Value
Number
Average Value
Number
Average Value
Number
Average Value
Number
Average Value
LOANS ORIGINATED
4
$104,228
31
$140,824
26
$120,604
3
$59,353
9
$177,582
17
$85,852
APPLICATIONS APPROVED, NOT ACCEPTED
0
$0
2
$148,590
1
$54,030
1
$28,860
0
$0
1
$54,030
APPLICATIONS DENIED
1
$155,960
9
$86,642
19
$133,917
5
$94,556
2
$302,700
10
$107,511
APPLICATIONS WITHDRAWN
2
$103,150
4
$101,618
10
$135,694
2
$101,005
1
$39,300
6
$94,045
FILES CLOSED FOR INCOMPLETENESS
1
$78,590
1
$101,310
5
$125,256
0
$0
0
$0
1
$78,590
Aggregated Statistics For Year 2004 (Based on 2 partial tracts)
A) FHA, FSA/RHS & VA Home Purchase Loans
B) Conventional Home Purchase Loans
C) Refinancings
D) Home Improvement Loans
F) Non-occupant Loans on < 5 Family Dwellings (A B C & D)
G) Loans On Manufactured Home Dwelling (A B C & D)
Detailed PMIC statistics for the following Tracts:9601.00
2002 - 2018 National Fire Incident Reporting System (NFIRS) incidents
According to the data from the years 2002 - 2018 the average number of fire incidents per year is 8. The highest number of reported fire incidents - 41 took place in 2018, and the least - 0 in 2006. The data has a growing trend.
When looking into fire subcategories, the most incidents belonged to: Outside Fires (61.5%), and Structure Fires (22.4%).
Fire incident types reported to NFIRS in Zip Code 98822


+$1,632
-$6,197
 Nearest zip codes: 98816, 98811, 98826, 98852, 98821, 98836.


 : $95,205 in 8 contracts from 2003 to 2006


 According to the data from the years 2002 - 2018 the average number of fire incidents per year is 8. The highest number of reported fire incidents - 41 took place in 2018, and the least - 0 in 2006. The data has a growing trend.
 When looking into fire subcategories, the most incidents belonged to: Outside Fires (61.5%), and Structure Fires (22.4%).