Estimated zip code population in 2022: 2,271 Zip code population in 2010: 1,817 Zip code population in 2000: 1,556
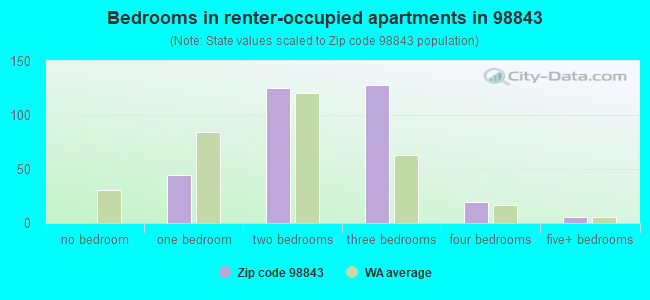
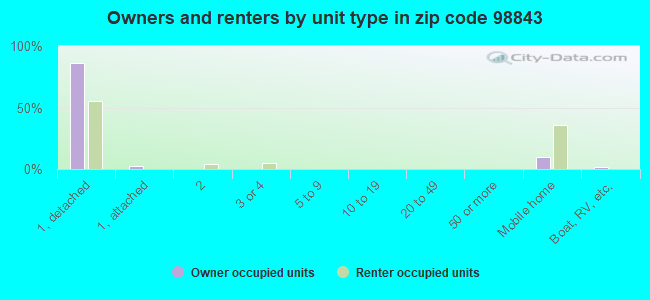
Houses and condos: 1,450 Renter-occupied apartments: 328
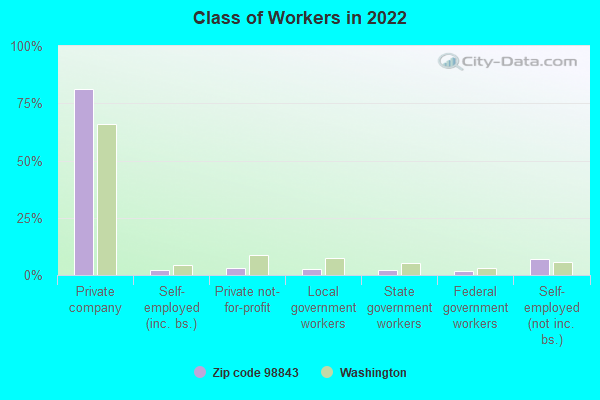
% of renters here:
39%
State:
36%
March 2022 cost of living index in zip code 98843: 92.3 (less than average, U.S. average is 100)
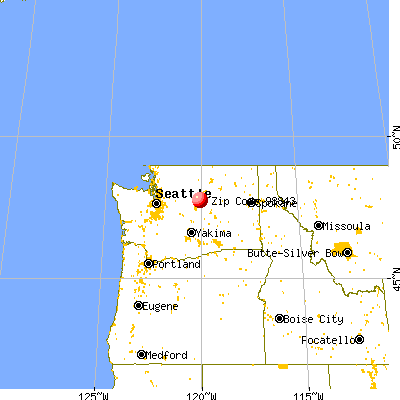
Land area: 65.5 sq. mi. Water area: 4.9 sq. mi.
Population density: 35 people per square mile
(very low).
OSM Map
General Map
Google Map
MSN Map
OSM Map
General Map
Google Map
MSN Map
OSM Map
General Map
Google Map
MSN Map
OSM Map
General Map
Google Map
MSN Map
Please wait while loading the map...
Real estate property taxes paid for housing units in 2022:
This zip code:
0.6% ($3,669)
Washington:
0.8% ($4,283)
Median real estate property taxes paid for housing units with mortgages in 2022: $4,813 (0.5%) Median real estate property taxes paid for housing units with no mortgage in 2022: $2,767 (0.7%)
Business Search- 14 Million verified businesses
Males: 1,351
(59.5%)
Females: 920
(40.5%)
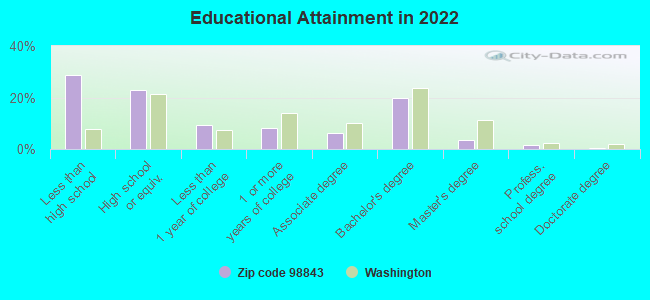
For population 25 years and over in 98843:
High school or higher: 69.5%
Bachelor's degree or higher: 24.6%
Graduate or professional degree: 5.2%
Unemployed: 2.4%
Mean travel time to work (commute): 18.5 minutes
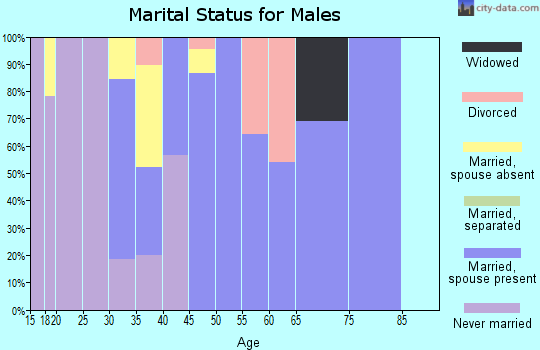
For population 15 years and over in 98843:
Never married: 33.9%
Now married: 49.0%
Separated: 3.5%
Widowed: 8.8%
Divorced: 4.8%
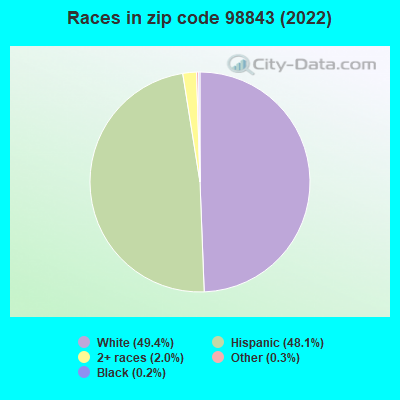
Zip code 98843 compared to state average:
Black race population percentage significantly below state average.
Hispanic race population percentage significantly above state average.
Foreign-born population percentage above state average.
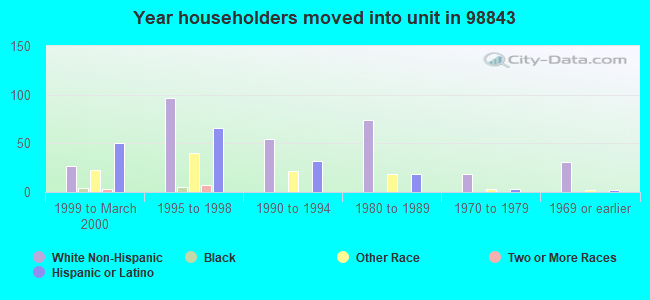
Length of stay since moving in significantly above state average.
Estimated median house/condo value in 2022: $600,297
98843:
$600,297
Washington:
$569,500
Median resident age:
This zip code:
40.5 years
Washington median age:
38.4 years
Average household size:
This zip code:
2.4 people
Washington:
2.5 people
Averages for the 2020 tax year for zip code 98843, filed in 2021:
Average Adjusted Gross Income (AGI) in 2020: $74,588 (Individual Income Tax Returns)
Here:
$74,588
State:
$99,264
Salary/wage: $53,422 (reported on 86.0% of returns)
Here:
$53,422
State:
$80,347
(% of AGI for various income ranges: 2297.3% for AGIs below $25k, 4134.2% for AGIs $25k-50k, 7802.5% for AGIs $50k-75k, 9505.0% for AGIs $75k-100k, 13706.2% for AGIs $100k-200k)
Taxable interest for individuals: $1,874 (reported on 29.0% of returns)
This zip code:
$1,874
Washington:
$2,077
(% of AGI for various income ranges: 12.7% for AGIs below $25k, 61.6% for AGIs $25k-50k, 20.0% for AGIs $50k-75k, 140.0% for AGIs $75k-100k, 181.2% for AGIs $100k-200k)
Ordinary dividends: $4,283 (reported on 16.8% of returns)
Here:
$4,283
State:
$10,013
(% of AGI for various income ranges: 16.8% for AGIs below $25k, 41.6% for AGIs $25k-50k, 195.0% for AGIs $75k-100k, 330.0% for AGIs $100k-200k)
Net capital gain/loss in AGI: +$47,817 (reported on 16.8% of returns)
Here:
+$47,817
State:
+$40,092
(% of AGI for various income ranges: 16.8% for AGIs below $25k, 13.8% for AGIs $50k-75k, 797.5% for AGIs $100k-200k)
Profit/loss from business: +$10,443 (reported on 6.5% of returns)
Here:
+$10,443
State:
+$18,312
(% of AGI for various income ranges: 105.8% for AGIs $25k-50k, 662.5% for AGIs $100k-200k)
Taxable individual retirement arrangement distribution: $23,944 (reported on 8.4% of returns)
98843:
$23,944
Washington:
$24,221
(% of AGI for various income ranges: 827.5% for AGIs $50k-75k, 1866.3% for AGIs $100k-200k)
Total itemized deductions: $32,850 (reported on 9.3% of returns)
Here:
$32,850
State:
$39,068
(% of AGI for various income ranges: 755.0% for AGIs $50k-75k, 1488.8% for AGIs $100k-200k)
Charity contributions: $8,486 (reported on 6.5% of returns)
Here:
$8,486
State:
$15,331
(% of AGI for various income ranges: 200.0% for AGIs $100k-200k)
Taxes paid: $8,244 (reported on 8.4% of returns)
98843:
$8,244
State:
$7,774
(% of AGI for various income ranges: 136.2% for AGIs $50k-75k, 380.0% for AGIs $100k-200k)
Earned income credit: $1,808 (reported on 11.2% of returns)
Here:
$1,808
State:
$2,020
(% of AGI for various income ranges: 59.1% for AGIs below $25k, 45.8% for AGIs $25k-50k)
Percentage of individuals using paid preparers for their 2020 taxes: 88.8%
Here:
89%
State:
93%
(% for various income ranges: 84.2% for AGIs below $25k, 88.9% for AGIs $25k-50k, 92.3% for AGIs $50k-75k, 87.5% for AGIs $75k-100k, 92.9% for AGIs $100k-200k, 100.0% for AGIs over 200k)
Averages for the 2012 tax year for zip code 98843, filed in 2013:
Average Adjusted Gross Income (AGI) in 2012: $57,922 (Individual Income Tax Returns)
Here:
$57,922
State:
$69,533
Salary/wage: $35,814 (reported on 91.0% of returns)
Here:
$35,814
State:
$57,267
(% of AGI for various income ranges: 91.3% for AGIs below $25k, 84.0% for AGIs $25k-50k, 76.1% for AGIs $50k-75k, 55.8% for AGIs $75k-100k, 90.5% for AGIs $100k-200k)
Taxable interest for individuals: $1,630 (reported on 25.6% of returns)
This zip code:
$1,630
Washington:
$1,816
(% of AGI for various income ranges: 0.5% for AGIs $25k-50k, 0.5% for AGIs $50k-75k, 0.9% for AGIs $75k-100k, 2.3% for AGIs $100k-200k)
Ordinary dividends: $7,738 (reported on 10.3% of returns)
Here:
$7,738
State:
$8,163
(% of AGI for various income ranges: 0.9% for AGIs below $25k, 3.1% for AGIs $50k-75k, 4.4% for AGIs $100k-200k)
Net capital gain/loss in AGI: +$9,512 (reported on 10.3% of returns)
Here:
+$9,512
State:
+$21,568
Profit/loss from business: +$6,560 (reported on 6.4% of returns)
Here:
+$6,560
State:
+$16,521
Taxable individual retirement arrangement distribution: $21,100 (reported on 5.1% of returns)
98843:
$21,100
Washington:
$18,648
Total itemized deductions: $23,740 (21% of AGI, reported on 19.2% of returns)
Here:
$23,740
State:
$23,872
Here:
20.9% of AGI
State:
18.2% of AGI
(% of AGI for various income ranges: 6.8% for AGIs $25k-50k, 13.3% for AGIs $50k-75k, 13.6% for AGIs $75k-100k, 19.1% for AGIs $100k-200k)
Charity contributions: $2,700 (reported on 12.8% of returns)
Here:
$2,700
State:
$4,465
(% of AGI for various income ranges: 0.9% for AGIs $25k-50k, 1.2% for AGIs $75k-100k, 1.6% for AGIs $100k-200k)
Taxes paid: $6,247 (reported on 19.2% of returns)
98843:
$6,247
State:
$6,400
(% of AGI for various income ranges: 1.7% for AGIs $25k-50k, 3.0% for AGIs $50k-75k, 3.9% for AGIs $75k-100k, 5.2% for AGIs $100k-200k)
Earned income credit: $2,283 (reported on 15.4% of returns)
Here:
$2,283
State:
$2,073
(% of AGI for various income ranges: 3.3% for AGIs below $25k, 1.5% for AGIs $25k-50k)
Percentage of individuals using paid preparers for their 2012 taxes: 60.3%
Here:
60%
State:
43%
(% for various income ranges: 52.9% for AGIs below $25k, 63.6% for AGIs $25k-50k, 62.5% for AGIs $50k-75k, 60.0% for AGIs $75k-100k, 71.4% for AGIs $100k-200k, 100.0% for AGIs over 200k)
Averages for the 2004 tax year for zip code 98843, filed in 2005:
Average Adjusted Gross Income (AGI) in 2004: $42,609 (Individual Income Tax Returns)
Here:
$42,609
State:
$54,331
Salary/wage: $31,984 (reported on 88.6% of returns)
Here:
$31,984
State:
$45,761
(% of AGI for various income ranges: 304.9% for AGIs below $10k, 93.1% for AGIs $10k-25k, 81.5% for AGIs $25k-50k, 70.8% for AGIs $50k-75k, 64.1% for AGIs $75k-100k, 40.8% for AGIs over 100k)
Taxable interest for individuals: $1,908 (reported on 42.0% of returns)
This zip code:
$1,908
Washington:
$2,110
(% of AGI for various income ranges: 3.8% for AGIs below $10k, 1.4% for AGIs $10k-25k, 1.9% for AGIs $25k-50k, 1.2% for AGIs $50k-75k, 2.6% for AGIs $75k-100k, 2.0% for AGIs over 100k)
Taxable dividends: $1,988 (reported on 16.2% of returns)
Here:
$1,988
State:
$5,879
(% of AGI for various income ranges: 0.5% for AGIs below $10k, 0.9% for AGIs $10k-25k, 0.7% for AGIs $25k-50k, 0.3% for AGIs $50k-75k, 2.4% for AGIs $75k-100k, 0.4% for AGIs over 100k)
Net capital gain/loss: +$2,635 (reported on 15.0% of returns)
Here:
+$2,635
State:
+$15,835
(% of AGI for various income ranges: -7.0% for AGIs below $10k, 1.1% for AGIs $25k-50k, 1.1% for AGIs $50k-75k, 1.2% for AGIs $75k-100k, 1.2% for AGIs over 100k)
Profit/loss from business: +$13,667 (reported on 7.9% of returns)
Here:
+$13,667
State:
+$13,994
Profit/loss from farming: +$810 (reported on 4.3% of returns)
Here:
+$810
State:
-$6,197
IRA payment deduction: $3,667 (reported on 4.3% of returns)
98843:
$3,667
Washington:
$3,001
Total itemized deductions: $18,444 (25% of AGI, reported on 20.1% of returns)
Here:
$18,444
State:
$19,669
Here:
25.2% of AGI
State:
20.7% of AGI
(% of AGI for various income ranges: 8.9% for AGIs $10k-25k, 6.4% for AGIs $25k-50k, 11.2% for AGIs $50k-75k, 13.8% for AGIs $75k-100k, 7.3% for AGIs over 100k)
Charity contributions deductions: $2,012 (3% of AGI, reported on 17.2% of returns)
Here:
$2,012
State:
$3,569
Here:
2.8% of AGI
State:
3.5% of AGI
(% of AGI for various income ranges: 19.5% for AGIs below $10k, 0.7% for AGIs $25k-50k, 0.7% for AGIs $50k-75k, 1.6% for AGIs $75k-100k, 0.5% for AGIs over 100k)
Total tax: $8,802 (reported on 57.4% of returns)
98843:
$8,802
State:
$9,065
(% of AGI for various income ranges: 3.2% for AGIs below $10k, 2.1% for AGIs $10k-25k, 4.1% for AGIs $25k-50k, 8.8% for AGIs $50k-75k, 10.4% for AGIs $75k-100k, 22.3% for AGIs over 100k)
Earned income credit: $2,017 (reported on 23.9% of returns)
Here:
$2,017
State:
$1,607
Percentage of individuals using paid preparers for their 2004 taxes: 51.3%
Here:
51%
State:
49%
(% for various income ranges: 45.2% for AGIs below $10k, 39.8% for AGIs $10k-25k, 58.9% for AGIs $25k-50k, 58.8% for AGIs $50k-75k, 59.4% for AGIs $75k-100k, 72.2% for AGIs over 100k)
Household received Food Stamps/SNAP in the past 12 months: 86 Household did not receive Food Stamps/SNAP in the past 12 months: 746
Women who had a birth in the past 12 months: 3 (4 now married, 0 unmarried) Women who did not have a birth in the past 12 months: 359 (182 now married, 177 unmarried)
Housing units in zip code 98843 with a mortgage: 311 (14 second mortgage, 15 both second mortgage and home equity loan) Houses without a mortgage: 14
Median monthly owner costs for units with a mortgage: $2,184 Median monthly owner costs for units without a mortgage: $461
Residents with income below the poverty level in 2022:
This zip code:
17.0%
Whole state:
10.0%
Residents with income below 50% of the poverty level in 2022:
This zip code:
10.8%
Whole state:
4.6%
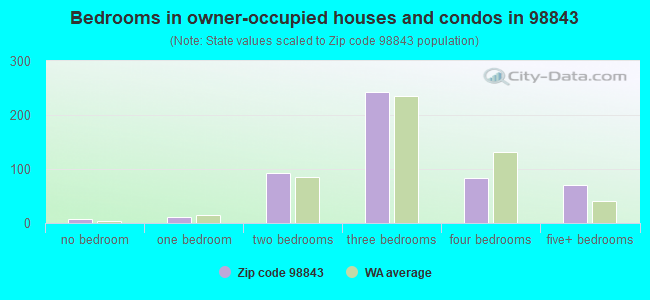
Median number of rooms in houses and condos:
Here:
6.3
State:
6.5
Median number of rooms in apartments:
Here:
3.9
State:
3.9
Notable locations in this zip code not listed on our city pages
In group quarters: 269 (-1 institutionalized population)
Size of family households: 312 2-persons, 100 3-persons, 97 4-persons, 45 5-persons, 13 6-persons, 10 7-or-more-persons
Size of nonfamily households: 239 1-person, 12 2-persons
175 married couples with children.
122 single-parent households (52 men, 70 women).
51.4% of residents of 98843 zip code speak English at home.
51.0% of residents speak Spanish at home (29% very well, 11% well, 13% not well, 48% not at all).
1.8% of residents speak other Indo-European language at home (100% very well).
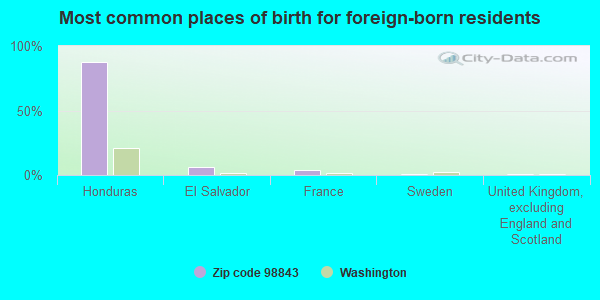
Foreign born population: 738 (32.5%) (17.2% of them are naturalized citizens)
This zip code:
32.5%
Whole state:
15.3%
87%Honduras
6%El Salvador
4%France
1%Sweden
1%United Kingdom, excluding England and Scotland
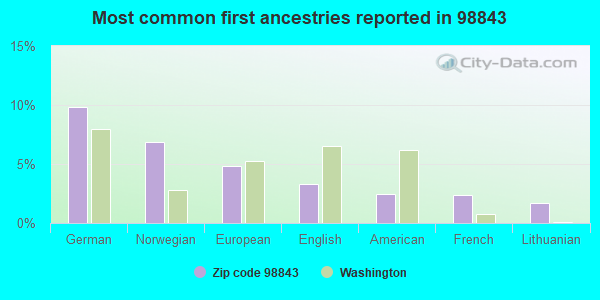
10%German
7%Norwegian
5%European
3%English
2%American
2%French
2%Lithuanian
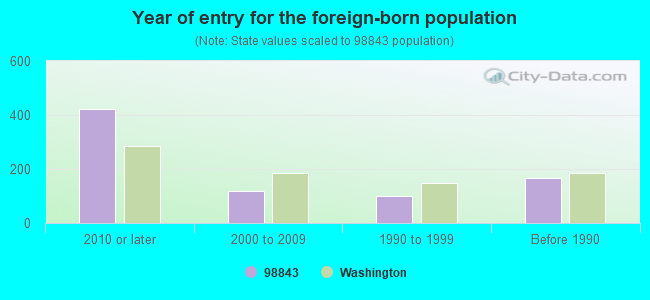
Year of entry for the foreign-born population
4222010 or later
1182000 to 2009
1011990 to 1999
167Before 1990
Public elementary/middle school in in zip code 98843 not listed on the city page:
Facilities with environmental interests located in this zip code:
CENTRAL WA CONCRETE ORONDO OPERAT (14060 SR 2 in ORONDO, WA)
National Pollutant Discharge Elimination System NON-MAJOR (Tracking pollutant discharge elimination systems) - permit STATE MASTER (Washington State Department of Ecology's Facility/Site identification system) - WATQUAL-WAG505036, National Pollutant Discharge Elimination System Permit Business SIC classification: CRUSHED AND BROKEN STONE; CONSTRUCTION SAND AND GRAVEL; ASPHALT PAVING MIXTURES AND BLOCKS; READY-MIXED CONCRETE Organizations: CENTRAL WASHINGTON CONCRETE (CONTACT/OPERATOR)
Alternative names: CENTRAL WA CONCRETE -, CENTRAL WA CONCRETE - ORONDO O
Housing units lacking complete plumbing facilities: 4.8% Housing units lacking complete kitchen facilities: 5.9%
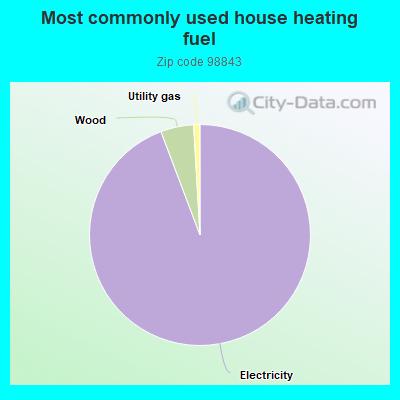
93.7%Electricity
4.8%Wood
0.9%Utility gas
Population in 1990: 1,424. Population change in the 1990s: +132 (+9.3%).
Place of birth for U.S.-born residents:
This state: 838
Northeast: 90
Midwest: 183
South: 118
West: 271
63% of the 98843 zip code residents lived in the same house 5 years ago. Out of people who lived in different houses, 46% lived in this county. Out of people who lived in different counties, 50% lived in Washington.
94% of the 98843 zip code residents lived in the same house 1 year ago. Out of people who lived in different houses, 29% moved from this county. Out of people who lived in different houses, 74% moved from different county within same state. Out of people who lived in different houses, 6% moved from different state.
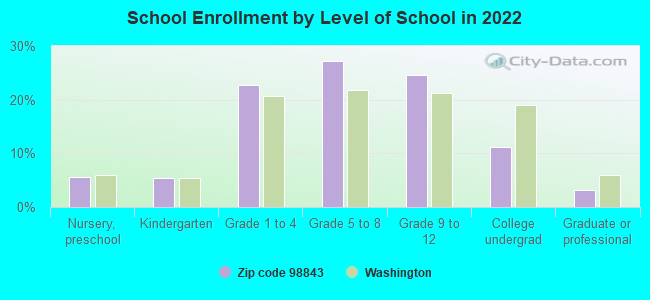
Private vs. public school enrollment:
Students in private schools in grades 1 to 8 (elementary and middle school): 22
Here:
13.3%
Washington:
12.4%
Students in private schools in grades 9 to 12 (high school):
Here:
0.0%
Washington:
9.2%
Students in private undergraduate colleges:
Here:
0.0%
Washington:
16.5%
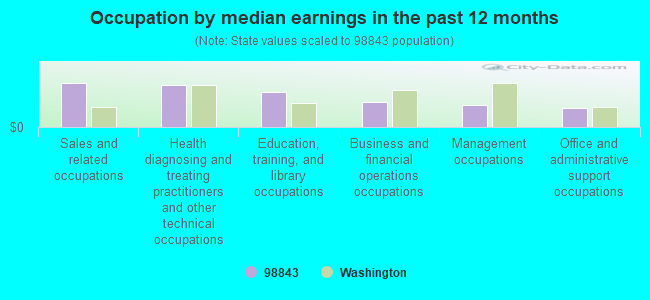
Occupation by median earnings in the past 12 months ($)
103,028Sales and related occupations
98,000Health diagnosing and treating practitioners and other technical occupations
83,212Education, training, and library occupations
57,891Business and financial operations occupations
51,118Management occupations
45,669Office and administrative support occupations
Top industries in this zip code by the number of employees in 2005:
Wholesale Trade: Fresh Fruit and Vegetable Merchant Wholesalers (50-99 employees: 1 establishment)
Arts, Entertainment, and Recreation: Golf Courses and Country Clubs (10-19: 1)
Construction: New Single-Family Housing Construction (except Operative Builders) (5-9: 1, 1-4: 1)
Construction: Framing Contractors (5-9: 1)
Finance and Insurance: Commercial Banking (5-9: 1)
Construction: Residential Remodelers (5-9: 1)
People in group quarters in 2010:
20 people in workers' group living quarters and job corps centers
People in group quarters in 2000:
16 people in unknown juvenile institutions
13 people in agriculture workers' dormitories on farms
Fatal accident statistics in 2012:
Fatal accident count: 2
Vehicles involved in fatal accidents: 2
Fatal accidents caused by drunken drivers: 0
Fatalities: 2
Persons involved in fatal accidents: 3
Pedestrians involved in fatal accidents: 0
Fatal accident statistics in 2011:
Fatal accident count: 1
Vehicles involved in fatal accidents: 2
Fatal accidents caused by drunken drivers: 0
Fatalities: 2
Persons involved in fatal accidents: 3
Pedestrians involved in fatal accidents: 0
Home Mortgage Disclosure Act Aggregated Statistics For Year 2009 (Based on 2 partial tracts)
A) FHA, FSA/RHS & VA Home Purchase Loans
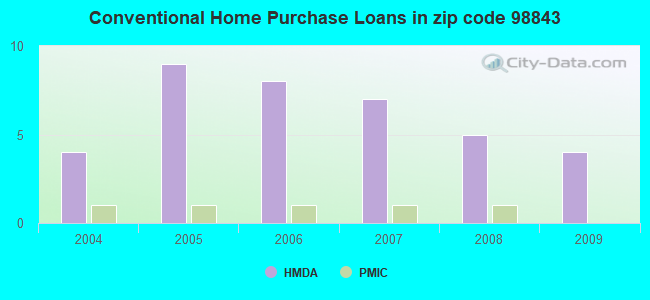
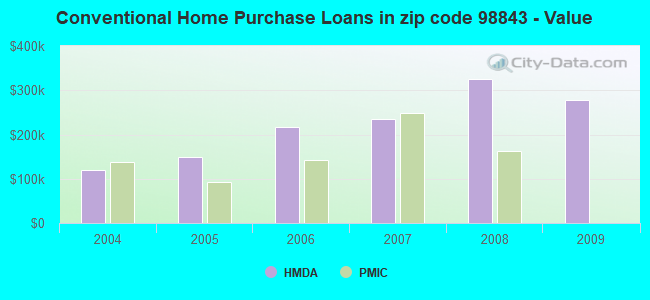
B) Conventional Home Purchase Loans
C) Refinancings
D) Home Improvement Loans
F) Non-occupant Loans on < 5 Family Dwellings (A B C & D)
G) Loans On Manufactured Home Dwelling (A B C & D)
Number
Average Value
Number
Average Value
Number
Average Value
Number
Average Value
Number
Average Value
Number
Average Value
LOANS ORIGINATED
1
$210,950
4
$276,938
18
$243,818
1
$71,340
11
$289,276
2
$169,185
APPLICATIONS APPROVED, NOT ACCEPTED
0
$0
0
$0
1
$270,700
0
$0
1
$158,400
0
$0
APPLICATIONS DENIED
0
$0
1
$241,630
6
$239,162
1
$151,940
2
$358,340
1
$137,260
APPLICATIONS WITHDRAWN
0
$0
1
$325,900
3
$230,230
0
$0
1
$332,800
0
$0
FILES CLOSED FOR INCOMPLETENESS
0
$0
0
$0
0
$0
0
$0
0
$0
0
$0
Aggregated Statistics For Year 2008 (Based on 2 partial tracts)
A) FHA, FSA/RHS & VA Home Purchase Loans
B) Conventional Home Purchase Loans
C) Refinancings
D) Home Improvement Loans
F) Non-occupant Loans on < 5 Family Dwellings (A B C & D)
G) Loans On Manufactured Home Dwelling (A B C & D)
Number
Average Value
Number
Average Value
Number
Average Value
Number
Average Value
Number
Average Value
Number
Average Value
LOANS ORIGINATED
1
$95,420
5
$325,690
8
$284,571
1
$108,780
8
$326,281
1
$197,590
APPLICATIONS APPROVED, NOT ACCEPTED
0
$0
1
$101,880
2
$216,090
0
$0
1
$260,280
1
$66,500
APPLICATIONS DENIED
0
$0
1
$151,200
4
$174,985
1
$162,950
1
$319,290
1
$97,920
APPLICATIONS WITHDRAWN
0
$0
1
$437,760
2
$145,480
0
$0
0
$0
1
$90,280
FILES CLOSED FOR INCOMPLETENESS
0
$0
0
$0
0
$0
0
$0
0
$0
0
$0
Aggregated Statistics For Year 2007 (Based on 2 partial tracts)
B) Conventional Home Purchase Loans
C) Refinancings
D) Home Improvement Loans
F) Non-occupant Loans on < 5 Family Dwellings (A B C & D)
G) Loans On Manufactured Home Dwelling (A B C & D)
Number
Average Value
Number
Average Value
Number
Average Value
Number
Average Value
Number
Average Value
LOANS ORIGINATED
7
$234,817
9
$269,966
1
$139,900
7
$364,064
2
$152,600
APPLICATIONS APPROVED, NOT ACCEPTED
1
$528,330
1
$219,030
0
$0
0
$0
0
$0
APPLICATIONS DENIED
2
$177,115
6
$430,050
2
$75,380
1
$438,640
1
$141,520
APPLICATIONS WITHDRAWN
0
$0
2
$328,465
0
$0
1
$532,590
0
$0
FILES CLOSED FOR INCOMPLETENESS
0
$0
0
$0
0
$0
0
$0
0
$0
Aggregated Statistics For Year 2006 (Based on 2 partial tracts)
B) Conventional Home Purchase Loans
C) Refinancings
D) Home Improvement Loans
F) Non-occupant Loans on < 5 Family Dwellings (A B C & D)
G) Loans On Manufactured Home Dwelling (A B C & D)
Number
Average Value
Number
Average Value
Number
Average Value
Number
Average Value
Number
Average Value
LOANS ORIGINATED
8
$215,851
7
$171,211
1
$133,440
8
$250,331
1
$127,570
APPLICATIONS APPROVED, NOT ACCEPTED
0
$0
1
$191,870
0
$0
1
$191,570
0
$0
APPLICATIONS DENIED
2
$125,880
6
$174,130
1
$40,080
1
$315,910
1
$136,080
APPLICATIONS WITHDRAWN
1
$154,290
3
$159,327
0
$0
1
$175,570
0
$0
FILES CLOSED FOR INCOMPLETENESS
0
$0
1
$189,670
0
$0
0
$0
0
$0
Aggregated Statistics For Year 2005 (Based on 2 partial tracts)
B) Conventional Home Purchase Loans
C) Refinancings
D) Home Improvement Loans
F) Non-occupant Loans on < 5 Family Dwellings (A B C & D)
G) Loans On Manufactured Home Dwelling (A B C & D)
Number
Average Value
Number
Average Value
Number
Average Value
Number
Average Value
Number
Average Value
LOANS ORIGINATED
9
$149,867
10
$131,283
1
$22,750
7
$160,306
4
$92,960
APPLICATIONS APPROVED, NOT ACCEPTED
1
$129,480
2
$105,990
0
$0
1
$178,800
1
$80,890
APPLICATIONS DENIED
4
$159,865
6
$105,060
2
$92,705
1
$215,210
3
$100,557
APPLICATIONS WITHDRAWN
1
$133,150
3
$143,277
1
$44,770
1
$107,160
1
$48,000
FILES CLOSED FOR INCOMPLETENESS
0
$0
1
$247,360
0
$0
0
$0
0
$0
Aggregated Statistics For Year 2004 (Based on 2 partial tracts)
A) FHA, FSA/RHS & VA Home Purchase Loans
B) Conventional Home Purchase Loans
C) Refinancings
D) Home Improvement Loans
F) Non-occupant Loans on < 5 Family Dwellings (A B C & D)
G) Loans On Manufactured Home Dwelling (A B C & D)
Detailed PMIC statistics for the following Tracts:9501.00
2004 - 2018 National Fire Incident Reporting System (NFIRS) incidents
Based on the data from the years 2004 - 2018 the average number of fires per year is 24. The highest number of reported fires - 58 took place in 2018, and the least - 0 in 2005. The data has a rising trend.
When looking into fire subcategories, the most reports belonged to: Outside Fires (70.1%), and Structure Fires (18.9%).
Fire incident types reported to NFIRS in Zip Code 98843


+$810
-$6,197
 Nearest zip codes: 98817, 98858, 98831, 98846, 98802, 98811.


 (Location: 100 ORONDO SCHOOL ROAD, Grades: PK-7)

 Based on the data from the years 2004 - 2018 the average number of fires per year is 24. The highest number of reported fires - 58 took place in 2018, and the least - 0 in 2005. The data has a rising trend.
 When looking into fire subcategories, the most reports belonged to: Outside Fires (70.1%), and Structure Fires (18.9%).