Estimated zip code population in 2022: 6,237 Zip code population in 2010: 5,240 Zip code population in 2000: 5,167
Houses and condos: 3,117 Renter-occupied apartments: 621
% of renters here:
23%
State:
36%
March 2022 cost of living index in zip code 99141: 88.2 (less than average, U.S. average is 100)
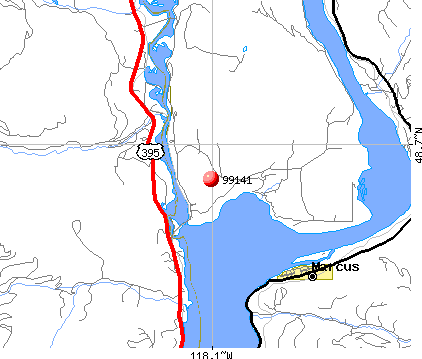
Land area: 529.8 sq. mi. Water area: 27.2 sq. mi.
Population density: 12 people per square mile
(very low).
OSM Map
General Map
Google Map
MSN Map
OSM Map
General Map
Google Map
MSN Map
OSM Map
General Map
Google Map
MSN Map
OSM Map
General Map
Google Map
MSN Map
Please wait while loading the map...
Real estate property taxes paid for housing units in 2022:
This zip code:
0.5% ($1,633)
Washington:
0.8% ($4,283)
Median real estate property taxes paid for housing units with mortgages in 2022: $1,621 (0.5%) Median real estate property taxes paid for housing units with no mortgage in 2022: $1,655 (0.6%)
Business Search- 14 Million verified businesses
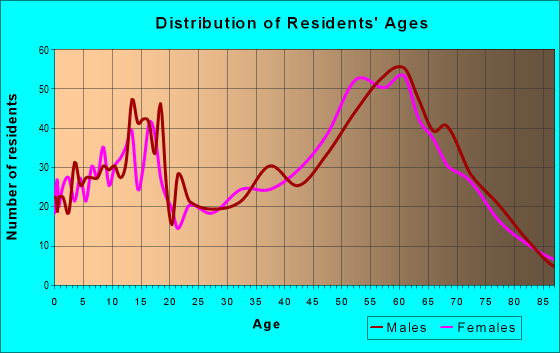
Males: 3,107
(49.8%)
Females: 3,130
(50.2%)
For population 25 years and over in 99141:
High school or higher: 90.7%
Bachelor's degree or higher: 19.9%
Graduate or professional degree: 5.8%
Unemployed: 2.2%
Mean travel time to work (commute): 20.9 minutes
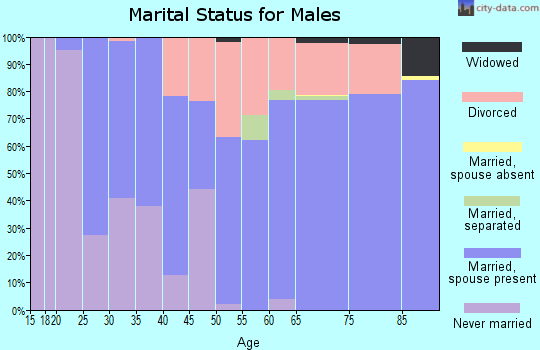
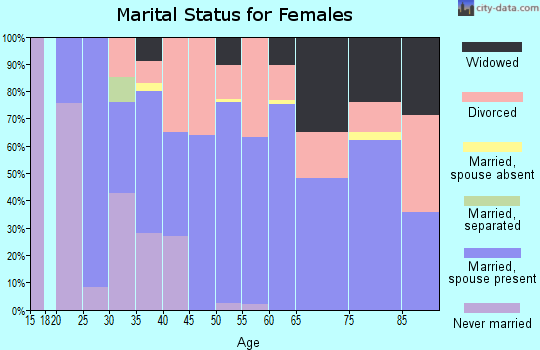
For population 15 years and over in 99141:
Never married: 20.2%
Now married: 54.6%
Separated: 1.2%
Widowed: 7.9%
Divorced: 16.1%
Zip code 99141 compared to state average:
Median household income below state average.
Median house value below state average.
Unemployed percentage below state average.
Black race population percentage significantly below state average.
Hispanic race population percentage below state average.
Median age significantly above state average.
Foreign-born population percentage significantly below state average.
Renting percentage below state average.
Length of stay since moving in above state average.
Percentage of population with a bachelor's degree or higher below state average.
Estimated median house/condo value in 2022: $303,998
99141:
$303,998
Washington:
$569,500
According to our research of Washington and other state lists, there were 2 registered sex offenders living in 99141 zip code as of April 28, 2024. The ratio of all residents to sex offenders in zip code 99141 is 2,607 to 1. The ratio of registered sex offenders to all residents in this zip code is lower than the state average.
Median resident age:
This zip code:
48.1 years
Washington median age:
38.4 years
Average household size:
This zip code:
2.3 people
Washington:
2.5 people
Averages for the 2020 tax year for zip code 99141, filed in 2021:
Average Adjusted Gross Income (AGI) in 2020: $57,733 (Individual Income Tax Returns)
Here:
$57,733
State:
$99,264
Salary/wage: $47,799 (reported on 73.8% of returns)
Here:
$47,799
State:
$80,347
(% of AGI for various income ranges: 1060.4% for AGIs below $25k, 3237.8% for AGIs $25k-50k, 5528.1% for AGIs $50k-75k, 8405.6% for AGIs $75k-100k, 14439.0% for AGIs $100k-200k)
Taxable interest for individuals: $1,480 (reported on 31.5% of returns)
This zip code:
$1,480
Washington:
$2,077
(% of AGI for various income ranges: 17.7% for AGIs below $25k, 31.5% for AGIs $25k-50k, 56.1% for AGIs $50k-75k, 55.0% for AGIs $75k-100k, 196.0% for AGIs $100k-200k)
Ordinary dividends: $4,942 (reported on 15.4% of returns)
Here:
$4,942
State:
$10,013
(% of AGI for various income ranges: 27.4% for AGIs below $25k, 64.3% for AGIs $25k-50k, 78.7% for AGIs $50k-75k, 137.5% for AGIs $75k-100k, 274.5% for AGIs $100k-200k)
Net capital gain/loss in AGI: +$13,451 (reported on 17.3% of returns)
Here:
+$13,451
State:
+$40,092
(% of AGI for various income ranges: 23.3% for AGIs below $25k, 58.7% for AGIs $25k-50k, 180.3% for AGIs $50k-75k, 309.4% for AGIs $75k-100k, 988.5% for AGIs $100k-200k)
Profit/loss from business: +$13,256 (reported on 13.8% of returns)
Here:
+$13,256
State:
+$18,312
(% of AGI for various income ranges: 88.1% for AGIs below $25k, 160.4% for AGIs $25k-50k, 199.4% for AGIs $50k-75k, 359.4% for AGIs $75k-100k, 1105.5% for AGIs $100k-200k)
Taxable individual retirement arrangement distribution: $15,519 (reported on 10.4% of returns)
99141:
$15,519
Washington:
$24,221
(% of AGI for various income ranges: 76.1% for AGIs below $25k, 96.7% for AGIs $25k-50k, 201.9% for AGIs $50k-75k, 305.6% for AGIs $75k-100k, 1059.5% for AGIs $100k-200k)
Total itemized deductions: $32,410 (reported on 3.8% of returns)
Here:
$32,410
State:
$39,068
(% of AGI for various income ranges: 430.6% for AGIs $50k-75k, 398.0% for AGIs $100k-200k)
Charity contributions: $16,557 (reported on 2.7% of returns)
Here:
$16,557
State:
$15,331
(% of AGI for various income ranges: 58.7% for AGIs $50k-75k, 146.5% for AGIs $100k-200k)
Taxes paid: $5,860 (reported on 3.8% of returns)
99141:
$5,860
State:
$7,774
(% of AGI for various income ranges: 73.2% for AGIs $50k-75k, 83.0% for AGIs $100k-200k)
Earned income credit: $2,180 (reported on 15.8% of returns)
Here:
$2,180
State:
$2,020
(% of AGI for various income ranges: 98.8% for AGIs below $25k, 61.3% for AGIs $25k-50k)
Percentage of individuals using paid preparers for their 2020 taxes: 91.5%
Here:
92%
State:
93%
(% for various income ranges: 89.2% for AGIs below $25k, 92.8% for AGIs $25k-50k, 93.2% for AGIs $50k-75k, 91.7% for AGIs $75k-100k, 91.2% for AGIs $100k-200k, 100.0% for AGIs over 200k)
Averages for the 2012 tax year for zip code 99141, filed in 2013:
Average Adjusted Gross Income (AGI) in 2012: $42,641 (Individual Income Tax Returns)
Here:
$42,641
State:
$69,533
Salary/wage: $37,068 (reported on 76.7% of returns)
Here:
$37,068
State:
$57,267
(% of AGI for various income ranges: 62.7% for AGIs below $25k, 71.2% for AGIs $25k-50k, 64.9% for AGIs $50k-75k, 71.1% for AGIs $75k-100k, 86.6% for AGIs $100k-200k)
Taxable interest for individuals: $1,957 (reported on 32.0% of returns)
This zip code:
$1,957
Washington:
$1,816
(% of AGI for various income ranges: 2.1% for AGIs below $25k, 1.4% for AGIs $25k-50k, 1.5% for AGIs $50k-75k, 1.2% for AGIs $75k-100k, 1.9% for AGIs $100k-200k)
Ordinary dividends: $3,689 (reported on 16.4% of returns)
Here:
$3,689
State:
$8,163
(% of AGI for various income ranges: 2.2% for AGIs below $25k, 1.4% for AGIs $25k-50k, 1.3% for AGIs $50k-75k, 1.4% for AGIs $75k-100k, 1.6% for AGIs $100k-200k)
Net capital gain/loss in AGI: +$5,077 (reported on 16.0% of returns)
Here:
+$5,077
State:
+$21,568
(% of AGI for various income ranges: 0.6% for AGIs below $25k, 0.6% for AGIs $25k-50k, 1.1% for AGIs $50k-75k, 0.5% for AGIs $75k-100k, 7.1% for AGIs $100k-200k)
Profit/loss from business: +$8,869 (reported on 14.6% of returns)
Here:
+$8,869
State:
+$16,521
(% of AGI for various income ranges: 7.3% for AGIs below $25k, 3.4% for AGIs $25k-50k, 3.6% for AGIs $50k-75k, 0.4% for AGIs $75k-100k, 2.6% for AGIs $100k-200k)
Taxable individual retirement arrangement distribution: $13,373 (reported on 10.0% of returns)
99141:
$13,373
Washington:
$18,648
(% of AGI for various income ranges: 3.1% for AGIs below $25k, 2.1% for AGIs $25k-50k, 3.9% for AGIs $50k-75k, 2.8% for AGIs $75k-100k, 5.0% for AGIs $100k-200k)
Total itemized deductions: $20,077 (25% of AGI, reported on 17.8% of returns)
Here:
$20,077
State:
$23,872
Here:
25.0% of AGI
State:
18.2% of AGI
(% of AGI for various income ranges: 8.9% for AGIs below $25k, 5.1% for AGIs $25k-50k, 7.3% for AGIs $50k-75k, 9.4% for AGIs $75k-100k, 15.2% for AGIs $100k-200k)
Charity contributions: $3,533 (reported on 12.3% of returns)
Here:
$3,533
State:
$4,465
(% of AGI for various income ranges: 0.7% for AGIs below $25k, 0.7% for AGIs $25k-50k, 1.1% for AGIs $50k-75k, 1.4% for AGIs $75k-100k, 1.7% for AGIs $100k-200k)
Taxes paid: $4,110 (reported on 17.8% of returns)
99141:
$4,110
State:
$6,400
(% of AGI for various income ranges: 1.3% for AGIs below $25k, 0.9% for AGIs $25k-50k, 1.5% for AGIs $50k-75k, 2.0% for AGIs $75k-100k, 3.6% for AGIs $100k-200k)
Earned income credit: $1,974 (reported on 19.6% of returns)
Here:
$1,974
State:
$2,073
(% of AGI for various income ranges: 5.1% for AGIs below $25k, 1.3% for AGIs $25k-50k)
Percentage of individuals using paid preparers for their 2012 taxes: 48.9%
Here:
49%
State:
43%
(% for various income ranges: 42.6% for AGIs below $25k, 48.2% for AGIs $25k-50k, 51.4% for AGIs $50k-75k, 61.1% for AGIs $75k-100k, 78.6% for AGIs $100k-200k)
Averages for the 2004 tax year for zip code 99141, filed in 2005:
Average Adjusted Gross Income (AGI) in 2004: $35,713 (Individual Income Tax Returns)
Here:
$35,713
State:
$54,331
Salary/wage: $31,116 (reported on 79.9% of returns)
Here:
$31,116
State:
$45,761
(% of AGI for various income ranges: 123.1% for AGIs below $10k, 68.0% for AGIs $10k-25k, 75.8% for AGIs $25k-50k, 75.7% for AGIs $50k-75k, 70.9% for AGIs $75k-100k, 46.5% for AGIs over 100k)
Taxable interest for individuals: $2,215 (reported on 41.7% of returns)
This zip code:
$2,215
Washington:
$2,110
(% of AGI for various income ranges: 8.5% for AGIs below $10k, 3.9% for AGIs $10k-25k, 2.1% for AGIs $25k-50k, 1.5% for AGIs $50k-75k, 2.2% for AGIs $75k-100k, 3.6% for AGIs over 100k)
Taxable dividends: $1,625 (reported on 18.6% of returns)
Here:
$1,625
State:
$5,879
(% of AGI for various income ranges: 4.4% for AGIs below $10k, 1.5% for AGIs $10k-25k, 0.9% for AGIs $25k-50k, 0.7% for AGIs $50k-75k, 0.3% for AGIs $75k-100k, 0.5% for AGIs over 100k)
Net capital gain/loss: +$7,584 (reported on 20.1% of returns)
Here:
+$7,584
State:
+$15,835
(% of AGI for various income ranges: -1.8% for AGIs below $10k, 0.9% for AGIs $10k-25k, 1.3% for AGIs $25k-50k, 3.3% for AGIs $50k-75k, 5.3% for AGIs $75k-100k, 12.2% for AGIs over 100k)
Profit/loss from business: +$7,113 (reported on 16.8% of returns)
Here:
+$7,113
State:
+$13,994
(% of AGI for various income ranges: 7.7% for AGIs below $10k, 4.4% for AGIs $10k-25k, 3.6% for AGIs $25k-50k, 2.3% for AGIs $50k-75k, 3.3% for AGIs $75k-100k, 3.2% for AGIs over 100k)
IRA payment deduction: $2,766 (reported on 3.0% of returns)
99141:
$2,766
Washington:
$3,001
Total itemized deductions: $16,749 (24% of AGI, reported on 19.2% of returns)
Here:
$16,749
State:
$19,669
Here:
24.5% of AGI
State:
20.7% of AGI
(% of AGI for various income ranges: 10.5% for AGIs below $10k, 8.3% for AGIs $10k-25k, 7.4% for AGIs $25k-50k, 8.7% for AGIs $50k-75k, 11.0% for AGIs $75k-100k, 10.8% for AGIs over 100k)
Charity contributions deductions: $3,852 (5% of AGI, reported on 14.1% of returns)
Here:
$3,852
State:
$3,569
Here:
5.1% of AGI
State:
3.5% of AGI
(% of AGI for various income ranges: 1.2% for AGIs $10k-25k, 0.7% for AGIs $25k-50k, 1.3% for AGIs $50k-75k, 1.7% for AGIs $75k-100k, 3.3% for AGIs over 100k)
Total tax: $3,866 (reported on 72.8% of returns)
99141:
$3,866
State:
$9,065
(% of AGI for various income ranges: 4.8% for AGIs below $10k, 3.9% for AGIs $10k-25k, 6.2% for AGIs $25k-50k, 8.6% for AGIs $50k-75k, 10.4% for AGIs $75k-100k, 10.7% for AGIs over 100k)
Earned income credit: $1,557 (reported on 18.2% of returns)
Here:
$1,557
State:
$1,607
Percentage of individuals using paid preparers for their 2004 taxes: 52.1%
Here:
52%
State:
49%
(% for various income ranges: 43.0% for AGIs below $10k, 53.0% for AGIs $10k-25k, 50.6% for AGIs $25k-50k, 56.4% for AGIs $50k-75k, 65.3% for AGIs $75k-100k, 73.7% for AGIs over 100k)
Household received Food Stamps/SNAP in the past 12 months: 442 Household did not receive Food Stamps/SNAP in the past 12 months: 2,311
Women who had a birth in the past 12 months: 41 (17 now married, 22 unmarried) Women who did not have a birth in the past 12 months: 1,228 (562 now married, 665 unmarried)
Housing units in zip code 99141 with a mortgage: 1,132 (63 second mortgage, 60 both second mortgage and home equity loan) Houses without a mortgage: 56
Median monthly owner costs for units with a mortgage: $1,393 Median monthly owner costs for units without a mortgage: $439
Residents with income below the poverty level in 2022:
This zip code:
11.3%
Whole state:
10.0%
Residents with income below 50% of the poverty level in 2022:
This zip code:
3.3%
Whole state:
4.6%
Median number of rooms in houses and condos:
Here:
5.6
State:
6.5
Median number of rooms in apartments:
Here:
4.3
State:
3.9
Notable locations in this zip code not listed on our city pages
Notable locations in zip code 99141: Goodwin Station (A), Rock Cut (B), Cousins Cabin (C), Snag Cove Campground (D), Lake Ellen Campground (E), Churchill Lookout (F), Phipps Homestead (G), Kettle River Campground (H), Bradbury Campground (I), Rose Ranch (J), West Kettle Falls (K), Davis Lake Campground (L), Kamloops Island Campground (M), Canyon Creek Campground (N), Trout Lake Campground (O), Kettle Falls Campground (P), Pierre Lake Campground (Q), Fisher Creek Cabin (R), Bangs Mountain Vista (S), Stevens County Sanitary Landfill (T). Display/hide their locations on the map
Churches in zip code 99141 include: Kettle Falls Adventist Church (A), Kettle Falls Assembly of God Church (B), Kettle Falls Community Church (C), New Life Apostolic Church (D), Pentecostal Church (E). Display/hide their locations on the map
Lakes and reservoirs: Buhrig Lake (A), Trout Lake (B), First Thought Lake (C), Ryan Lake (D), Nettleton Lake (E), Summit Lake (F), Harlin Lake (G), Dilly Lake (H). Display/hide their locations on the map
Rivers and creeks: Bailey Creek (A), Betty Creek (B), Boulder Creek (C), Bridge Creek (D), Canyon Creek (E), Colville River (F), Corral Creek (G), Cottonwood Creek (H), Deep Creek (I). Display/hide their locations on the map
Parks in zip code 99141 include: Saint Pauls Mission State Historical Site (1), Old Kettle Falls Recreation Site (2), Sherman Creek State Wildlife Recreation Area (3). Display/hide their locations on the map
In group quarters: 12 (-1 institutionalized population)
Size of family households: 1,090 2-persons, 176 3-persons, 384 4-persons, 62 5-persons, 52 6-persons
Size of nonfamily households: 837 1-person, 118 2-persons, 23 3-persons
840 married couples with children.
223 single-parent households (89 men, 134 women).
97.1% of residents of 99141 zip code speak English at home.
1.2% of residents speak Spanish at home (54% very well, 3% well, 44% not well).
0.3% of residents speak other Indo-European language at home (100% very well).
0.9% of residents speak Asian or Pacific Island language at home (98% well, 2% not well).
Foreign born population: 194 (3.1%) (38.9% of them are naturalized citizens)
This zip code:
3.1%
Whole state:
15.3%
16%Malaysia
7%North Macedonia (Macedonia)
7%Taiwan
7%Honduras
6%Ethiopia
4%Serbia
2%Sweden
13%American
13%German
11%English
10%Norwegian
9%European
5%Irish
3%Dutch
Year of entry for the foreign-born population
02010 or later
352000 to 2009
311990 to 1999
213Before 1990
Facilities with environmental interests located in this zip code:
BRAUNER LUMBER COMPANY (4219 HWY 395 N in KETTLE FALLS, WA)
COMPLIANCE ACTIVITY (Tracking inspections of insecticide, fungicide, and rodenticide, and toxic substances) (Resource Conservation and Recovery Act (tracking hazardous waste)) STATE MASTER (Washington State Department of Ecology's Facility/Site identification system) - TOXICS-100964, UNDERGROUND STORAGE TANK PROGRAM Business SIC classification: SAWMILLS AND PLANING MILLS, GENERAL Business NAICS classification: SAWMILLS. Alternative names: BRAUNER LUMBER COMPANY UST 100964, COLUMBIA CEDAR
BOISE CASCADE PLYWOOD (1274 BOISE ROAD in KETTLE FALLS, WA)
(Resource Conservation and Recovery Act (tracking hazardous waste)) TRI REPORTER (Tracking of toxic chemicals releasing facilities) STATE MASTER (Washington State Department of Ecology's Facility/Site identification system) - AIRQUAL-A 065 0008, AIR MAJOR, HAZWASTE-WAD980380125, EPCRA, TRI REPORTER, WATQUAL-ST0005262, National Pollutant Discharge Elimination System Permit, HAZWASTE-WAD980380125, HAZARDOUS WASTE PROGRAM, AIRQUAL-, FORMAL ENFORCEMENT ACTION Business SIC classification: SAWMILLS AND PLANING MILLS, GENERAL; SOFTWOOD VENEER AND PLYWOOD; LUMBER, PLYWOOD, MILLWORK, AND WOOD PANELS Organizations: BOISE CASCADE CORP (CONTACT/OWNER)
Alternative names: BOISE CASCADE KETTLE FALLS 2, BOISE CASCADE KETTLE FALLS PLYWOOD MILL, BOISE CASCADE KF PLYWOOD MILL
BOISE KETTLE FALLS LUMBER (610 WEST 3RD STREET in KETTLE FALLS, WA)
TRI REPORTER (Tracking of toxic chemicals releasing facilities) STATE MASTER (Washington State Department of Ecology's Facility/Site identification system) - AIRQUAL-A 065 0010, AIR MAJOR, HAZWASTE-CRK000038310, EPCRA, WATQUAL-ST0008007, National Pollutant Discharge Elimination System Permit, WATQUAL-SO3000188, NPDES STORMWATER PERMIT, HAZWASTE-CRK000038310, HAZARDOUS WASTE PROGRAM Business SIC classification: SAWMILLS AND PLANING MILLS, GENERAL Alternative names: BOISE CASCADE LUMBER
BOISE CASCADE KETTLE FALLS PLYWOOD MILL (SOUTH 110 BOISE ROAD in KETTLE FALLS, WA)
AIR MAJOR (AIRS/AFS) ENFORCEMENT/COMPLIANCE ACTIVITY (Integrated Compliance Information System) COMPLIANCE ACTIVITY (Tracking inspections of insecticide, fungicide, and rodenticide, and toxic substances) CRITERIA AND HAZARDOUS AIR POLLUTANT INVENTORY (Inventory of air pollution sources) Business SIC classification: SAWMILLS AND PLANING MILLS, GENERAL; SOFTWOOD VENEER AND PLYWOOD Business NAICS classification: SOFTWOOD VENEER AND PLYWOOD MANUFACTURING. Alternative names: BOISE CASCADE CORP KETTLE FALLS, BOISE CASCADE CORP-KETTLE FALLS PLYWOOD, BOISE CASCADE CORP LUMBER, BOISE CASCADE LMBER, BOISE CASCADE PLYWD
ANDREWS EQUIPMENT SERVICE (970 HIGHWAY 395 N in KETTLE FALLS, WA)
(Resource Conservation and Recovery Act (tracking hazardous waste)) Organizations: RAY LEIGHTON (CONTACT/OPERATOR)
, PETER GROSSMAN (CONTACT/OWNER)
Alternative names: ANDREWS EQUIPMENT SERVICE OF WA INC, ANDREWS EQUIPMENT SERVICE OF WA INC KETT, ANDREWS EQUIPMENT SERVICE OF WA INC KETT
Housing units lacking complete plumbing facilities: 7.6% Housing units lacking complete kitchen facilities: 5.7%
42.7%Wood
26.5%Electricity
22.2%Utility gas
6.3%Bottled, tank, or LP gas
1.9%Other fuel
Population in 1990: 3,668. Population change in the 1990s: +1,499 (+40.9%).
Place of birth for U.S.-born residents:
This state: 3,233
Northeast: 132
Midwest: 480
South: 310
West: 1,754
62% of the 99141 zip code residents lived in the same house 5 years ago. Out of people who lived in different houses, 48% lived in this county. Out of people who lived in different counties, 50% lived in Washington.
90% of the 99141 zip code residents lived in the same house 1 year ago. Out of people who lived in different houses, 51% moved from this county. Out of people who lived in different houses, 32% moved from different county within same state. Out of people who lived in different houses, 17% moved from different state. Out of people who lived in different houses, 1% moved from abroad.
Private vs. public school enrollment:
Students in private schools in grades 1 to 8 (elementary and middle school): 48
Here:
11.9%
Washington:
12.4%
Students in private schools in grades 9 to 12 (high school): 47
Here:
11.4%
Washington:
9.2%
Students in private undergraduate colleges: 42
Here:
26.9%
Washington:
16.5%
Occupation by median earnings in the past 12 months ($)
128,925Architecture and engineering occupations
87,214Health diagnosing and treating practitioners and other technical occupations
76,100Fire fighting and prevention, and other protective service workers including supervisors
74,272Law enforcement workers including supervisors
66,767Arts, design, entertainment, sports, and media occupations
59,149Installation, maintenance, and repair occupations
Top industries in this zip code by the number of employees in 2005:
Utilities: Electric Power Distribution (20-49 employees: 1 establishment)
People in group quarters in 2010:
7 people in nursing facilities/skilled-nursing facilities
2 people in group homes intended for adults
People in group quarters in 2000:
22 people in other noninstitutional group quarters
3 people in nursing homes
Fatal accident statistics in 2014:
Fatal accident count: 2
Vehicles involved in fatal accidents: 3
Fatal accidents caused by drunken drivers: 0
Fatalities: 2
Persons involved in fatal accidents: 5
Pedestrians involved in fatal accidents: 0
Fatal accident statistics in 2013:
Fatal accident count: 1
Vehicles involved in fatal accidents: 1
Fatal accidents caused by drunken drivers: 0
Fatalities: 1
Persons involved in fatal accidents: 1
Pedestrians involved in fatal accidents: 0
2003 - 2018 National Fire Incident Reporting System (NFIRS) incidents
Based on the data from the years 2003 - 2018 the average number of fire incidents per year is 34. The highest number of reported fires - 60 took place in 2008, and the least - 11 in 2011. The data has a growing trend.
When looking into fire subcategories, the most reports belonged to: Outside Fires (55.4%), and Structure Fires (28.6%).
Fire incident types reported to NFIRS in Zip Code 99141


 Nearest zip codes: 99151, 99126, 99160, 99157, 99146, 99167.


 Based on the data from the years 2003 - 2018 the average number of fire incidents per year is 34. The highest number of reported fires - 60 took place in 2008, and the least - 11 in 2011. The data has a growing trend.
 When looking into fire subcategories, the most reports belonged to: Outside Fires (55.4%), and Structure Fires (28.6%).