Evergreen Park, Illinois
Submit your own pictures of this village and show them to the world
- OSM Map
- General Map
- Google Map
- MSN Map
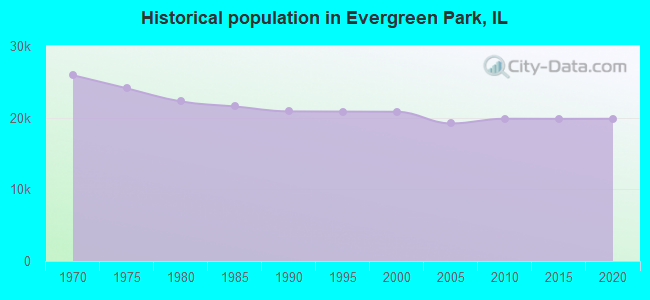
Population change since 2000: -7.7%
 |
| Males: 9,160 | |
| Females: 10,051 |
| Median resident age: | 40.2 years |
| Illinois median age: | 39.1 years |
Zip codes: 60805.
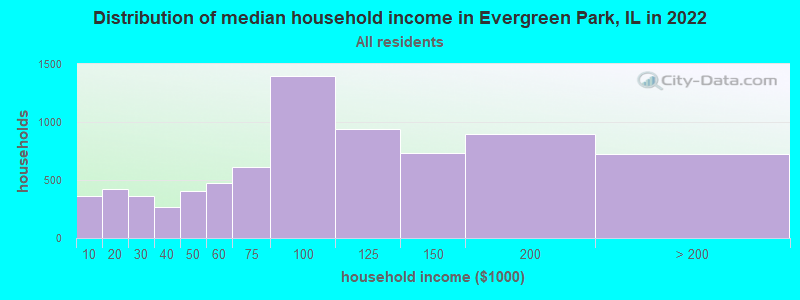
| Evergreen Park: | $90,296 |
| IL: | $76,708 |
Estimated per capita income in 2022: $41,459 (it was $23,038 in 2000)
Evergreen Park village income, earnings, and wages data
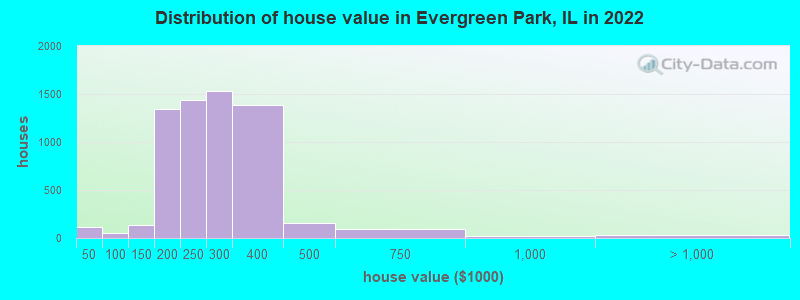
Estimated median house or condo value in 2022: $250,397 (it was $134,900 in 2000)
| Evergreen Park: | $250,397 |
| IL: | $251,600 |
Mean prices in 2022: all housing units: $263,181; detached houses: $262,705; townhouses or other attached units: $265,767; in 2-unit structures: $274,905; in 5-or-more-unit structures: $151,082
Median gross rent in 2022: $1,203.
Evergreen Park, IL residents, houses, and apartments details
(3.9% for White Non-Hispanic residents, 12.0% for Black residents, 5.4% for Hispanic or Latino residents, 6.5% for other race residents, 3.1% for two or more races residents)
Detailed information about poverty and poor residents in Evergreen Park, IL

Compare current foreclosures in Evergreen Park, IL:
| Photo | Address | Area | Beds / Baths | Price | Details |
|---|---|---|---|---|---|

|
#1
S Springfield Ave
Evergreen Park, IL 60805
|
1,729 sq. feet
|
3 baths 3 beds |
show details | |

|
#2
S Trumbull Ave
Evergreen Park, IL 60805
|
1,224 sq. feet
|
2 baths 4 beds |
show details | |

|
#3
S Albany Ave
Evergreen Park, IL 60805
|
1,000 sq. feet
|
1 baths 3 beds |
show details | |

|
#4
S Lawndale Ave
Evergreen Park, IL 60805
|
995 sq. feet
|
1 baths 2 beds |
show details | |

|
#5
S Lawndale Ave
Evergreen Park, IL 60805
|
995 sq. feet
|
1 baths - beds |
show details | |

|
#6
S Homan Ave
Evergreen Park, IL 60805
|
1,105 sq. feet
|
1 baths - beds |
show details | |

|
#7
S Utica Ave
Evergreen Park, IL 60805
|
765 sq. feet
|
1 baths - beds |
show details | |

|
#8
S Sacramento Ave
Evergreen Park, IL 60805
|
1,898 sq. feet
|
2 baths - beds |
show details | |

|
#9
S Trumbull Ave
Evergreen Park, IL 60805
|
2,173 sq. feet
|
1 baths - beds |
show details | |

|
#10
S Richmond Ave
Evergreen Park, IL 60805
|
1,228 sq. feet
|
1 baths - beds |
show details |
| Photo | Address | Area | Beds / Baths | Price | Details |
|---|---|---|---|---|---|

|
#11
S Utica Ave
Evergreen Park, IL 60805
|
1,242 sq. feet
|
1 baths - beds |
show details | |

|
#12
S California Ave
Evergreen Park, IL 60805
|
764 sq. feet
|
1 baths - beds |
show details | |

|
#13
S Utica Ave
Evergreen Park, IL 60805
|
1,417 sq. feet
|
1 baths - beds |
show details | |

|
#14
S Sacramento Ave
Evergreen Park, IL 60805
|
1,001 sq. feet
|
1 baths - beds |
show details | |

|
#15
S Maplewood Ave
Evergreen Park, IL 60805
|
1,060 sq. feet
|
1 baths - beds |
show details | |

|
#16
S Harding Ave
Evergreen Park, IL 60805
|
2,494 sq. feet
|
2 baths - beds |
show details | |

|
#17
S Utica Ave
Evergreen Park, IL 60805
|
1,128 sq. feet
|
1 baths - beds |
show details | |

|
#18
S Albany Ave
Evergreen Park, IL 60805
|
1,429 sq. feet
|
2 baths - beds |
show details | |

|
#19
S Spaulding Ave
Evergreen Park, IL 60805
|
1,340 sq. feet
|
1 baths - beds |
show details | |

|
#20
S Utica Ave
Evergreen Park, IL 60805
|
1,056 sq. feet
|
1 baths - beds |
show details |
| Photo | Address | Area | Beds / Baths | Price | Details |
|---|---|---|---|---|---|

|
#21
S Sacramento Ave
Evergreen Park, IL 60805
|
1,008 sq. feet
|
1 baths - beds |
show details | |

|
#22
S Saint Louis Ave
Evergreen Park, IL 60805
|
1,785 sq. feet
|
2 baths - beds |
show details | |

|
#23
S Albany Ave
Evergreen Park, IL 60805
|
1,192 sq. feet
|
1 baths - beds |
show details | |

|
#24
S Ridgeway Ave
Evergreen Park, IL 60805
|
1,273 sq. feet
|
1 baths - beds |
show details | |

|
#25
S Utica Ave # 2
Evergreen Park, IL 60805
|
1,799 sq. feet
|
2 baths - beds |
show details | |

|
#26
S Clifton Park Ave
Evergreen Park, IL 60805
|
1,428 sq. feet
|
1 baths - beds |
show details | |

|
#27
S Francisco Ave
Evergreen Park, IL 60805
|
987 sq. feet
|
2 baths - beds |
show details | |

|
#28
S Fairfield Ave
Evergreen Park, IL 60805
|
1,141 sq. feet
|
1 baths - beds |
show details | |

|
#29
W 88th St Apt 205
Evergreen Park, IL 60805
|
- sq. feet
|
- baths - beds |
show details | |

|
#30
S Sacramento Ave
Evergreen Park, IL 60805
|
1,863 sq. feet
|
2 baths - beds |
show details |
| Photo | Address | Area | Beds / Baths | Price | Details |
|---|---|---|---|---|---|

|
#31
S Utica Ave
Evergreen Park, IL 60805
|
984 sq. feet
|
1 baths - beds |
show details | |

|
#32
S Springfield Ave
Evergreen Park, IL 60805
|
894 sq. feet
|
1 baths - beds |
show details | |

|
#33
S Utica Ave
Evergreen Park, IL 60805
|
1,034 sq. feet
|
1 baths - beds |
show details | |

|
#34
S Utica Ave
Evergreen Park, IL 60805
|
1,414 sq. feet
|
2 baths - beds |
show details | |

|
#35
S Utica Ave
Evergreen Park, IL 60805
|
1,222 sq. feet
|
1 baths - beds |
show details | |

|
#36
S Albany Ave
Evergreen Park, IL 60805
|
1,063 sq. feet
|
1 baths - beds |
show details | |

|
#37
S Turner Ave
Evergreen Park, IL 60805
|
1,067 sq. feet
|
1 baths - beds |
show details | |

|
#38
S Sawyer Ave
Evergreen Park, IL 60805
|
1,200 sq. feet
|
1 baths - beds |
show details | |

|
#39
S Mozart Ave
Evergreen Park, IL 60805
|
1,210 sq. feet
|
2 baths - beds |
show details | |

|
#40
S Spaulding Ave
Evergreen Park, IL 60805
|
1,038 sq. feet
|
1 baths - beds |
show details |
| Photo | Address | Area | Beds / Baths | Price | Details |
|---|---|---|---|---|---|

|
#41
S Sawyer Ave
Evergreen Park, IL 60805
|
925 sq. feet
|
1 baths - beds |
show details | |

|
#42
S Homan Ave
Evergreen Park, IL 60805
|
889 sq. feet
|
2 baths - beds |
show details | |

|
#43
S Utica Ave
Evergreen Park, IL 60805
|
1,799 sq. feet
|
2 baths - beds |
show details | |

|
#44
W 100th St
Evergreen Park, IL 60805
|
- sq. feet
|
- baths - beds |
show details | |

|
#45
S Richmond Ave
Evergreen Park, IL 60805
|
- sq. feet
|
- baths - beds |
show details | |

|
#46
S Pulaski Rd Apt 2s
Evergreen Park, IL 60805
|
- sq. feet
|
- baths - beds |
show details | |

|
#47
W 90th St
Evergreen Park, IL 60805
|
- sq. feet
|
- baths - beds |
show details | |

|
#48
W 93rd Pl
Evergreen Park, IL 60805
|
- sq. feet
|
- baths - beds |
show details | |

|
#49
W 95th St
Evergreen Park, IL 60805
|
- sq. feet
|
- baths - beds |
show details | |

|
Check over 1 million property listings on Foreclosure.com!
|
browse all offers | |||


- 10,57954.8%White alone
- 4,25722.1%Black alone
- 3,04815.8%Hispanic
- 6883.6%Two or more races
- 4782.5%Asian alone
- 1020.5%Other race alone
- 160.08%American Indian alone
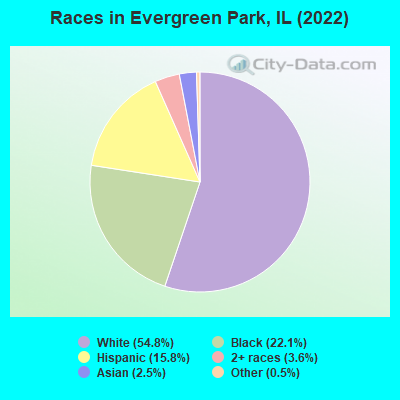
Races in Evergreen Park detailed stats: ancestries, foreign born residents, place of birth
According to our research of Illinois and other state lists, there were 7 registered sex offenders living in Evergreen Park, Illinois as of May 19, 2024.
The ratio of all residents to sex offenders in Evergreen Park is 2,822 to 1.
The ratio of registered sex offenders to all residents in this city is much lower than the state average.
Type |
2009 |
2010 |
2011 |
2012 |
2013 |
2014 |
2015 |
2016 |
2017 |
2018 |
2019 |
2020 |
2021 |
2022 |
|---|---|---|---|---|---|---|---|---|---|---|---|---|---|---|
| Murders (per 100,000) | 1 (5.2) | 0 (0.0) | 0 (0.0) | 0 (0.0) | 0 (0.0) | 0 (0.0) | 0 (0.0) | 0 (0.0) | 1 (5.1) | 0 (0.0) | 1 (5.2) | 0 (0.0) | 1 (5.3) | 0 (0.0) |
| Rapes (per 100,000) | 0 (0.0) | 7 (35.3) | 3 (15.1) | 2 (10.0) | 0 (0.0) | 0 (0.0) | 2 (10.0) | 5 (25.2) | 4 (20.4) | 4 (20.5) | 19 (98.7) | 3 (15.7) | 7 (37.2) | 5 (26.2) |
| Robberies (per 100,000) | 29 (151.0) | 18 (90.7) | 32 (160.7) | 27 (135.3) | 20 (100.2) | 19 (95.1) | 13 (65.2) | 17 (85.7) | 20 (102.0) | 19 (97.5) | 10 (51.9) | 21 (110.1) | 9 (47.8) | 13 (68.1) |
| Assaults (per 100,000) | 5 (26.0) | 8 (40.3) | 12 (60.3) | 5 (25.1) | 8 (40.1) | 8 (40.0) | 15 (75.2) | 19 (95.8) | 23 (117.3) | 31 (159.0) | 32 (166.1) | 41 (215.0) | 7 (37.2) | 11 (57.6) |
| Burglaries (per 100,000) | 71 (369.7) | 48 (241.8) | 72 (361.6) | 76 (381.0) | 62 (310.8) | 43 (215.2) | 33 (165.4) | 56 (282.3) | 25 (127.6) | 30 (153.9) | 32 (166.1) | 23 (120.6) | 20 (106.3) | 21 (109.9) |
| Thefts (per 100,000) | 596 (3,103) | 620 (3,123) | 645 (3,239) | 479 (2,401) | 545 (2,732) | 501 (2,508) | 571 (2,862) | 519 (2,616) | 563 (2,872) | 883 (4,529) | 802 (4,164) | 753 (3,949) | 508 (2,700) | 828 (4,334) |
| Auto thefts (per 100,000) | 30 (156.2) | 21 (105.8) | 26 (130.6) | 18 (90.2) | 10 (50.1) | 25 (125.1) | 21 (105.2) | 25 (126.0) | 8 (40.8) | 8 (41.0) | 8 (41.5) | 5 (26.2) | 31 (164.8) | 50 (261.7) |
| Arson (per 100,000) | 3 (15.6) | 0 (0.0) | 0 (0.0) | 1 (5.0) | 1 (5.0) | 2 (10.0) | 0 (0.0) | 2 (10.1) | 0 (0.0) | 2 (10.3) | 0 (0.0) | 1 (5.2) | 0 (0.0) | 4 (20.9) |
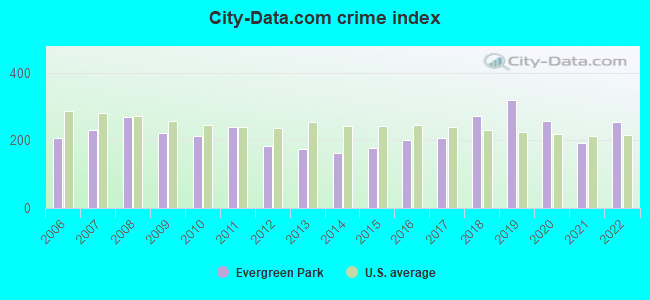
| City-Data.com crime index | 223.4 | 213.8 | 237.6 | 183.6 | 173.1 | 161.9 | 177.1 | 199.5 | 207.7 | 272.7 | 319.6 | 257.1 | 190.8 | 254.9 |
The City-Data.com crime index weighs serious crimes and violent crimes more heavily. Higher means more crime, U.S. average is 246.1. It adjusts for the number of visitors and daily workers commuting into cities.
Crime rate in Evergreen Park detailed stats: murders, rapes, robberies, assaults, burglaries, thefts, arson
Full-time law enforcement employees in 2021, including police officers: 72 (54 officers - 49 male; 5 female).
| Officers per 1,000 residents here: | 2.87 |
| Illinois average: | 2.84 |
 Recent articles from our blog. Our writers, many of them Ph.D. graduates or candidates, create easy-to-read articles on a wide variety of topics.

 | Evergreen Park resident looking to move further out. Southeast or southwest? (7 replies) |
| Questionable new GreatSchools rankings (29 replies) |
| Moving to Chicago - Where to live for commute to Oak Lawn/Evergreen Park? (8 replies) |
| Western Suburbs to Prioritize? (32 replies) |
| Suburbs that are obscure or little-known (240 replies) |
| Very weak housing market in Highland Park (66 replies) |
Latest news from Evergreen Park, IL collected exclusively by city-data.com from local newspapers, TV, and radio stations
Ancestries: Irish (20.9%), German (4.6%), Polish (4.4%), Italian (3.9%), American (1.5%), European (1.3%).
Current Local Time: CST time zone
Incorporated on 02/07/1894
Elevation: 625 feet
Land area: 3.17 square miles.
Population density: 6,053 people per square mile (high).
1,822 residents are foreign born (4.7% Latin America, 2.0% Europe, 1.9% Asia).
| This village: | 9.4% |
| Illinois: | 14.1% |
Median real estate property taxes paid for housing units with mortgages in 2022: $5,842 (2.3%)
Median real estate property taxes paid for housing units with no mortgage in 2022: $5,462 (2.2%)
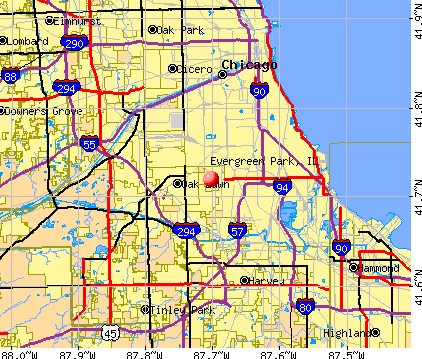
Nearest city with pop. 50,000+: Oak Lawn, IL  (2.6 miles , pop. 55,245).
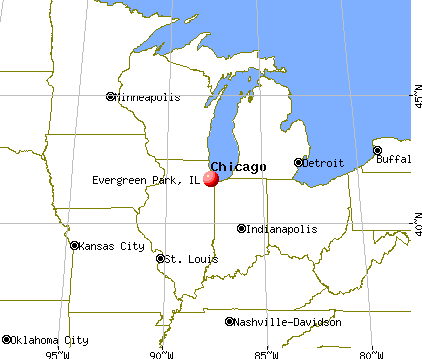
Nearest city with pop. 200,000+: Chicago, IL (8.4 miles , pop. 2,896,016).
Nearest cities:
), ), ), ), ), Latitude: 41.72 N, Longitude: 87.70 W
Daytime population change due to commuting: -641 (-3.3%)
Workers who live and work in this village: 2,247 (23.1%)
Area code commonly used in this area: 708
Evergreen Park, Illinois accommodation & food services, waste management - Economy and Business Data
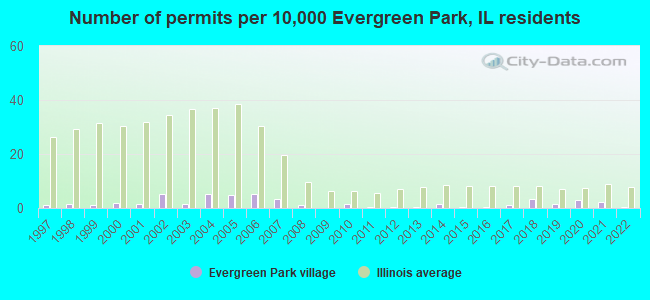
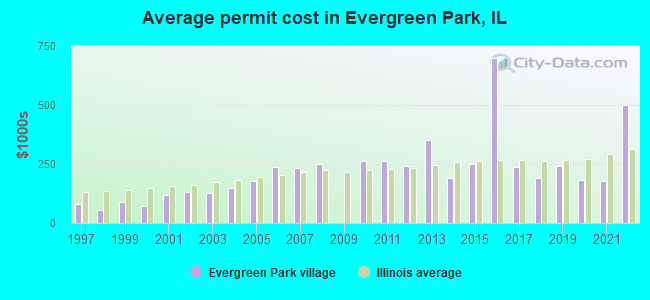
Single-family new house construction building permits:
- 2022: 1 building, cost: $500,000
- 2021: 5 buildings, average cost: $180,000
- 2020: 6 buildings, average cost: $181,700
- 2019: 3 buildings, average cost: $240,000
- 2018: 7 buildings, average cost: $192,100
- 2017: 2 buildings, average cost: $236,500
- 2016: 1 building, cost: $700,000
- 2015: 1 building, cost: $250,000
- 2014: 3 buildings, average cost: $191,700
- 2013: 1 building, cost: $350,000
- 2012: 1 building, cost: $240,000
- 2011: 1 building, cost: $264,100
- 2010: 3 buildings, average cost: $264,100
- 2008: 2 buildings, average cost: $250,000
- 2007: 7 buildings, average cost: $234,400
- 2006: 11 buildings, average cost: $237,800
- 2005: 10 buildings, average cost: $176,700
- 2004: 11 buildings, average cost: $149,500
- 2003: 3 buildings, average cost: $126,700
- 2002: 11 buildings, average cost: $131,800
- 2001: 3 buildings, average cost: $118,300
- 2000: 4 buildings, average cost: $74,300
- 1999: 2 buildings, average cost: $90,000
- 1998: 3 buildings, average cost: $57,300
- 1997: 2 buildings, average cost: $80,000
| Here: | 4.0% |
| Illinois: | 4.2% |
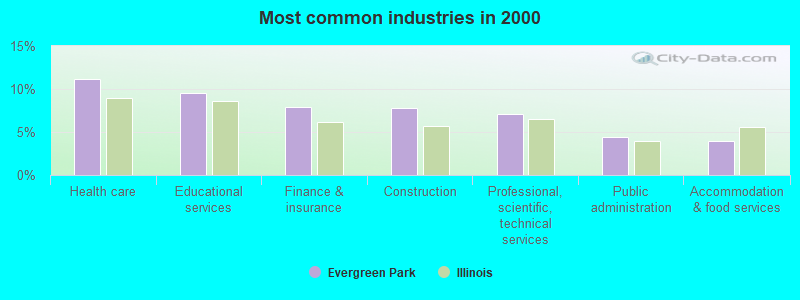
- Health care (11.1%)
- Educational services (9.6%)
- Finance & insurance (7.9%)
- Construction (7.8%)
- Professional, scientific, technical services (7.1%)
- Public administration (4.5%)
- Accommodation & food services (3.9%)
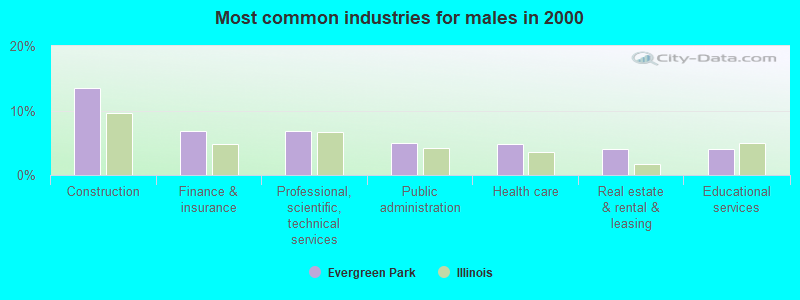
- Construction (13.5%)
- Finance & insurance (6.9%)
- Professional, scientific, technical services (6.8%)
- Public administration (5.0%)
- Health care (4.8%)
- Real estate & rental & leasing (4.0%)
- Educational services (4.0%)
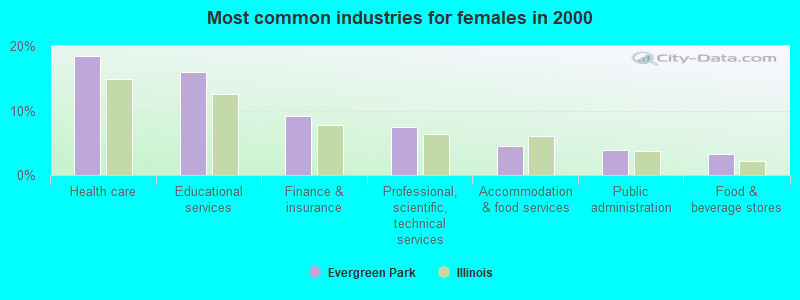
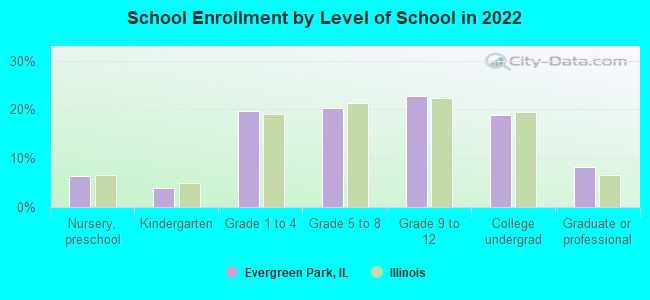
- Health care (18.4%)
- Educational services (16.0%)
- Finance & insurance (9.1%)
- Professional, scientific, technical services (7.5%)
- Accommodation & food services (4.5%)
- Public administration (3.9%)
- Food & beverage stores (3.2%)
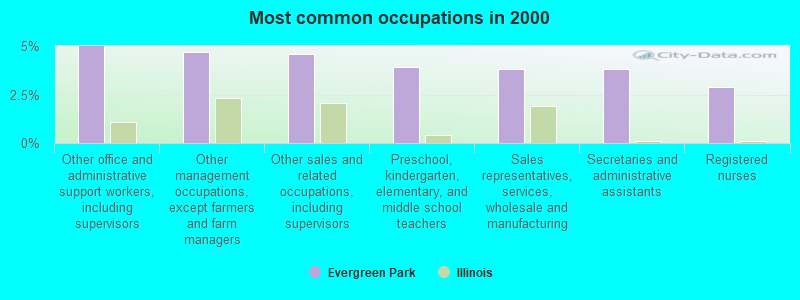
- Other office and administrative support workers, including supervisors (5.0%)
- Other management occupations, except farmers and farm managers (4.7%)
- Other sales and related occupations, including supervisors (4.6%)
- Preschool, kindergarten, elementary, and middle school teachers (3.9%)
- Sales representatives, services, wholesale and manufacturing (3.8%)
- Secretaries and administrative assistants (3.8%)
- Registered nurses (2.9%)
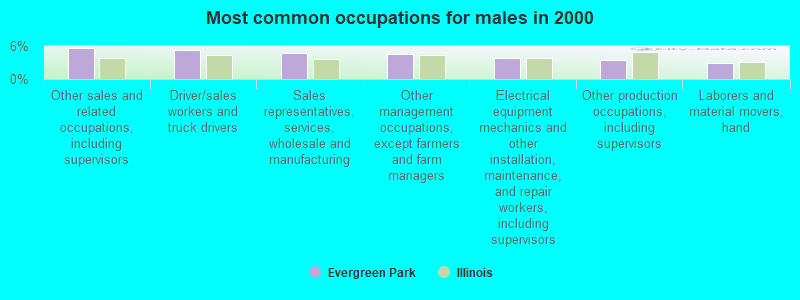
- Other sales and related occupations, including supervisors (5.6%)
- Driver/sales workers and truck drivers (5.4%)
- Sales representatives, services, wholesale and manufacturing (4.7%)
- Other management occupations, except farmers and farm managers (4.5%)
- Electrical equipment mechanics and other installation, maintenance, and repair workers, including supervisors (3.8%)
- Other production occupations, including supervisors (3.5%)
- Laborers and material movers, hand (2.9%)
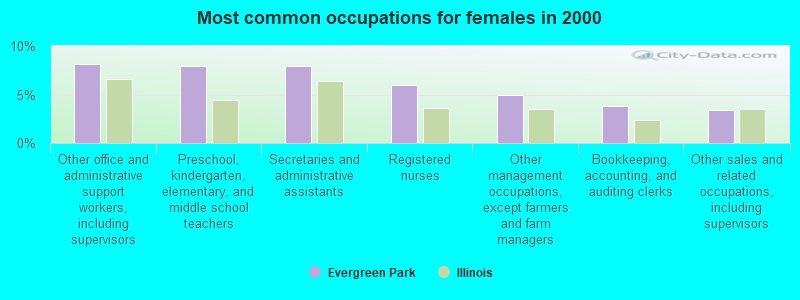
- Other office and administrative support workers, including supervisors (8.2%)
- Preschool, kindergarten, elementary, and middle school teachers (8.0%)
- Secretaries and administrative assistants (7.9%)
- Registered nurses (6.0%)
- Other management occupations, except farmers and farm managers (4.9%)
- Bookkeeping, accounting, and auditing clerks (3.8%)
- Other sales and related occupations, including supervisors (3.4%)
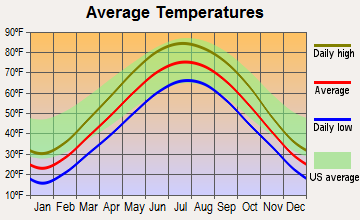
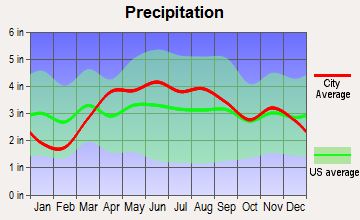
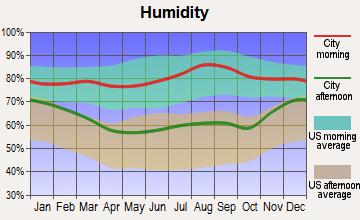
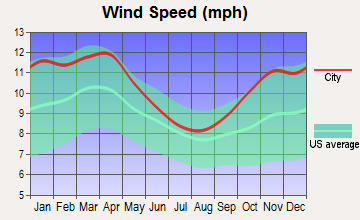
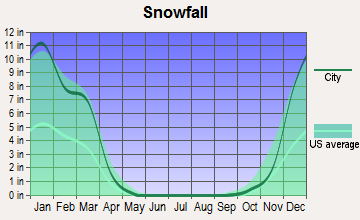
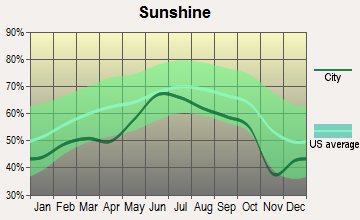
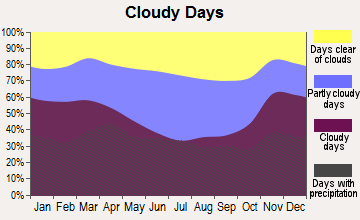
Average climate in Evergreen Park, Illinois
Based on data reported by over 4,000 weather stations
|
|

(lower is better)
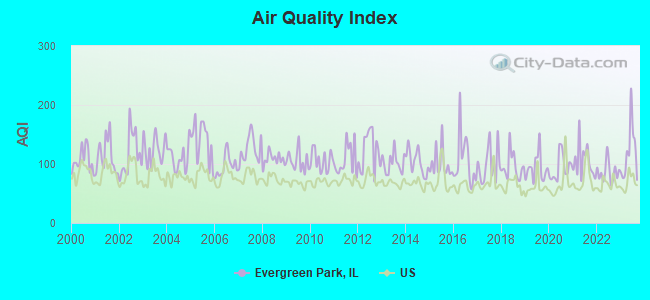
Air Quality Index (AQI) level in 2023 was 119. This is significantly worse than average.
| City: | 119 |
| U.S.: | 73 |
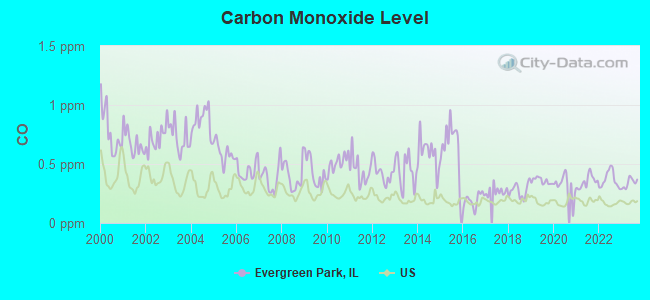
Carbon Monoxide (CO) [ppm] level in 2023 was 0.339. This is worse than average. Closest monitor was 2.4 miles away from the city center.
| City: | 0.339 |
| U.S.: | 0.251 |
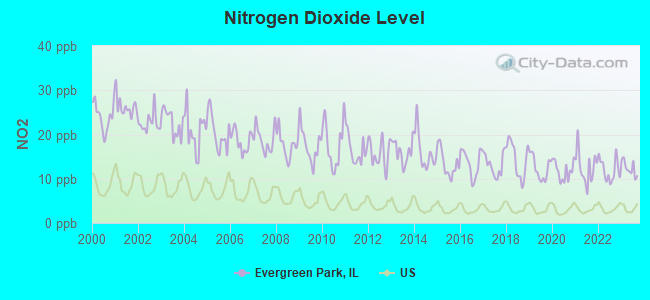
Nitrogen Dioxide (NO2) [ppb] level in 2023 was 12.3. This is significantly worse than average. Closest monitor was 1.8 miles away from the city center.
| City: | 12.3 |
| U.S.: | 5.1 |
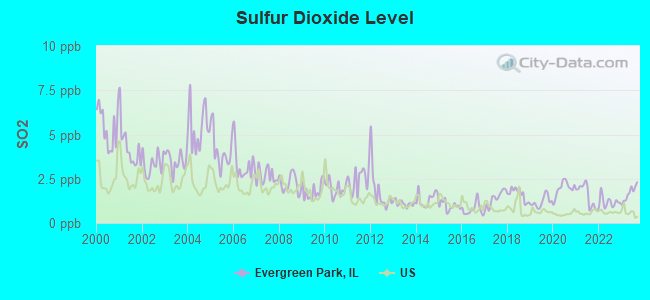
Sulfur Dioxide (SO2) [ppb] level in 2023 was 1.68. This is about average. Closest monitor was 2.2 miles away from the city center.
| City: | 1.68 |
| U.S.: | 1.51 |
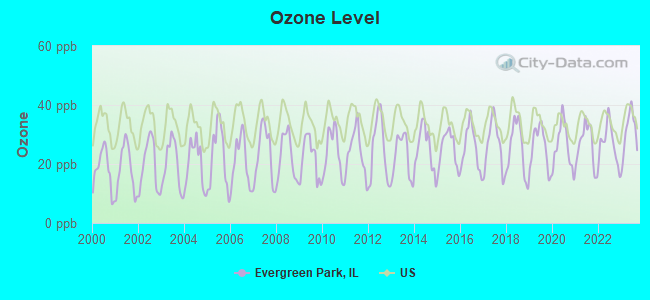
Ozone [ppb] level in 2023 was 30.8. This is about average. Closest monitor was 1.8 miles away from the city center.
| City: | 30.8 |
| U.S.: | 33.3 |
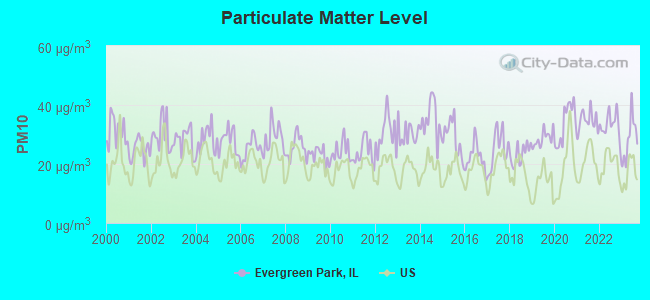
Particulate Matter (PM10) [µg/m3] level in 2023 was 28.5. This is significantly worse than average. Closest monitor was 2.9 miles away from the city center.
| City: | 28.5 |
| U.S.: | 19.2 |
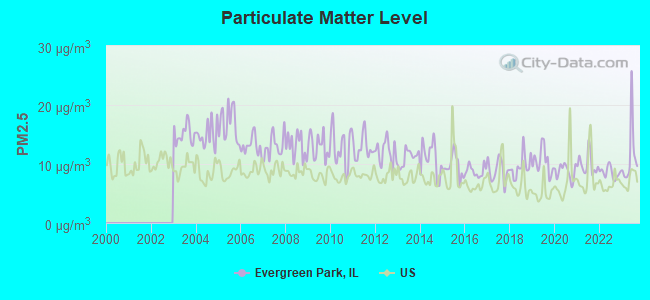
Particulate Matter (PM2.5) [µg/m3] level in 2023 was 11.3. This is worse than average. Closest monitor was 2.2 miles away from the city center.
| City: | 11.3 |
| U.S.: | 8.1 |
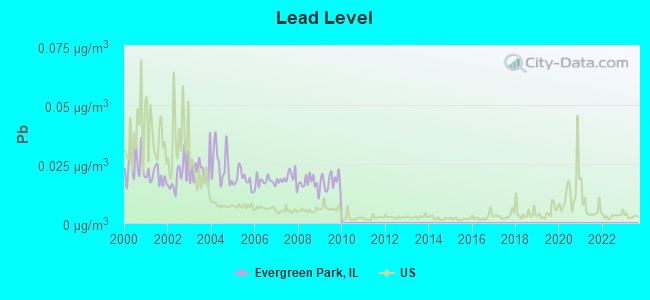
Lead (Pb) [µg/m3] level in 2009 was 0.0177. This is significantly worse than average. Closest monitor was 2.4 miles away from the city center.
| City: | 0.0177 |
| U.S.: | 0.0093 |
Tornado activity:
Evergreen Park-area historical tornado activity is near Illinois state average. It is 52% greater than the overall U.S. average.
On 8/28/1990, a category F5 (max. wind speeds 261-318 mph) tornado 24.8 miles away from the Evergreen Park village center killed 29 people and injured 350 people and caused between $50,000 and $500,000 in damages.
On 4/21/1967, a category F4 (max. wind speeds 207-260 mph) tornado 7.4 miles away from the village center killed 33 people and injured 500 people and caused between $5,000,000 and $50,000,000 in damages.
Earthquake activity:
Evergreen Park-area historical earthquake activity is significantly above Illinois state average. It is 41% greater than the overall U.S. average.On 4/18/2008 at 09:36:59, a magnitude 5.4 (5.1 MB, 4.8 MS, 5.4 MW, 5.2 MW, Class: Moderate, Intensity: VI - VII) earthquake occurred 226.2 miles away from Evergreen Park center
On 6/10/1987 at 23:48:54, a magnitude 5.1 (4.9 MB, 4.4 MS, 4.6 MS, 5.1 LG) earthquake occurred 200.7 miles away from Evergreen Park center
On 4/18/2008 at 09:36:59, a magnitude 5.2 (5.2 MW, Depth: 8.9 mi) earthquake occurred 226.3 miles away from the city center
On 6/28/2004 at 06:10:52, a magnitude 4.2 (4.2 MW, Depth: 6.2 mi, Class: Light, Intensity: IV - V) earthquake occurred 64.5 miles away from the city center
On 6/18/2002 at 17:37:15, a magnitude 5.0 (4.3 MB, 4.6 MW, 5.0 LG) earthquake occurred 258.2 miles away from Evergreen Park center
On 4/18/2008 at 15:14:16, a magnitude 4.8 (4.5 MB, 4.8 MW, 4.6 MW) earthquake occurred 224.5 miles away from the city center
Magnitude types: regional Lg-wave magnitude (LG), body-wave magnitude (MB), surface-wave magnitude (MS), moment magnitude (MW)
Natural disasters:
The number of natural disasters in Cook County (20) is greater than the US average (15).Major Disasters (Presidential) Declared: 15
Emergencies Declared: 4
Causes of natural disasters: Floods: 13, Storms: 12, Tornadoes: 3, Snowstorms: 2, Winter Storms: 2, Blizzard: 1, Hurricane: 1, Snow: 1, Wind: 1, Other: 1 (Note: some incidents may be assigned to more than one category).
Hospitals in Evergreen Park:
- LITTLE COMPANY OF MARY HOSPITAL (Voluntary non-profit - Church, provides emergency services, 2800 W 95TH ST)
Nursing Homes in Evergreen Park:
- EMERALD PARK HEALTH CARE CENTER (9125 S PULASKI)
- EVERGREEN HEALTH CARE CENTER (10124 SOUTH KEDZIE)
- PEACE MEMORIAL HOME (10124 S KEDZIE)
Dialysis Facilities in Evergreen Park:
Home Health Centers in Evergreen Park:
- COMPASSIONATE HOME CARE, INC (9318 S KEDZIE AVENUE SUITE 6 & 7)
- DK HEALTHCARE SERVICES, INC (3114 W 95TH STREET)
- HOSANNAS HOME HEALTH AGENCY, (2823 WEST 87TH STREET)
- HYACINTH HOME HEALTH, INC (9500 S AVERS AVE, STE 5)
- MAGNIFICENT HOME HEALTHCARE, LLC (3345 W 95TH STREET)
- MAXIMUM HOME HEALTH CARE, INC. (2959 WEST 95TH STREET)
- NURSEFINDERS OF OAK LAWN (3830 W 95TH ST SUITE 103)
- OPTIMUM HOME HEALTH CARE, INC (9730 S WESTERN AVE STE 710)
- QUALITY ASSURED HOME HEALTH, INC (3900 WEST 95TH STREET, SUITE 9)
- RELIABLE HOME HEALTH CARE, INC (3929 WEST 95TH STREET)
Amtrak stations near Evergreen Park:
- 8 miles: SUMMIT (ARCHER & CENTER AVE.) . Services: public payphones, free short-term parking, free long-term parking, call for taxi service, public transit connection.
- 11 miles: HAMMOND-WHITING (HAMMOND, 1135 CALUMET AVE.) . Services: ticket office, partially wheelchair accessible, enclosed waiting area, public restrooms, public payphones, free short-term parking, free long-term parking, call for taxi service.
- 11 miles: LA GRANGE ROAD (LA GRANGE, 25 W. BURLINGTON AVE.) . Services: enclosed waiting area, public payphones, taxi stand, public transit connection.
Colleges/universities with over 2000 students nearest to Evergreen Park:
- Saint Xavier University (about 2 miles; Chicago, IL; Full-time enrollment: 3,576)
- City Colleges of Chicago-Richard J Daley College (about 3 miles; Chicago, IL; FT enrollment: 7,497)
- Chicago State University (about 5 miles; Chicago, IL; FT enrollment: 4,352)
- City Colleges of Chicago-Kennedy-King College (about 6 miles; Chicago, IL; FT enrollment: 5,044)
- City Colleges of Chicago-Olive-Harvey College (about 6 miles; Chicago, IL; FT enrollment: 4,110)
- University of Chicago (about 8 miles; Chicago, IL; FT enrollment: 11,506)
- Moraine Valley Community College (about 8 miles; Palos Hills, IL; FT enrollment: 12,008)
Public high school in Evergreen Park:
- EVERGREEN PARK HIGH SCHOOL (Students: 929, Location: 9901 S KEDZIE AVE, Grades: 9-12)
Public elementary/middle schools in Evergreen Park:
- NORTHEAST ELEM SCHOOL (Students: 427, Location: 9058 S CALIFORNIA AVE, Grades: PK-6)
- SOUTHEAST ELEM SCHOOL (Students: 361, Location: 9800 S FRANCISCO AVE, Grades: KG-6)
- SOUTHWEST ELEM SCHOOL (Students: 340, Location: 9900 S CENTRAL PARK AVE, Grades: KG-6)
- NORTHWEST SCHOOL (Students: 286, Location: 3630 W 92ND ST, Grades: PK-6)
- CENTRAL JR HIGH SCHOOL (Location: 9400 S SAWYER AVE, Grades: 7-8)
Private elementary/middle schools in Evergreen Park:
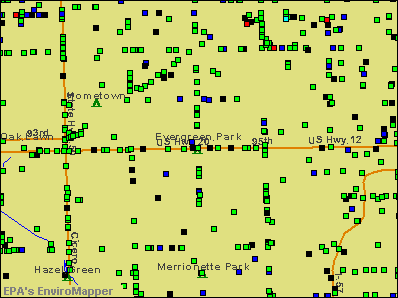
Points of interest:
Notable locations in Evergreen Park: Evergreen Plaza (A), Evergreen Golf Club (B), Evergreen Park Village Hall (C), Peace Memorial Home (D), Evergreen Park Fire Department (E), Evergreen Park Public Library (F). Display/hide their locations on the map
Churches in Evergreen Park include: Bethel Bible Church (A), Ebenezer Lutheran Church (B), Evergreen Park Christian Church (C), Evergreen Park Presbyterian Church (D), First United Methodist Church (E), Immanuel United Church of Christ (F), Most Holy Redeemer Church (G), Park Lane Christian Church (H), Saint Bernadette Church (I). Display/hide their locations on the map
Cemetery: Evergreen Cemetery (1). Display/hide its location on the map
Parks in Evergreen Park include: Evergreen Aqua Park (1), Mini Park (2), Southeast Park (3), Norris Field (4), Northwest Park (5), Evergreen Park (6). Display/hide their locations on the map
Birthplace of: Rich Nugent - Politician, David Patterson (scientist) - Computer scientist, Ed Farmer - Baseball player, George Lilja - Football player, Jeff Roehl - 2005 NFL player (New England Patriots, born: May 18, 1980), Jim Dwyer (baseball) - Baseball player, Terrance W. Gainer - Sergeant at Arms of the Senate, Timothy P. Marshall - Civil engineer, Patrick O'Malley (American politician) - Politician, Bil Dwyer - Comedian and game show host.
Drinking water stations with addresses in Evergreen Park and their reported violations in the past:
EVERGREEN PARK (Address: 9418 S. KEDZIE AVE. , Population served: 19,852, Purch surface water):Past monitoring violations:
- Water Quality Parameter M/R - Between JUL-2006 and DEC-2006, Contaminant: Lead and Copper Rule. Follow-up actions: St Compliance achieved (JAN-11-2007), St Violation/Reminder Notice (JAN-12-2007)
| This village: | 2.7 people |
| Illinois: | 2.6 people |
| This village: | 71.3% |
| Whole state: | 65.8% |
| This village: | 4.0% |
| Whole state: | 6.3% |
Likely homosexual households (counted as self-reported same-sex unmarried-partner households)
- Lesbian couples: 0.3% of all households
- Gay men: 0.1% of all households
7 people in other noninstitutional facilities in 2010
People in group quarters in Evergreen Park in 2000:
- 378 people in nursing homes
- 15 people in religious group quarters
- 9 people in other nonhousehold living situations
- 7 people in other noninstitutional group quarters
Banks with most branches in Evergreen Park (2011 data):
- Marquette Bank: Evergreen Branch at 9335 South Kedzie, branch established on 1994/04/04; Evergreen Plaza Facility Branch at 9500 S. Western Avenue, branch established on 1999/09/01. Info updated 2006/11/15: Bank assets: $1,703.1 mil, Deposits: $1,439.1 mil, headquarters in Chicago, IL, positive income, Commercial Lending Specialization, 27 total offices, Holding Company: Marquette National Corporation
- TCF National Bank: Evergreen Park Branch #2105 at 3960 West 95th Street, branch established on 1907/01/01. Info updated 2009/11/23: Bank assets: $19,007.0 mil, Deposits: $12,377.0 mil, headquarters in Sioux Falls, SD, positive income, Commercial Lending Specialization, 441 total offices, Holding Company: Tcf Financial Corporation
- BMO Harris Bank National Association: Evergreen Park Branch at 9950 South Kedzie Avenue, branch established on 1956/01/01. Info updated 2011/07/14: Bank assets: $97,264.0 mil, Deposits: $75,624.6 mil, headquarters in Chicago, IL, positive income, 717 total offices, Holding Company: Bank Of Montreal
- RBS Citizens, National Association: W. 95th /evergreen Park at 2917 West 95th Street, branch established on 1889/01/01. Info updated 2007/09/19: Bank assets: $106,940.6 mil, Deposits: $75,690.2 mil, headquarters in Providence, RI, positive income, 1135 total offices, Holding Company: Uk Financial Investments Limited
- Fifth Third Bank: Evergreen Park Branch at 3101 West 95th Street, branch established on 1949/03/05. Info updated 2009/10/05: Bank assets: $114,540.4 mil, Deposits: $89,689.1 mil, headquarters in Cincinnati, OH, positive income, Commercial Lending Specialization, 1378 total offices, Holding Company: Fifth Third Bancorp
- Archer Bank: Evergreen Park Branch at 3259 W. 95th St., branch established on 2007/08/17. Info updated 2010/04/21: Bank assets: $577.8 mil, Deposits: $525.4 mil, headquarters in Chicago, IL, negative income in the last year, Commercial Lending Specialization, 20 total offices, Holding Company: Metropolitan Bank Group, Inc.
- First American Bank: Evergreen Park Branch at 3221 West 87th Street, branch established on 2006/09/19. Info updated 2010/01/19: Bank assets: $2,710.6 mil, Deposits: $2,213.4 mil, headquarters in Elk Grove Village, IL, negative income in the last year, Commercial Lending Specialization, 50 total offices, Holding Company: First American Bank Corporation
- Evergreen Bank Group: Evergreen Park Branch at 3842 West 95th Street, branch established on 2007/05/01. Info updated 2009/10/13: Bank assets: $392.5 mil, Deposits: $350.7 mil, headquarters in Oak Brook, IL, positive income, Consumer Lending Specialization, 2 total offices, Holding Company: Bancorp Financial, Inc.
- Standard Bank and Trust Company: Evergreen Park Facility at 2400 West 95th Street, branch established on 1970/06/01. Info updated 2006/11/03: Bank assets: $2,140.2 mil, Deposits: $1,872.8 mil, headquarters in Hickory Hills, IL, positive income, Commercial Lending Specialization, 43 total offices, Holding Company: Standard Bancshares, Inc.
For population 15 years and over in Evergreen Park:
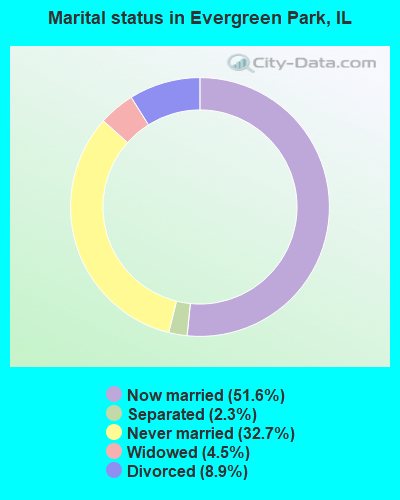
- Never married: 32.7%
- Now married: 51.6%
- Separated: 2.3%
- Widowed: 4.5%
- Divorced: 8.9%
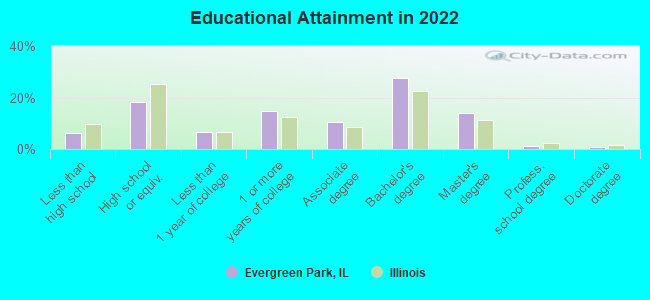
For population 25 years and over in Evergreen Park:
- High school or higher: 93.8%
- Bachelor's degree or higher: 42.4%
- Graduate or professional degree: 15.4%
- Unemployed: 4.0%
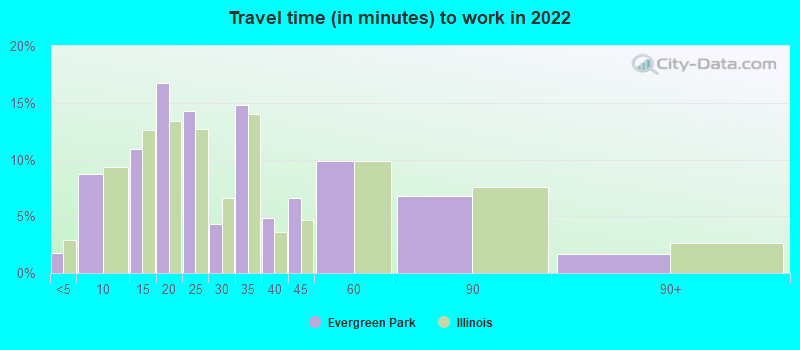
- Mean travel time to work (commute): 25.9 minutes
| Here: | 10.7 |
| Illinois average: | 12.5 |


Graphs represent county-level data. Detailed 2008 Election Results
Political contributions by individuals in Evergreen Park, IL
Religion statistics for Evergreen Park, IL (based on Cook County data)


| Religion | Adherents | Congregations |
|---|---|---|
| Catholic | 1,947,223 | 376 |
| Evangelical Protestant | 432,975 | 1,484 |
| Other | 312,636 | 403 |
| Mainline Protestant | 202,114 | 630 |
| Black Protestant | 148,895 | 395 |
| Orthodox | 53,276 | 66 |
| None | 2,097,556 | - |
Food Environment Statistics:
| Cook County: | 2.77 / 10,000 pop. |
| State: | 2.24 / 10,000 pop. |
| Cook County: | 0.04 / 10,000 pop. |
| Illinois: | 0.08 / 10,000 pop. |
| This county: | 0.93 / 10,000 pop. |
| State: | 0.75 / 10,000 pop. |
| Cook County: | 1.53 / 10,000 pop. |
| Illinois: | 2.61 / 10,000 pop. |
| This county: | 6.67 / 10,000 pop. |
| Illinois: | 6.86 / 10,000 pop. |
| Here: | 8.4% |
| State: | 8.3% |
| Cook County: | 23.5% |
| Illinois: | 25.2% |
| Here: | 16.3% |
| State: | 14.5% |
Health and Nutrition:
| This city: | 51.1% |
| Illinois: | 49.5% |
| This city: | 48.5% |
| Illinois: | 47.2% |
| Evergreen Park: | 28.6 |
| Illinois: | 28.6 |
| This city: | 20.2% |
| Illinois: | 20.5% |
| Evergreen Park: | 10.6% |
| Illinois: | 10.8% |
| This city: | 6.9 |
| Illinois: | 6.8 |
| Evergreen Park: | 34.7% |
| State: | 33.4% |
| Evergreen Park: | 56.9% |
| Illinois: | 56.4% |
| Evergreen Park: | 78.4% |
| Illinois: | 79.9% |
More about Health and Nutrition of Evergreen Park, IL Residents
| Local government employment and payroll (March 2022) | |||||
| Function | Full-time employees | Monthly full-time payroll | Average yearly full-time wage | Part-time employees | Monthly part-time payroll |
|---|---|---|---|---|---|
| Police Protection - Officers | 68 | $575,645 | $101,584 | 5 | $8,167 |
| Streets and Highways | 25 | $127,161 | $61,037 | 0 | $0 |
| Water Supply | 14 | $69,782 | $59,813 | 0 | $0 |
| Other Government Administration | 12 | $60,901 | $60,901 | 7 | $9,363 |
| Local Libraries | 11 | $46,904 | $51,168 | 11 | $9,800 |
| Police - Other | 10 | $51,534 | $61,841 | 25 | $14,296 |
| Other and Unallocable | 5 | $27,590 | $66,216 | 8 | $8,510 |
| Financial Administration | 4 | $38,832 | $116,496 | 1 | $3,482 |
| Parks and Recreation | 3 | $11,358 | $45,432 | 36 | $20,171 |
| Firefighters | 2 | $21,653 | $129,918 | 82 | $173,208 |
| Welfare | 1 | $4,332 | $51,984 | 6 | $4,306 |
| Fire - Other | 0 | $0 | 2 | $2,674 | |
| Judicial and Legal | 0 | $0 | 1 | $2,916 | |
| Health | 0 | $0 | 1 | $1,360 | |
| Totals for Government | 155 | $1,035,692 | $80,183 | 185 | $258,252 |
Evergreen Park government finances - Expenditure in 2018 (per resident):
- Construction - General - Other: $163,000 ($8.48)
Regular Highways: $84,000 ($4.37)
Central Staff Services: $73,000 ($3.80)
Parks and Recreation: $5,000 ($0.26)
- Current Operations - Police Protection: $8,673,000 ($451.46)
Financial Administration: $5,044,000 ($262.56)
Water Utilities: $3,908,000 ($203.43)
General - Other: $3,240,000 ($168.65)
Local Fire Protection: $2,903,000 ($151.11)
Regular Highways: $2,847,000 ($148.20)
Solid Waste Management: $1,596,000 ($83.08)
Parks and Recreation: $1,369,000 ($71.26)
Central Staff Services: $864,000 ($44.97)
Judicial and Legal Services: $518,000 ($26.96)
Protective Inspection and Regulation - Other: $436,000 ($22.70)
General Public Buildings: $410,000 ($21.34)
Libraries: $32,000 ($1.67)
- General - Interest on Debt: $1,088,000 ($56.63)
- Other Capital Outlay - Central Staff Services: $646,000 ($33.63)
Police Protection: $470,000 ($24.47)
Solid Waste Management: $286,000 ($14.89)
Parking Facilities: $156,000 ($8.12)
Parks and Recreation: $59,000 ($3.07)
Regular Highways: $20,000 ($1.04)
- Total Salaries and Wages: $14,399,000 ($749.52)
Evergreen Park government finances - Revenue in 2018 (per resident):
- Charges - Solid Waste Management: $1,727,000 ($89.90)
Other: $1,511,000 ($78.65)
Sewerage: $1,220,000 ($63.51)
Parks and Recreation: $562,000 ($29.25)
- Federal Intergovernmental - Public Welfare: $226,000 ($11.76)
General Local Government Support: $120,000 ($6.25)
- Miscellaneous - General Revenue - Other: $1,793,000 ($93.33)
Fines and Forfeits: $308,000 ($16.03)
Interest Earnings: $173,000 ($9.01)
- Revenue - Water Utilities: $5,596,000 ($291.29)
- State Intergovernmental - General Local Government Support: $7,363,000 ($383.27)
Highways: $1,960,000 ($102.02)
Public Welfare: $8,000 ($0.42)
- Tax - Property: $6,898,000 ($359.07)
General Sales and Gross Receipts: $2,368,000 ($123.26)
Other License: $2,186,000 ($113.79)
Public Utilities Sales: $478,000 ($24.88)
Other Selective Sales: $391,000 ($20.35)
Evergreen Park government finances - Debt in 2018 (per resident):
- Long Term Debt - Beginning Outstanding - Unspecified Public Purpose: $25,903,000 ($1348.34)
Outstanding Unspecified Public Purpose: $24,195,000 ($1259.43)
Retired Unspecified Public Purpose: $1,708,000 ($88.91)
Evergreen Park government finances - Cash and Securities in 2018 (per resident):
- Other Funds - Cash and Securities: $15,818,000 ($823.38)
3.53% of this county's 2021 resident taxpayers lived in other counties in 2020 ($82,405 average adjusted gross income)
| Here: | 3.53% |
| Illinois average: | 5.09% |
0.01% of residents moved from foreign countries ($114 average AGI)
Cook County: 0.01% Illinois average: 0.01%
Top counties from which taxpayers relocated into this county between 2020 and 2021:
| from DuPage County, IL | |
| from Lake County, IL | |
| from Will County, IL |
5.44% of this county's 2020 resident taxpayers moved to other counties in 2021 ($120,340 average adjusted gross income)
| Here: | 5.44% |
| Illinois average: | 6.10% |
0.01% of residents moved to foreign countries ($140 average AGI)
Cook County: 0.01% Illinois average: 0.01%
Top counties to which taxpayers relocated from this county between 2020 and 2021:
| to DuPage County, IL | |
| to Will County, IL | |
| to Lake County, IL |
| Businesses in Evergreen Park, IL | ||||
| Name | Count | Name | Count | |
|---|---|---|---|---|
| 7-Eleven | 2 | Lane Bryant | 1 | |
| Ace Hardware | 1 | Lane Furniture | 1 | |
| Applebee's | 1 | LensCrafters | 1 | |
| Avenue | 1 | McDonald's | 2 | |
| Baskin-Robbins | 2 | Men's Wearhouse | 1 | |
| Blockbuster | 1 | Nike | 5 | |
| CVS | 1 | OfficeMax | 1 | |
| Carson Pirie Scott | 1 | Payless | 1 | |
| Casual Male XL | 1 | Sam's Club | 1 | |
| Circle K | 2 | Shoe Carnival | 1 | |
| Cricket Wireless | 1 | Sprint Nextel | 1 | |
| Dunkin Donuts | 2 | The Athlete's Foot | 1 | |
| FedEx | 3 | Toys"R"Us | 1 | |
| Foot Locker | 1 | UPS | 2 | |
| GNC | 1 | Walgreens | 2 | |
| GameStop | 1 | Walmart | 1 | |
| Jimmy Jazz | 1 | White Castle | 1 | |
| Jones New York | 1 | |||
Strongest AM radio stations in Evergreen Park:
- WGCI (1390 AM; 5 kW; CHICAGO, IL; Owner: AMFM RADIO LICENSES, L.L.C.)
- WVIV (1200 AM; 20 kW; CHICAGO, IL; Owner: WLXX-AM LICENSE CORP.)
- WLS (890 AM; 50 kW; CHICAGO, IL; Owner: WLS, INC.)
- WMVP (1000 AM; 50 kW; CHICAGO, IL; Owner: ABC, INC.)
- WRDZ (1300 AM; 4 kW; LA GRANGE, IL; Owner: ABC, INC.)
- WYLL (1160 AM; 50 kW; CHICAGO, IL; Owner: SCA LICENSE CORPORATION)
- WSCR (670 AM; 50 kW; CHICAGO, IL; Owner: INFINITY BROADCASTING OPERATIONS, INC.)
- WBBM (780 AM; 50 kW; CHICAGO, IL; Owner: INFINITY BROADCASTING OPERATIONS, INC.)
- WGN (720 AM; 50 kW; CHICAGO, IL; Owner: WGN CONTINENTAL BROADCASTING CO.)
- WNWI (1080 AM; 3 kW; OAK LAWN, IL; Owner: BIRACH BROADCASTING CORPORATION)
- WNTD (950 AM; 5 kW; CHICAGO, IL; Owner: RADIO UNICA OF CHICAGO LICENSE CORP.)
- WCSN (820 AM; 5 kW; CHICAGO, IL; Owner: WYPA, INC.)
- WIND (560 AM; 5 kW; CHICAGO, IL; Owner: TICHENOR LICENSE CORPORATION ("TLC"))
Strongest FM radio stations in Evergreen Park:
- WXAV (88.3 FM; CHICAGO, IL; Owner: ST. XAVIER COLLEGE)
- WCKG (105.9 FM; ELMWOOD PARK, IL; Owner: INFINITY HOLDINGS CORPORATION OF ORLANDO)
- WLIT-FM (93.9 FM; CHICAGO, IL; Owner: AMFM RADIO LICENSES, L.L.C.)
- WJMK (104.3 FM; CHICAGO, IL; Owner: INFINITY BROADCASTING CORP. OF ILLINOIS)
- WNUA (95.5 FM; CHICAGO, IL; Owner: AMFM RADIO LICENSES, L.L.C.)
- WTMX (101.9 FM; SKOKIE, IL; Owner: BONNEVILLE HOLDING COMPANY)
- WBBM-FM (96.3 FM; CHICAGO, IL; Owner: INFINITY BROADCASTING OPERATIONS, INC.)
- WKSC-FM (103.5 FM; CHICAGO, IL; Owner: AMFM RADIO LICENSES, L.L.C.)
- WFMT (98.7 FM; CHICAGO, IL; Owner: WINDOW TO THE WORLD COMMUNICATIONS)
- WZZN (94.7 FM; CHICAGO, IL; Owner: ABC CHICAGO FM RADIO,INC.)
- WGCI-FM (107.5 FM; CHICAGO, IL; Owner: AMFM RADIO LICENSES, L.L.C.)
- WDRV (97.1 FM; CHICAGO, IL; Owner: BONNEVILLE HOLDING COMPANY)
- WBEZ (91.5 FM; CHICAGO, IL; Owner: THE WBEZ ALLIANCE, INC.)
- WKQX (101.1 FM; CHICAGO, IL; Owner: EMMIS RADIO LICENSE CORPORATION)
- WLUP-FM (97.9 FM; CHICAGO, IL; Owner: BONNEVILLE HOLDING COMPANY)
- WNND (100.3 FM; CHICAGO, IL; Owner: BONNEVILLE HOLDING COMPANY)
- WOJO (105.1 FM; EVANSTON, IL; Owner: TICHENOR LICENSE CORPORATION ("TLC"))
- WUSN (99.5 FM; CHICAGO, IL; Owner: INFINITY BROADCASTING CORPORATION OF CHICAGO)
- WVAZ (102.7 FM; OAK PARK, IL; Owner: AMFM RADIO LICENSES, L.L.C.)
- WXRT-FM (93.1 FM; CHICAGO, IL; Owner: INFINITY BROADCASTING OPERATIONS, INC.)
TV broadcast stations around Evergreen Park:
- WLS-TV (Channel 7; CHICAGO, IL; Owner: WLS TELEVISION, INC.)
- WMAQ-TV (Channel 5; CHICAGO, IL; Owner: NBC SUBSIDIARY (WMAQ-TV), INC.)
- WTTW (Channel 11; CHICAGO, IL; Owner: WINDOW TO THE WORLD COMMUNICATIONS, INC.)
- WGN-TV (Channel 9; CHICAGO, IL; Owner: WGN CONTINENTAL BROADCASTING COMPANY)
- WGBO-TV (Channel 66; JOLIET, IL; Owner: WGBO LICENSE PARTNERSHIP, G.P.)
- WPWR-TV (Channel 50; GARY, IN; Owner: FOX TELEVISION STATIONS, INC.)
- WXFT (Channel 60; AURORA, IL; Owner: TELEFUTURA CHICAGO LLC)
- WCIU-TV (Channel 26; CHICAGO, IL; Owner: WCIU-TV LIMITED PARTNERSHIP)
- WCPX (Channel 38; CHICAGO, IL; Owner: PAXSON CHICAGO LICENSE, INC.)
- WBBM-TV (Channel 2; CHICAGO, IL; Owner: CBS BROADCASTING INC.)
- WFLD (Channel 32; CHICAGO, IL; Owner: FOX TELEVISION STATIONS, INC.)
- W68DO (Channel 68; PALATINE, IL; Owner: TRINITY BROADCASTING NETWORK)
- WFBT-CA (Channel 23; CHICAGO, IL; Owner: CHANNEL 23 LIMITED PARTNERSHIP)
- WJYS (Channel 62; HAMMOND, IN; Owner: JOVON BROADCASTING CORPORATION)
- WSNS-TV (Channel 44; CHICAGO, IL; Owner: TELEMUNDO OF CHICAGO, INC.)
- WOCH-LP (Channel 28; CHICAGO, IL; Owner: KM LPTV OF CHICAGO-28, L.L.C.)
- WYCC (Channel 20; CHICAGO, IL; Owner: COLLEGE DIST. #508, COUNTY OF COOK)
- WOCK-CA (Channel 13; CHICAGO, IL; Owner: KM LPTV OF CHICAGO-13, L.L.C.)
- WYIN (Channel 56; GARY, IN; Owner: NORTHWEST INDIANA PUBLIC BROADCASTING, INC.)
- W34CK (Channel 34; ARLINGTON HEIGHTS, IL; Owner: FIRST UNITED, INC.)
- W54AP (Channel 54; BLUE ISLAND, IL; Owner: CATHOLIC VIEWS BROADCASTS, INC.)
- W64CQ (Channel 64; ARLINGTON HEIGHTS, IL; Owner: TRINITY BROADCASTING NETWORK)
FCC Registered Antenna Towers:
26 (See the full list of FCC Registered Antenna Towers in Evergreen Park)FCC Registered Private Land Mobile Towers:
1 (See the full list of FCC Registered Private Land Mobile Towers in Evergreen Park, IL)FCC Registered Broadcast Land Mobile Towers:
12 (See the full list of FCC Registered Broadcast Land Mobile Towers)FCC Registered Microwave Towers:
6- Evergreen Park, 8952 S. California Ave. (Lat: 41.730556 Lon: -87.692500), Type: Tower, Structure height: 31.1 m, Overall height: 32 m, Call Sign: WQJD343,
Assigned Frequencies: 11365.0 MHz, Grant Date: 07/30/2008, Expiration Date: 07/30/2018, Cancellation Date: 01/30/2010, Certifier: Willaim Chastain, Registrant: Radio Dynamics Corporation, Silver Spring, MD 20914, Phone: (301) 493-5171, Fax: (301) 576-4553, Email:
- IL-CHI5700, 8900 S. California Ave. (Lat: 41.730722 Lon: -87.692722), Type: Tower, Structure height: 25.9 m, Overall height: 28.3 m, Call Sign: WQKP659,
Assigned Frequencies: 21825.0 MHz, 21925.0 MHz, Grant Date: 08/20/2019, Expiration Date: 08/04/2029, Cancellation Date: 09/08/2021, Certifier: Nadja S Sodos-Wallace, Registrant: T-Mobile Usa, Inc., 12920 Se 38th Street, Bellevue, WA 98006, Phone: (425) 383-8401, Fax: (425) 383-4840, Email:
- IL-CHI5650, 9730 S. Western Ave (Lat: 41.716444 Lon: -87.682917), Type: Bant, Structure height: 34.1 m, Overall height: 37.2 m, Call Sign: WQLB999,
Assigned Frequencies: 17815.0 MHz, 21925.0 MHz, 17915.0 MHz, 22075.0 MHz, Grant Date: 01/14/2020, Expiration Date: 11/30/2029, Cancellation Date: 09/08/2021, Certifier: Nadja S Sodos-Wallace, Registrant: T-Mobile Usa, Inc., 12920 Se 38th Street, Bellevue, WA 98006, Phone: (425) 383-8401, Fax: (425) 383-4840, Email:
- IL-CHI5700, 8900 S. California Ave. (Lat: 41.734389 Lon: -87.692722), Type: Pole, Structure height: 25.9 m, Overall height: 26.8 m, Call Sign: WQLC363,
Assigned Frequencies: 19525.0 MHz, 19625.0 MHz, Grant Date: 01/14/2020, Expiration Date: 12/01/2029, Cancellation Date: 09/08/2021, Certifier: Nadja S Sodos-Wallace, Registrant: T-Mobile Usa, Inc., 12920 Se 38th Street, Bellevue, WA 98006, Phone: (425) 383-8401, Fax: (425) 383-4840, Email:
- EVERGREEN PARK, Lat: 41.727778 Lon: -87.712500, Call Sign: WQPT604,
Assigned Frequencies: 956.306 MHz, Grant Date: 08/13/2012, Expiration Date: 08/13/2022, Cancellation Date: 10/15/2022, Certifier: Robert Schiller, Registrant: Sensus, 450 N Gallatin Avenue, Uniontown, PA 15401, Phone: (800) 638-3748, Fax: (800) 888-2403, Email:
- Evergreen Park, Lat: 41.725278 Lon: -87.710556, Call Sign: WRYF201,
Assigned Frequencies: 956.306 MHz, Grant Date: 08/01/2023, Expiration Date: 08/01/2033, Certifier: Gerald R Bennett, Registrant: Sensus, 450 N Gallatin Avenue, Uniontown, PA 15401, Phone: (800) 638-3748, Fax: (800) 888-2403, Email:
FCC Registered Amateur Radio Licenses:
50 (See the full list of FCC Registered Amateur Radio Licenses in Evergreen Park)FAA Registered Aircraft:
2- Aircraft: VANS AIRCRAFT INC RV-12 (Category: Land, Seats: 2, Weight: Up to 12,499 Pounds), Engine: ROTAX 912ULS SERIES (100 HP) (4 Cycle)
N-Number: 5795T, N5795T, N-5795T, Serial Number: 120777, Year manufactured: 2015, Airworthiness Date: 08/06/2015, Certificate Issue Date: 01/27/2015
Registrant (Individual): Robert C Kopeika, 10125 S Central Park Ave, Evergreen Park, IL 60805 - Aircraft: COLLINS RONALD R RANS S-17 (Category: Land, Weight: Up to 12,499 Pounds), Engine: ROTAX 503 DCDI (52 HP) (2 Cycle)
N-Number: 3518D, N3518D, N-3518D, Serial Number: 0402035, Year manufactured: 2007, Airworthiness Date: 10/12/2007
Registrant (Individual): Reported Sale, 9538 S Francisco Ave, Evergreen Park, IL 60805
Deregistered: Cancel Date: 04/10/2020
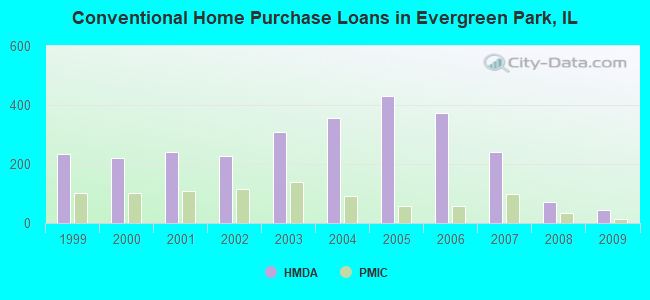
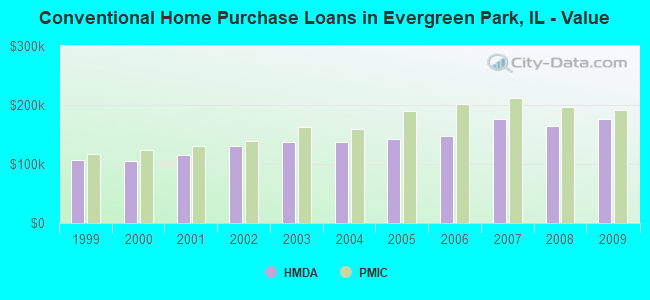
| Home Mortgage Disclosure Act Aggregated Statistics For Year 2009 (Based on 3 full and 1 partial tracts) | ||||||||||||||
| A) FHA, FSA/RHS & VA Home Purchase Loans | B) Conventional Home Purchase Loans | C) Refinancings | D) Home Improvement Loans | E) Loans on Dwellings For 5+ Families | F) Non-occupant Loans on < 5 Family Dwellings (A B C & D) | G) Loans On Manufactured Home Dwelling (A B C & D) | ||||||||
|---|---|---|---|---|---|---|---|---|---|---|---|---|---|---|
| Number | Average Value | Number | Average Value | Number | Average Value | Number | Average Value | Number | Average Value | Number | Average Value | Number | Average Value | |
| LOANS ORIGINATED | 105 | $174,607 | 43 | $175,697 | 446 | $171,221 | 26 | $71,193 | 2 | $317,175 | 15 | $140,457 | 1 | $114,440 |
| APPLICATIONS APPROVED, NOT ACCEPTED | 2 | $180,500 | 4 | $226,250 | 36 | $182,268 | 4 | $18,798 | 1 | $450,000 | 0 | $0 | 0 | $0 |
| APPLICATIONS DENIED | 13 | $131,531 | 8 | $167,530 | 163 | $186,239 | 22 | $30,447 | 0 | $0 | 11 | $148,226 | 0 | $0 |
| APPLICATIONS WITHDRAWN | 7 | $154,081 | 6 | $204,183 | 61 | $193,098 | 5 | $128,364 | 0 | $0 | 2 | $145,500 | 0 | $0 |
| FILES CLOSED FOR INCOMPLETENESS | 3 | $185,510 | 0 | $0 | 29 | $190,402 | 2 | $118,300 | 0 | $0 | 1 | $151,000 | 0 | $0 |
Detailed HMDA statistics for the following Tracts: 8216.00 , 8217.00, 8218.00, 8219.00
| Private Mortgage Insurance Companies Aggregated Statistics For Year 2009 (Based on 3 full and 1 partial tracts) | ||||
| A) Conventional Home Purchase Loans | B) Refinancings | |||
|---|---|---|---|---|
| Number | Average Value | Number | Average Value | |
| LOANS ORIGINATED | 15 | $191,515 | 9 | $195,783 |
| APPLICATIONS APPROVED, NOT ACCEPTED | 5 | $183,628 | 1 | $174,000 |
| APPLICATIONS DENIED | 3 | $157,697 | 4 | $209,115 |
| APPLICATIONS WITHDRAWN | 0 | $0 | 1 | $396,000 |
| FILES CLOSED FOR INCOMPLETENESS | 0 | $0 | 0 | $0 |
Detailed PMIC statistics for the following Tracts: 8216.00 , 8217.00, 8218.00, 8219.00
2002 - 2018 National Fire Incident Reporting System (NFIRS) incidents
- Fire incident types reported to NFIRS in Evergreen Park, IL
- 55551.8%Structure Fires
- 31028.9%Outside Fires
- 13612.7%Mobile Property/Vehicle Fires
- 706.5%Other
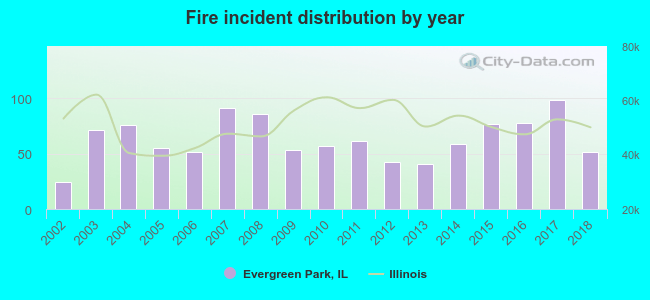 Based on the data from the years 2002 - 2018 the average number of fires per year is 63. The highest number of fire incidents - 98 took place in 2017, and the least - 24 in 2002. The data has an increasing trend.
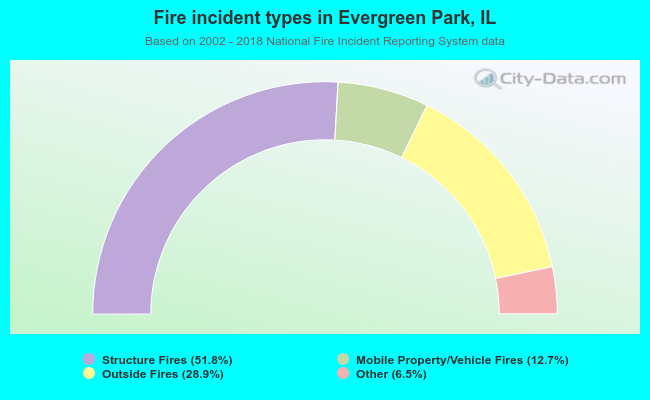 When looking into fire subcategories, the most incidents belonged to: Structure Fires (51.8%), and Outside Fires (28.9%).
| Most common first names in Evergreen Park, IL among deceased individuals | ||
| Name | Count | Lived (average) |
|---|---|---|
| Mary | 116 | 81.7 years |
| John | 116 | 79.0 years |
| Helen | 65 | 85.0 years |
| Joseph | 61 | 79.3 years |
| James | 60 | 71.9 years |
| William | 59 | 78.0 years |
| Robert | 56 | 75.7 years |
| Margaret | 49 | 85.6 years |
| George | 40 | 80.1 years |
| Thomas | 36 | 74.7 years |
| Most common last names in Evergreen Park, IL among deceased individuals | ||
| Last name | Count | Lived (average) |
|---|---|---|
| Johnson | 31 | 79.4 years |
| Smith | 17 | 76.8 years |
| Williams | 15 | 79.5 years |
| Brown | 11 | 75.3 years |
| Murphy | 9 | 79.4 years |
| Jones | 8 | 78.0 years |
| Quinn | 8 | 80.1 years |
| Robinson | 7 | 75.7 years |
| Davis | 7 | 74.4 years |
| Nelson | 7 | 82.3 years |
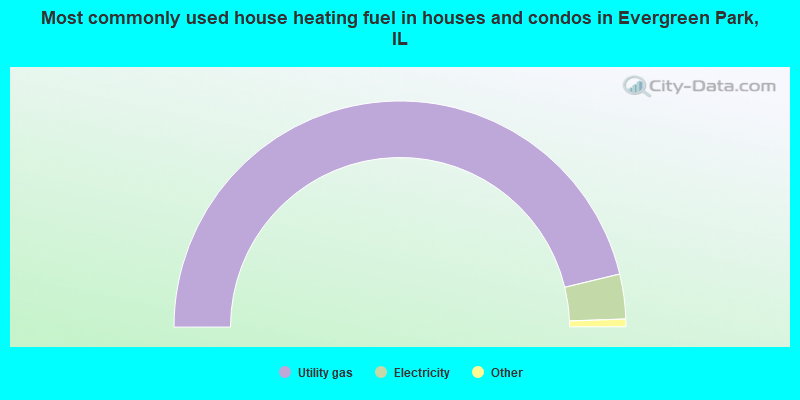
- 92.5%Utility gas
- 6.4%Electricity
- 0.5%Bottled, tank, or LP gas
- 0.4%Other fuel
- 0.1%No fuel used
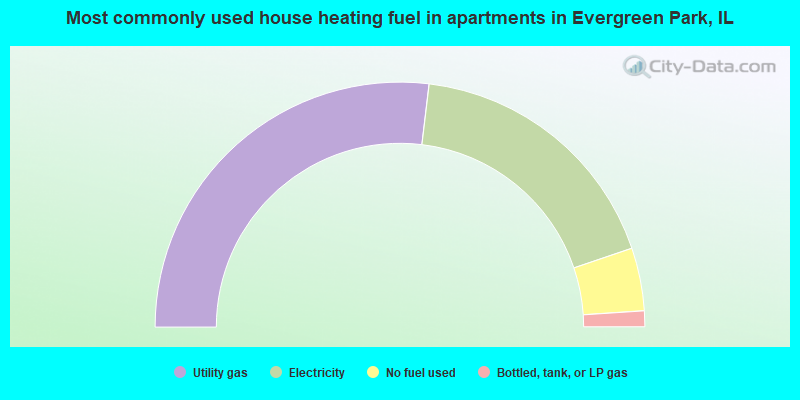
- 53.8%Utility gas
- 35.8%Electricity
- 8.3%No fuel used
- 2.1%Bottled, tank, or LP gas
Evergreen Park compared to Illinois state average:
- Unemployed percentage significantly below state average.
- Foreign-born population percentage below state average.
- Renting percentage below state average.
- Length of stay since moving in above state average.
- Percentage of population with a bachelor's degree or higher above state average.
Evergreen Park on our top lists:
- #42 on the list of "Top 101 cities with the largest percentage of high school students in private schools (500+ students)"
- #84 on the list of "Top 101 cities with the largest percentage of elementary and middle school students in private schools (1,000+ students)"
- #93 on the list of "Top 101 cities with the most people taking a bus, a trolley bus, a streetcar, or a trolley car to work (population 5,000+)"
- #1 on the list of "Top 101 counties with the most Black Protestant congregations"
- #1 on the list of "Top 101 counties with the most Catholic congregations"
- #1 on the list of "Top 101 counties with the highest surface withdrawal of fresh water for public supply"
- #2 on the list of "Top 101 counties with the most Black Protestant adherents"
- #2 on the list of "Top 101 counties with the most Orthodox congregations (pop. 50,000+)"

|
|
Total of 15 patent applications in 2008-2024.