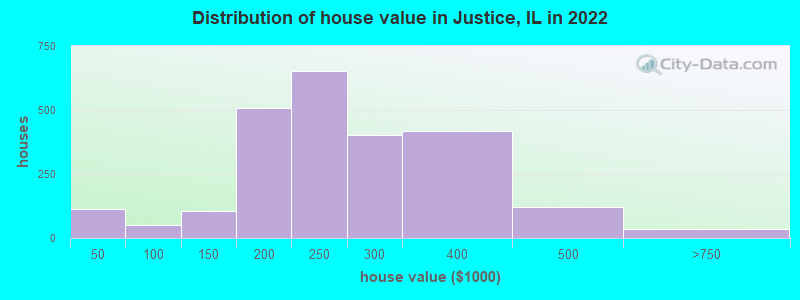
Estimated median house or condo value in 2022: $234,593 (it was $140,300 in 2000)
Justice:
$234,593
IL:
$251,600
Mean prices in 2022:all housing units: $229,645; detached houses: $262,202; townhouses or other attached units: $199,595; in 3-to-4-unit structures: $308,530; in 5-or-more-unit structures: $133,699; mobile homes: $25,872
Median gross rent in 2022: $1,179.
March 2022 cost of living index in Justice: 101.4 (near average, U.S. average is 100)
Percentage of residents living in poverty in 2022: 21.9%
(22.9% for White Non-Hispanic residents, 31.7% for Black residents, 14.8% for Hispanic or Latino residents, 0.8% for two or more races residents)
According to our research of Illinois and other state lists, there were 7 registered sex offenders living in Justice, Illinois as of May 19, 2024. The ratio of all residents to sex offenders in Justice is 1,842 to 1. The ratio of registered sex offenders to all residents in this city is lower than the state average.
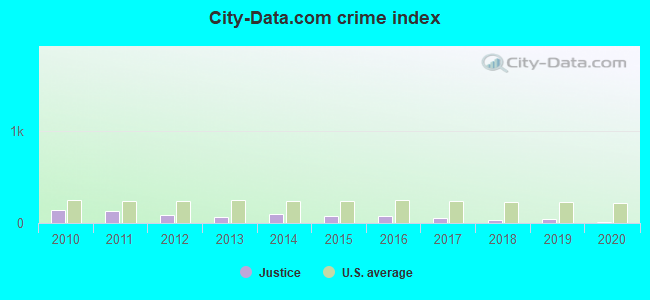
Crime rates in Justice by year
Type
2010
2011
2012
2013
2014
2015
2016
2017
2018
2019
2020
Murders (per 100,000)
0 (0.0)
1 (7.7)
0 (0.0)
0 (0.0)
0 (0.0)
0 (0.0)
0 (0.0)
0 (0.0)
0 (0.0)
0 (0.0)
0 (0.0)
Rapes (per 100,000)
3 (23.2)
2 (15.4)
1 (7.7)
0 (0.0)
2 (15.3)
0 (0.0)
1 (7.7)
0 (0.0)
1 (7.8)
2 (15.8)
0 (0.0)
Robberies (per 100,000)
8 (61.9)
2 (15.4)
3 (23.1)
3 (23.0)
4 (30.6)
6 (46.0)
5 (38.5)
3 (23.4)
2 (15.6)
2 (15.8)
0 (0.0)
Assaults (per 100,000)
12 (92.8)
6 (46.3)
12 (92.4)
7 (53.6)
12 (91.9)
10 (76.7)
6 (46.2)
6 (46.8)
4 (31.2)
0 (0.0)
2 (15.9)
Burglaries (per 100,000)
69 (533.8)
63 (485.9)
36 (277.2)
21 (160.9)
27 (206.8)
28 (214.7)
28 (215.8)
17 (132.5)
4 (31.2)
24 (189.2)
0 (0.0)
Thefts (per 100,000)
110 (851.0)
116 (894.7)
90 (692.9)
75 (574.5)
88 (674.1)
89 (682.3)
95 (732.2)
32 (249.4)
21 (163.8)
32 (252.3)
12 (95.5)
Auto thefts (per 100,000)
17 (131.5)
26 (200.5)
13 (100.1)
15 (114.9)
18 (137.9)
10 (76.7)
14 (107.9)
34 (265.0)
4 (31.2)
3 (23.7)
0 (0.0)
Arson (per 100,000)
0 (0.0)
0 (0.0)
0 (0.0)
0 (0.0)
9 (68.9)
0 (0.0)
2 (15.4)
0 (0.0)
0 (0.0)
0 (0.0)
0 (0.0)
City-Data.com crime index
137.6
127.5
86.7
61.0
92.3
77.6
80.0
56.8
28.4
42.6
7.0
The City-Data.com crime index weighs serious crimes and violent crimes more heavily. Higher means more crime, U.S. average is 246.1. It adjusts for the number of visitors and daily workers commuting into cities.
Population density: 4,190 people per square mile (average).
3,186 residents are foreign born (14.3% Europe, 7.7% Asia, 3.1% Latin America).
This village:
26.0%
Illinois:
14.1%
Median real estate property taxes paid for housing units with mortgages in 2022: $5,194 (2.2%) Median real estate property taxes paid for housing units with no mortgage in 2022: $4,966 (2.2%)
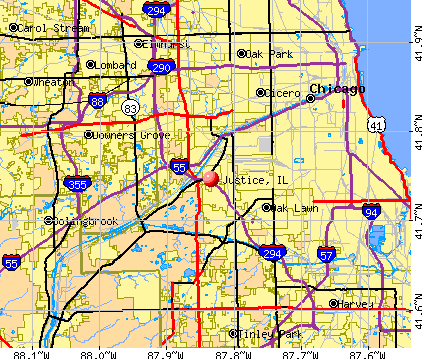
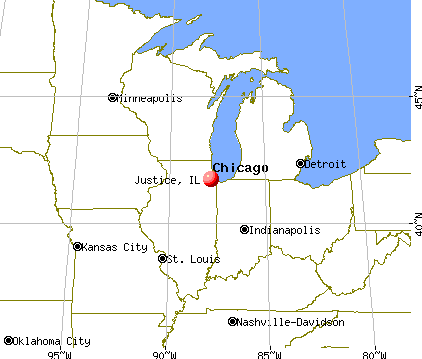
Nearest city with pop. 50,000+: Oak Lawn, IL (4.7 miles , pop. 55,245).
Nearest city with pop. 200,000+: Chicago, IL (10.3 miles , pop. 2,896,016).
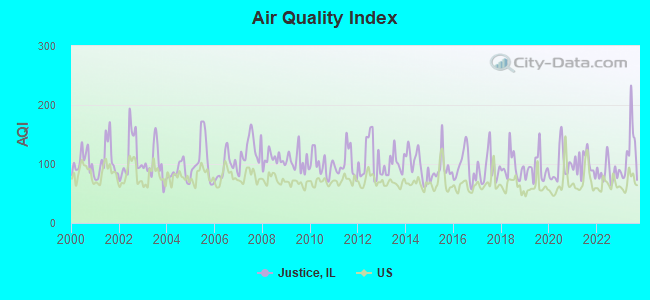
Air Quality Index (AQI) level in 2023 was 119. This is significantly worse than average.
City:
119
U.S.:
73
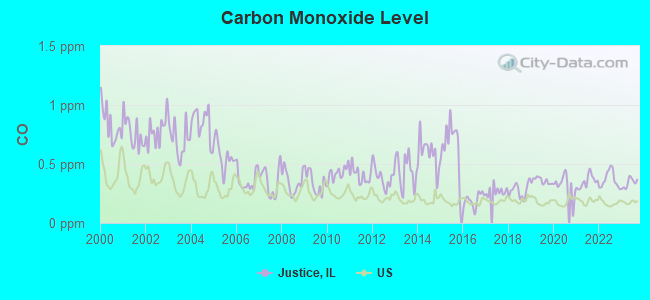
Carbon Monoxide (CO) [ppm] level in 2023 was 0.339. This is worse than average.Closest monitor was 5.3 miles away from the city center.
City:
0.339
U.S.:
0.251
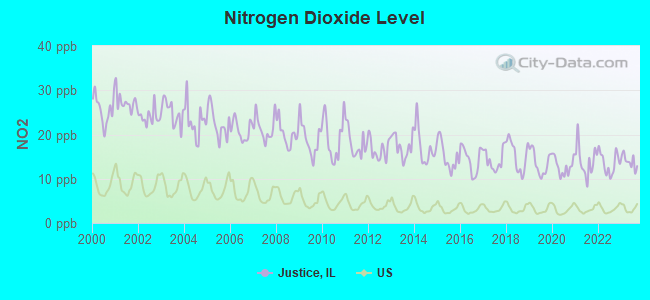
Nitrogen Dioxide (NO2) [ppb] level in 2023 was 13.9. This is significantly worse than average.Closest monitor was 2.9 miles away from the city center.
City:
13.9
U.S.:
5.1
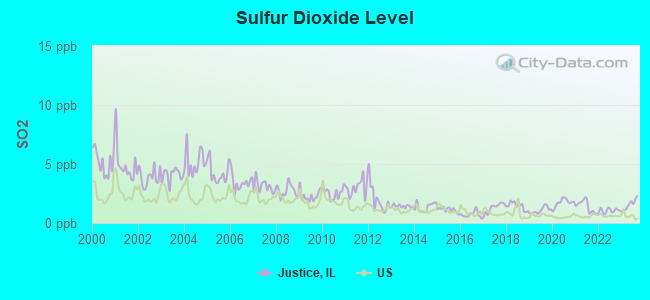
Sulfur Dioxide (SO2) [ppb] level in 2023 was 1.55. This is about average.Closest monitor was 1.9 miles away from the city center.
City:
1.55
U.S.:
1.51
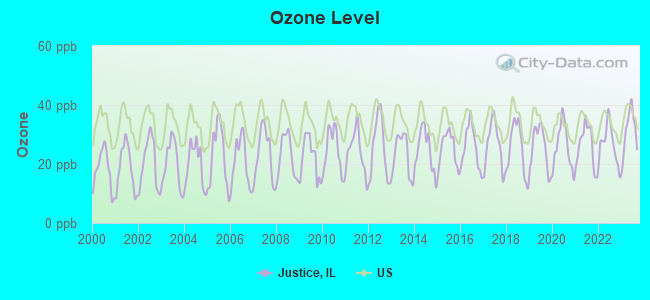
Ozone [ppb] level in 2023 was 31.0. This is about average.Closest monitor was 4.2 miles away from the city center.
City:
31.0
U.S.:
33.3
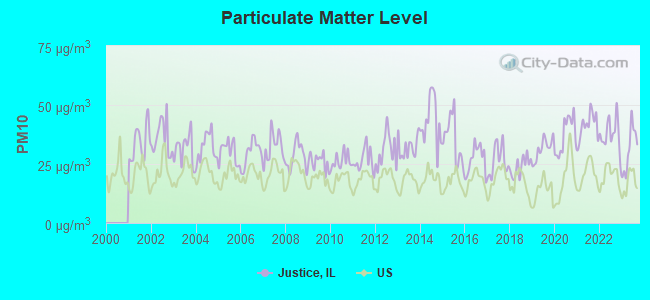
Particulate Matter (PM10) [µg/m3] level in 2023 was 31.2. This is significantly worse than average.Closest monitor was 2.9 miles away from the city center.
City:
31.2
U.S.:
19.2
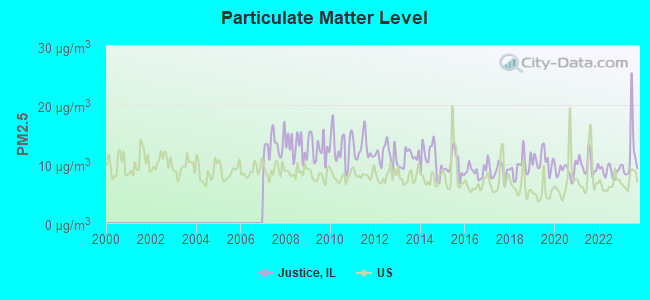
Particulate Matter (PM2.5) [µg/m3] level in 2023 was 11.5. This is significantly worse than average.Closest monitor was 2.9 miles away from the city center.
City:
11.5
U.S.:
8.1
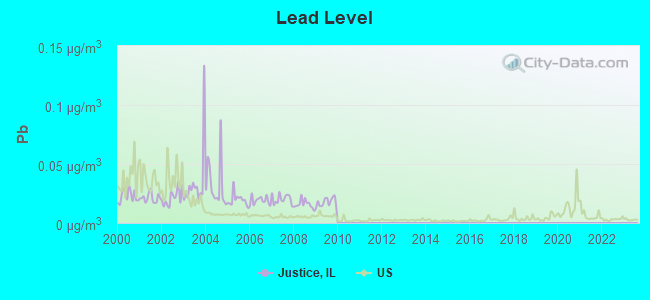
Lead (Pb) [µg/m3] level in 2009 was 0.0176. This is significantly worse than average.Closest monitor was 2.1 miles away from the city center.
City:
0.0176
U.S.:
0.0093
Tornado activity:
Justice-area historical tornado activity is near Illinois state average. It is 52% greater than the overall U.S. average.
On 8/28/1990, a category F5 (max. wind speeds 261-318 mph) tornado 20.8 miles away from the Justice village center killed 29 peopleand injured 350 peopleand causedbetween $50,000 and $500,000 in damages.
On 6/13/1976, a category F4 (max. wind speeds 207-260 mph) tornado 4.6 miles away from the village center killed 2 peopleand injured 23 peopleand causedbetween $500,000 and $5,000,000 in damages.
Earthquake activity:
Justice-area historical earthquake activity is significantly above Illinois state average. It is 43% greater than the overall U.S. average.
On 4/18/2008 at 09:36:59, a magnitude 5.4 (5.1 MB, 4.8 MS, 5.4 MW, 5.2 MW, Class: Moderate, Intensity: VI - VII) earthquake occurred 227.9 miles away from the city center On 6/10/1987 at 23:48:54, a magnitude 5.1 (4.9 MB, 4.4 MS, 4.6 MS, 5.1 LG) earthquake occurred 202.4 miles away from the city center On 4/18/2008 at 09:36:59, a magnitude 5.2 (5.2 MW, Depth: 8.9 mi) earthquake occurred 227.9 miles away from Justice center On 6/28/2004 at 06:10:52, a magnitude 4.2 (4.2 MW, Depth: 6.2 mi, Class: Light, Intensity: IV - V) earthquake occurred 58.6 miles away from the city center On 6/18/2002 at 17:37:15, a magnitude 5.0 (4.3 MB, 4.6 MW, 5.0 LG) earthquake occurred 260.0 miles away from Justice center On 4/18/2008 at 15:14:16, a magnitude 4.8 (4.5 MB, 4.8 MW, 4.6 MW) earthquake occurred 226.2 miles away from Justice center Magnitude types: regional Lg-wave magnitude (LG), body-wave magnitude (MB), surface-wave magnitude (MS), moment magnitude (MW)
Natural disasters:
The number of natural disasters in Cook County (20) is greater than the US average (15). Major Disasters (Presidential) Declared: 15 Emergencies Declared: 4
Causes of natural disasters: Floods: 13, Storms: 12, Tornadoes: 3, Snowstorms: 2, Winter Storms: 2, Blizzard: 1, Hurricane: 1, Snow: 1, Wind: 1, Other: 1 (Note: some incidents may be assigned to more than one category).
Hospitals and medical centers in Justice:
FOREST MED-SURG CENTER (9050 W 81ST STREET)
Other hospitals and medical centers near Justice:
BRIDGEVIEW CONV CTR (Nursing Home, about 2 miles away; BRIDGEVIEW, IL)
BRIDGEVIEW HEALTH CARE CENTER (Nursing Home, about 2 miles away; BRIDGEVIEW, IL)
HICKORY NURSING PAVILION (Nursing Home, about 2 miles away; HICKORY HILLS, IL)
GREENTREE NURSING CENTER (Nursing Home, about 2 miles away; BRIDGEVIEW, IL)
MIDWAY NEUROLOGICAL / REHAB CENTER (Nursing Home, about 2 miles away; BRIDGEVIEW, IL)
EPIC HOME CARE, INC (Home Health Center, about 3 miles away; HICKORY HILLS, IL)
ANCHOR HOME HEALTH CARE AGENCY, INC (Home Health Center, about 3 miles away; PALOS HILLS, IL)
Amtrak stations near Justice:
4 miles: SUMMIT (ARCHER & CENTER AVE.) . Services: public payphones, free short-term parking, free long-term parking, call for taxi service, public transit connection.
6 miles: LA GRANGE ROAD (LA GRANGE, 25 W. BURLINGTON AVE.) . Services: enclosed waiting area, public payphones, taxi stand, public transit connection.
14 miles: CHICAGO (225 S. CANAL ST.) . Services: ticket office, partially wheelchair accessible, enclosed waiting area, public restrooms, public payphones, snack bar, paid short-term parking, paid long-term parking, call for car rental service, taxi stand, public transit connection.
JUSTICE PUBLIC LIBRARY DISTRICT (Operating income: $340,950; Location: 7641 SOUTH OAK GROVE AVENUE; 43,394 books; 1,357 audio materials; 2,208 video materials; 3 state licensed databases; 2 other licensed databases; 54 print serial subscriptions; 1 electronic serial subscriptions)
Notable locations in Justice: Roberts Park Fire Protection District (A), Roberts Park Fire Protection District Station 2 (B). Display/hide their locations on the map
Cook County has a predicted average indoor radon screening level between 2 and 4 pCi/L (pico curies per liter) - Moderate Potential
Drinking water stations with addresses in Justice and their reported violations in the past:
TROY SPORTSMENS CLUB (Population served: 25, Groundwater):
Past monitoring violations:
Monitoring, Source Water (GWR) - In SEP-01-2013, Contaminant: E. COLI. Follow-up actions: St Violation/Reminder Notice (NOV-27-2013), St Compliance achieved (FEB-06-2014)
Monitoring, Repeat Major (TCR) - In AUG-2013, Contaminant: Coliform (TCR). Follow-up actions: St Compliance achieved (OCT-30-2013)
2 routine major monitoring violations
One regular monitoring violation
Average household size:
This village:
2.7 people
Illinois:
2.6 people
Percentage of family households:
This village:
69.9%
Whole state:
65.8%
Percentage of households with unmarried partners:
This village:
7.8%
Whole state:
6.3%
Likely homosexual households (counted as self-reported same-sex unmarried-partner households)
Religion statistics for Justice, IL (based on Cook County data)
Religion
Adherents
Congregations
Catholic
1,947,223
376
Evangelical Protestant
432,975
1,484
Other
312,636
403
Mainline Protestant
202,114
630
Black Protestant
148,895
395
Orthodox
53,276
66
None
2,097,556
-
Source: Clifford Grammich, Kirk Hadaway, Richard Houseal, Dale E.Jones, Alexei Krindatch, Richie Stanley and Richard H.Taylor. 2012. 2010 U.S.Religion Census: Religious Congregations & Membership Study. Association of Statisticians of American Religious Bodies. Jones, Dale E., et al. 2002. Congregations and Membership in the United States 2000. Nashville, TN: Glenmary Research Center. Graphs represent county-level data
Aircraft: CESSNA 172M (Category: Land, Seats: 4, Weight: Up to 12,499 Pounds, Speed: 108 mph), Engine: LYCOMING 0-320 SERIES (180 HP) (4 Cycle) N-Number: 5411H, N5411H, N-5411H, Serial Number: 17265428, Year manufactured: 1975, Airworthiness Date: 06/03/1975, Certificate Issue Date: 06/01/2020 Registrant (Corporation): Earth Grazer Inc, 8828 Concord Ln Unit F, Justice, IL 60458
Aircraft: MESKO EDWARD A CLIP WING SPECIAL (Category: Land, Weight: Up to 12,499 Pounds), Engine: ROTAX 503 DCDI (52 HP) (2 Cycle) N-Number: 154EM, N154EM, N-154EM, Serial Number: 0692-CH0154, Year manufactured: 2006, Airworthiness Date: 11/12/2007, Certificate Issue Date: 06/18/1997 Registrant (Individual): Edward A Mesko, 7926 S 85th Ct, Justice, IL 60458 Deregistered:Cancel Date: 10/31/2020
Home Mortgage Disclosure Act Aggregated Statistics For Year 2009 (Based on 2 partial tracts)
A) FHA, FSA/RHS & VA Home Purchase Loans
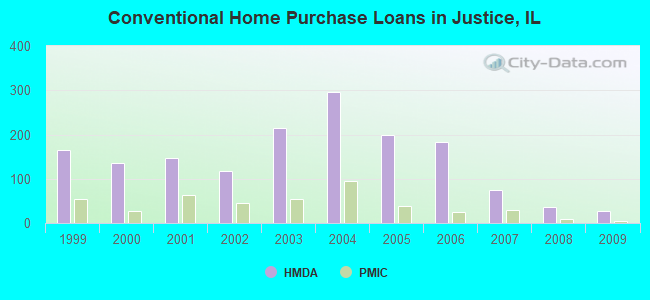
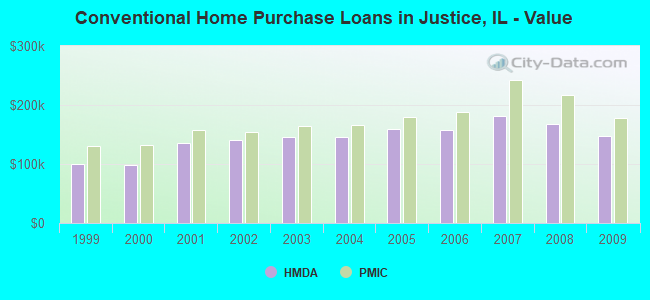
B) Conventional Home Purchase Loans
C) Refinancings
D) Home Improvement Loans
E) Loans on Dwellings For 5+ Families
F) Non-occupant Loans on < 5 Family Dwellings (A B C & D)
G) Loans On Manufactured Home Dwelling (A B C & D)
Number
Average Value
Number
Average Value
Number
Average Value
Number
Average Value
Number
Average Value
Number
Average Value
Number
Average Value
LOANS ORIGINATED
19
$170,395
26
$148,092
122
$163,222
3
$86,390
0
$0
3
$116,580
0
$0
APPLICATIONS APPROVED, NOT ACCEPTED
2
$214,310
9
$110,463
16
$162,463
2
$57,880
0
$0
2
$118,445
0
$0
APPLICATIONS DENIED
9
$160,571
10
$105,466
59
$186,934
3
$49,973
1
$5,548,820
2
$66,550
2
$13,055
APPLICATIONS WITHDRAWN
4
$116,935
2
$203,000
28
$168,251
0
$0
0
$0
1
$174,510
0
$0
FILES CLOSED FOR INCOMPLETENESS
1
$154,030
2
$148,840
15
$167,017
2
$35,630
0
$0
1
$256,590
0
$0
Aggregated Statistics For Year 2008 (Based on 2 partial tracts)
A) FHA, FSA/RHS & VA Home Purchase Loans
B) Conventional Home Purchase Loans
C) Refinancings
D) Home Improvement Loans
E) Loans on Dwellings For 5+ Families
F) Non-occupant Loans on < 5 Family Dwellings (A B C & D)
G) Loans On Manufactured Home Dwelling (A B C & D)
Number
Average Value
Number
Average Value
Number
Average Value
Number
Average Value
Number
Average Value
Number
Average Value
Number
Average Value
LOANS ORIGINATED
4
$228,005
37
$167,132
98
$198,486
8
$117,224
4
$315,580
6
$369,065
0
$0
APPLICATIONS APPROVED, NOT ACCEPTED
0
$0
4
$222,960
17
$184,718
2
$32,220
0
$0
0
$0
1
$14,400
APPLICATIONS DENIED
3
$242,117
14
$178,130
74
$224,816
8
$74,271
0
$0
2
$121,950
5
$40,874
APPLICATIONS WITHDRAWN
1
$174,660
2
$147,000
23
$213,741
2
$203,470
0
$0
2
$320,465
0
$0
FILES CLOSED FOR INCOMPLETENESS
0
$0
3
$187,597
11
$241,837
2
$51,085
0
$0
0
$0
0
$0
Aggregated Statistics For Year 2007 (Based on 2 partial tracts)
A) FHA, FSA/RHS & VA Home Purchase Loans
B) Conventional Home Purchase Loans
C) Refinancings
D) Home Improvement Loans
E) Loans on Dwellings For 5+ Families
F) Non-occupant Loans on < 5 Family Dwellings (A B C & D)
G) Loans On Manufactured Home Dwelling (A B C & D)
Number
Average Value
Number
Average Value
Number
Average Value
Number
Average Value
Number
Average Value
Number
Average Value
Number
Average Value
LOANS ORIGINATED
1
$222,370
75
$180,596
180
$179,231
27
$94,362
7
$1,875,744
7
$187,637
1
$14,400
APPLICATIONS APPROVED, NOT ACCEPTED
1
$221,230
14
$185,699
39
$159,107
4
$64,092
0
$0
1
$204,370
2
$51,175
APPLICATIONS DENIED
1
$121,540
19
$190,433
98
$178,989
18
$95,919
1
$486,280
3
$157,687
7
$35,497
APPLICATIONS WITHDRAWN
0
$0
10
$149,817
35
$175,092
6
$125,067
0
$0
1
$92,950
0
$0
FILES CLOSED FOR INCOMPLETENESS
0
$0
2
$205,395
18
$197,465
1
$180,950
0
$0
0
$0
0
$0
Aggregated Statistics For Year 2006 (Based on 2 partial tracts)
A) FHA, FSA/RHS & VA Home Purchase Loans
B) Conventional Home Purchase Loans
C) Refinancings
D) Home Improvement Loans
E) Loans on Dwellings For 5+ Families
F) Non-occupant Loans on < 5 Family Dwellings (A B C & D)
G) Loans On Manufactured Home Dwelling (A B C & D)
Number
Average Value
Number
Average Value
Number
Average Value
Number
Average Value
Number
Average Value
Number
Average Value
Number
Average Value
LOANS ORIGINATED
2
$235,935
183
$157,884
211
$165,406
22
$71,579
4
$397,692
18
$149,740
4
$27,802
APPLICATIONS APPROVED, NOT ACCEPTED
1
$125,140
22
$147,318
34
$177,433
6
$71,160
0
$0
3
$126,367
2
$32,410
APPLICATIONS DENIED
3
$164,153
42
$116,094
83
$168,602
15
$90,152
0
$0
2
$45,840
11
$36,012
APPLICATIONS WITHDRAWN
0
$0
22
$170,766
46
$181,829
2
$155,995
2
$468,155
5
$135,594
0
$0
FILES CLOSED FOR INCOMPLETENESS
0
$0
3
$235,663
16
$196,906
0
$0
0
$0
2
$214,535
0
$0
Aggregated Statistics For Year 2005 (Based on 2 partial tracts)
A) FHA, FSA/RHS & VA Home Purchase Loans
B) Conventional Home Purchase Loans
C) Refinancings
D) Home Improvement Loans
E) Loans on Dwellings For 5+ Families
F) Non-occupant Loans on < 5 Family Dwellings (A B C & D)
G) Loans On Manufactured Home Dwelling (A B C & D)
Number
Average Value
Number
Average Value
Number
Average Value
Number
Average Value
Number
Average Value
Number
Average Value
Number
Average Value
LOANS ORIGINATED
2
$254,275
198
$158,971
262
$158,531
30
$70,718
6
$446,850
19
$143,899
1
$53,120
APPLICATIONS APPROVED, NOT ACCEPTED
0
$0
25
$164,292
39
$146,721
8
$53,759
0
$0
4
$181,975
2
$47,265
APPLICATIONS DENIED
2
$150,470
63
$143,768
105
$174,074
18
$42,078
0
$0
9
$156,813
14
$33,376
APPLICATIONS WITHDRAWN
0
$0
15
$138,885
71
$183,391
6
$263,408
2
$474,290
6
$203,867
0
$0
FILES CLOSED FOR INCOMPLETENESS
0
$0
8
$140,649
27
$141,487
0
$0
0
$0
2
$110,440
0
$0
Aggregated Statistics For Year 2004 (Based on 2 partial tracts)
A) FHA, FSA/RHS & VA Home Purchase Loans
B) Conventional Home Purchase Loans
C) Refinancings
D) Home Improvement Loans
E) Loans on Dwellings For 5+ Families
F) Non-occupant Loans on < 5 Family Dwellings (A B C & D)
G) Loans On Manufactured Home Dwelling (A B C & D)
Number
Average Value
Number
Average Value
Number
Average Value
Number
Average Value
Number
Average Value
Number
Average Value
Number
Average Value
LOANS ORIGINATED
26
$170,494
296
$145,591
265
$145,571
30
$58,624
14
$311,368
13
$146,316
5
$62,462
APPLICATIONS APPROVED, NOT ACCEPTED
0
$0
25
$139,297
44
$152,525
6
$49,067
0
$0
3
$218,397
2
$40,065
APPLICATIONS DENIED
2
$152,600
54
$123,180
121
$141,151
25
$51,582
0
$0
3
$130,383
12
$45,240
APPLICATIONS WITHDRAWN
7
$172,986
38
$144,924
78
$171,066
6
$72,350
0
$0
5
$129,730
0
$0
FILES CLOSED FOR INCOMPLETENESS
0
$0
4
$109,450
23
$165,763
2
$111,220
0
$0
1
$211,840
2
$43,215
Aggregated Statistics For Year 2003 (Based on 2 partial tracts)
A) FHA, FSA/RHS & VA Home Purchase Loans
B) Conventional Home Purchase Loans
C) Refinancings
D) Home Improvement Loans
E) Loans on Dwellings For 5+ Families
F) Non-occupant Loans on < 5 Family Dwellings (A B C & D)
Number
Average Value
Number
Average Value
Number
Average Value
Number
Average Value
Number
Average Value
Number
Average Value
LOANS ORIGINATED
23
$162,117
215
$146,555
482
$132,442
27
$54,034
11
$251,405
21
$134,450
APPLICATIONS APPROVED, NOT ACCEPTED
0
$0
16
$148,451
70
$138,429
2
$10,985
0
$0
1
$231,450
APPLICATIONS DENIED
2
$158,610
27
$151,285
134
$127,781
9
$33,289
1
$726,770
3
$152,120
APPLICATIONS WITHDRAWN
4
$136,735
23
$136,771
93
$142,629
3
$42,073
0
$0
1
$81,080
FILES CLOSED FOR INCOMPLETENESS
0
$0
6
$182,692
14
$173,432
0
$0
0
$0
2
$107,515
Aggregated Statistics For Year 2002 (Based on 2 partial tracts)
A) FHA, FSA/RHS & VA Home Purchase Loans
B) Conventional Home Purchase Loans
C) Refinancings
D) Home Improvement Loans
E) Loans on Dwellings For 5+ Families
F) Non-occupant Loans on < 5 Family Dwellings (A B C & D)
Number
Average Value
Number
Average Value
Number
Average Value
Number
Average Value
Number
Average Value
Number
Average Value
LOANS ORIGINATED
14
$167,793
118
$140,241
286
$127,917
17
$27,543
9
$1,015,464
7
$147,789
APPLICATIONS APPROVED, NOT ACCEPTED
1
$182,600
15
$90,340
42
$118,832
4
$19,022
0
$0
1
$148,030
APPLICATIONS DENIED
3
$135,520
36
$64,175
77
$115,014
15
$16,257
1
$5,998,720
3
$38,240
APPLICATIONS WITHDRAWN
2
$139,405
7
$149,074
57
$128,289
4
$71,950
0
$0
1
$153,540
FILES CLOSED FOR INCOMPLETENESS
0
$0
2
$112,110
16
$146,349
0
$0
0
$0
0
$0
Aggregated Statistics For Year 2001 (Based on 2 partial tracts)
A) FHA, FSA/RHS & VA Home Purchase Loans
B) Conventional Home Purchase Loans
C) Refinancings
D) Home Improvement Loans
E) Loans on Dwellings For 5+ Families
F) Non-occupant Loans on < 5 Family Dwellings (A B C & D)
Number
Average Value
Number
Average Value
Number
Average Value
Number
Average Value
Number
Average Value
Number
Average Value
LOANS ORIGINATED
9
$181,619
146
$135,998
229
$116,968
15
$25,146
6
$234,690
7
$124,931
APPLICATIONS APPROVED, NOT ACCEPTED
2
$91,085
17
$77,348
27
$99,501
4
$25,250
0
$0
1
$130,540
APPLICATIONS DENIED
1
$107,450
41
$61,880
73
$95,688
9
$15,544
0
$0
3
$85,203
APPLICATIONS WITHDRAWN
2
$144,725
12
$118,772
50
$98,364
3
$33,673
0
$0
2
$83,390
FILES CLOSED FOR INCOMPLETENESS
0
$0
2
$115,360
16
$107,323
0
$0
0
$0
0
$0
Aggregated Statistics For Year 2000 (Based on 2 partial tracts)
A) FHA, FSA/RHS & VA Home Purchase Loans
B) Conventional Home Purchase Loans
C) Refinancings
D) Home Improvement Loans
E) Loans on Dwellings For 5+ Families
F) Non-occupant Loans on < 5 Family Dwellings (A B C & D)
Number
Average Value
Number
Average Value
Number
Average Value
Number
Average Value
Number
Average Value
Number
Average Value
LOANS ORIGINATED
17
$140,580
136
$98,480
51
$86,725
19
$29,075
4
$216,795
4
$137,925
APPLICATIONS APPROVED, NOT ACCEPTED
1
$113,640
11
$78,354
19
$68,219
7
$19,653
0
$0
1
$39,880
APPLICATIONS DENIED
2
$102,950
63
$50,004
45
$75,132
13
$22,777
0
$0
1
$247,040
APPLICATIONS WITHDRAWN
0
$0
10
$119,458
22
$82,184
3
$47,327
0
$0
0
$0
FILES CLOSED FOR INCOMPLETENESS
0
$0
1
$151,620
14
$86,756
0
$0
0
$0
0
$0
Aggregated Statistics For Year 1999 (Based on 2 partial tracts)
A) FHA, FSA/RHS & VA Home Purchase Loans
B) Conventional Home Purchase Loans
C) Refinancings
D) Home Improvement Loans
E) Loans on Dwellings For 5+ Families
F) Non-occupant Loans on < 5 Family Dwellings (A B C & D)
Detailed PMIC statistics for the following Tracts:8206.01
, 8206.02
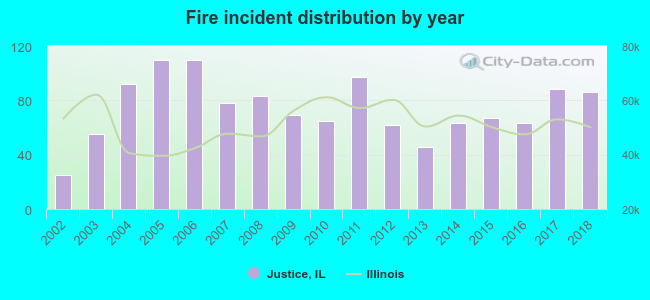
2002 - 2018 National Fire Incident Reporting System (NFIRS) incidents
According to the data from the years 2002 - 2018 the average number of fire incidents per year is 74. The highest number of reported fire incidents - 110 took place in 2005, and the least - 25 in 2002. The data has an increasing trend.
When looking into fire subcategories, the most incidents belonged to: Structure Fires (62.3%), and Outside Fires (20.9%).
Fire incident types reported to NFIRS in Justice, IL


 Recent articles from our blog. Our writers, many of them Ph.D. graduates or candidates, create easy-to-read articles on a wide variety of topics.

 (4.7 miles


 According to the data from the years 2002 - 2018 the average number of fire incidents per year is 74. The highest number of reported fire incidents - 110 took place in 2005, and the least - 25 in 2002. The data has an increasing trend.
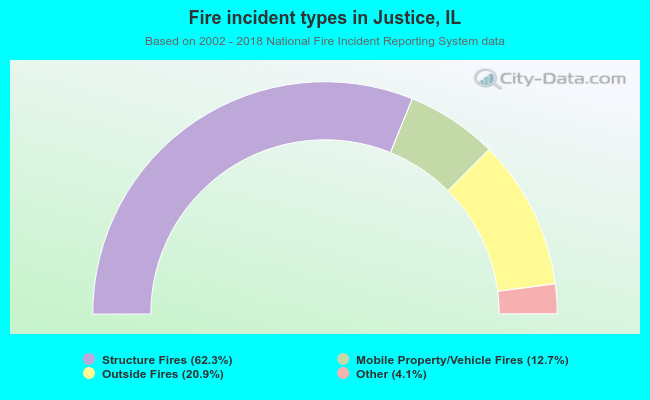 When looking into fire subcategories, the most incidents belonged to: Structure Fires (62.3%), and Outside Fires (20.9%).