Mount Washington, Kentucky
Submit your own pictures of this city and show them to the world
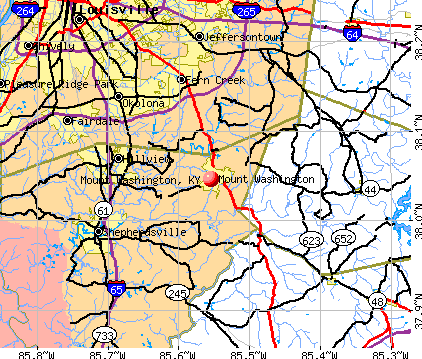
- OSM Map
- General Map
- Google Map
- MSN Map
Population change since 2000: +117.1%
| Males: 9,273 | |
| Females: 9,151 |
| Median resident age: | 37.5 years |
| Kentucky median age: | 39.4 years |
Zip codes: 40047.
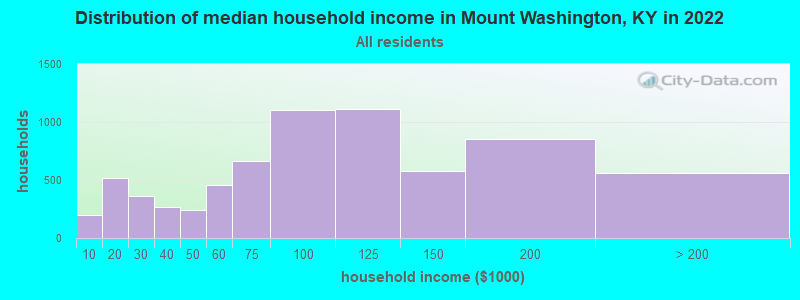
| Mount Washington: | $94,776 |
| KY: | $59,341 |
Estimated per capita income in 2022: $39,616 (it was $18,495 in 2000)
Mount Washington city income, earnings, and wages data
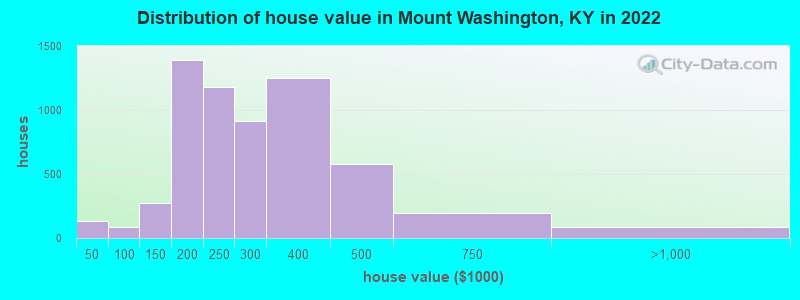
Estimated median house or condo value in 2022: $260,262 (it was $102,400 in 2000)
| Mount Washington: | $260,262 |
| KY: | $196,300 |
Mean prices in 2022: all housing units: $270,054; detached houses: $275,874; townhouses or other attached units: $199,455; in 3-to-4-unit structures: $182,717; in 5-or-more-unit structures: $495,820; mobile homes: $12,668
Median gross rent in 2022: $827.
Mount Washington, KY residents, houses, and apartments details
(5.5% for White Non-Hispanic residents, 34.3% for Hispanic or Latino residents, 34.9% for two or more races residents)
Detailed information about poverty and poor residents in Mount Washington, KY


Compare current foreclosures in Mount Washington, KY:
| Photo | Address | Area | Beds / Baths | Price | Details |
|---|---|---|---|---|---|

|
#1
Highway 44 E
Mount Washington, KY 40047
|
1,020 sq. feet
|
1 baths 3 beds |
show details | |

|
#2
E Woodlake Cir
Mount Washington, KY 40047
|
1,728 sq. feet
|
2 baths 3 beds |
show details | |

|
#3
Lentz Ln
Mount Washington, KY 40047
|
1,032 sq. feet
|
2 baths 3 beds |
show details | |

|
#4
Scenic View Dr
Mount Washington, KY 40047
|
2,044 sq. feet
|
2 baths 4 beds |
show details | |

|
#5
Fisher Ln
Mount Washington, KY 40047
|
1,290 sq. feet
|
1 baths 3 beds |
show details | |

|
#6
Forest Ridge Dr
Mount Washington, KY 40047
|
1,262 sq. feet
|
2 baths 3 beds |
show details | |

|
#7
Forest Ridge Dr
Mount Washington, KY 40047
|
1,230 sq. feet
|
2 baths 3 beds |
show details | |

|
#8
Boaz Ln
Mount Washington, KY 40047
|
2,002 sq. feet
|
2 baths 3 beds |
show details | |

|
#9
Central Blvd Apt 36
Mount Washington, KY 40047
|
1,070 sq. feet
|
2 baths 2 beds |
show details | |

|
#10
Flatlick Rd
Mount Washington, KY 40047
|
1,100 sq. feet
|
1 baths 3 beds |
show details |
| Photo | Address | Area | Beds / Baths | Price | Details |
|---|---|---|---|---|---|

|
#11
Forest Ridge Dr
Mount Washington, KY 40047
|
1,169 sq. feet
|
2 baths 3 beds |
show details | |

|
#12
Fairway Dr
Mount Washington, KY 40047
|
1,630 sq. feet
|
2 baths 3 beds |
show details | |

|
#13
Mark Ave
Mount Washington, KY 40047
|
1,053 sq. feet
|
1 baths 3 beds |
show details | |

|
#14
Probus Dr
Mount Washington, KY 40047
|
1,050 sq. feet
|
1 baths 3 beds |
show details | |

|
#15
Fairway Dr
Mount Washington, KY 40047
|
1,638 sq. feet
|
2 baths 3 beds |
show details | |

|
#16
Stone Creek Ct
Mount Washington, KY 40047
|
1,262 sq. feet
|
2 baths 3 beds |
show details | |

|
#17
Cherry Hill Pkwy
Mount Washington, KY 40047
|
2,796 sq. feet
|
3 baths 4 beds |
show details | |

|
#18
Louise Way # 16
Mount Washington, KY 40047
|
1,497 sq. feet
|
2 baths 3 beds |
show details | |

|
#19
Central Blvd Apt 30
Mount Washington, KY 40047
|
925 sq. feet
|
2 baths 2 beds |
show details | |

|
#20
Flatlick Rd
Mount Washington, KY 40047
|
1,000 sq. feet
|
1 baths 3 beds |
show details |
| Photo | Address | Area | Beds / Baths | Price | Details |
|---|---|---|---|---|---|

|
#21
Helmwood Cir
Mount Washington, KY 40047
|
2,588 sq. feet
|
2 baths 4 beds |
show details | |

|
#22
Deer Park Way
Mount Washington, KY 40047
|
1,344 sq. feet
|
2 baths 3 beds |
show details | |

|
#23
Azure Dr
Mount Washington, KY 40047
|
1,530 sq. feet
|
1 baths - beds |
show details | |

|
#24
Treva Dr Apt 7
Mount Washington, KY 40047
|
- sq. feet
|
- baths - beds |
show details | |

|
#25
Cornell Ave Apt F1
Mount Washington, KY 40047
|
- sq. feet
|
- baths - beds |
show details | |

|
#26
Bald Eagles Cir
Mount Washington, KY 40047
|
- sq. feet
|
- baths - beds |
show details | |

|
#27
Landis Ln
Mount Washington, KY 40047
|
- sq. feet
|
- baths - beds |
show details | |

|
#28
Blue Ridge Cir
Mount Washington, KY 40047
|
- sq. feet
|
- baths - beds |
show details | |

|
#29
Landis Ln Apt 74
Mount Washington, KY 40047
|
- sq. feet
|
- baths - beds |
show details | |

|
#30
Newman Way
Mount Washington, KY 40047
|
1,856 sq. feet
|
- baths - beds |
show details |
| Photo | Address | Area | Beds / Baths | Price | Details |
|---|---|---|---|---|---|

|
#31
Elliot Avenue, Apartment 5
Mount Washington, KY 40047
|
- sq. feet
|
- baths - beds |
show details | |

|
#32
Aulbern Dr W
Mount Washington, KY 40047
|
- sq. feet
|
- baths - beds |
show details | |

|
#33
Harding Dr
Mount Washington, KY 40047
|
1,377 sq. feet
|
- baths - beds |
show details | |

|
#34
Ruby Farm Dr
Mount Washington, KY 40047
|
- sq. feet
|
- baths - beds |
show details | |

|
#35
N Canterbury Dr
Mount Washington, KY 40047
|
- sq. feet
|
- baths - beds |
show details | |

|
#36
Landis Ln Lot No146
Mount Washington, KY 40047
|
- sq. feet
|
- baths - beds |
show details | |

|
#37
Farmview Dr
Mount Washington, KY 40047
|
1,392 sq. feet
|
- baths - beds |
show details | |

|
#38
Copper Creek Dr
Mount Washington, KY 40047
|
- sq. feet
|
- baths - beds |
show details | |

|
#39
Meadow Park Ct
Mount Washington, KY 40047
|
- sq. feet
|
- baths - beds |
show details | |

|
#40
Treva Ct # 4
Mount Washington, KY 40047
|
- sq. feet
|
- baths - beds |
show details |
| Photo | Address | Area | Beds / Baths | Price | Details |
|---|---|---|---|---|---|

|
#41
Park Hill Ln Apt 203
Mount Washington, KY 40047
|
- sq. feet
|
- baths - beds |
show details | |

|
#42
Elder Glen Ct
Mount Washington, KY 40047
|
- sq. feet
|
- baths - beds |
show details | |

|
#43
Fallen Branch Ct
Mount Washington, KY 40047
|
- sq. feet
|
- baths - beds |
show details | |

|
#44
Hubbards Landing Blvd
Mount Washington, KY 40047
|
- sq. feet
|
- baths - beds |
show details | |

|
#45
Sunday Silence Dr
Mount Washington, KY 40047
|
1,592 sq. feet
|
- baths - beds |
show details | |

|
#46
Harding Dr
Mount Washington, KY 40047
|
1,286 sq. feet
|
- baths - beds |
show details | |

|
#47
Biliken Ct
Mount Washington, KY 40047
|
- sq. feet
|
- baths - beds |
show details | |

|
#48
Landis Ln Lot 120
Mount Washington, KY 40047
|
- sq. feet
|
- baths - beds |
show details | |

|
#49
Berger Farm Dr
Mount Washington, KY 40047
|
- sq. feet
|
- baths - beds |
show details | |

|
Check over 1 million property listings on Foreclosure.com!
|
browse all offers | |||


- 16,56191.9%White alone
- 6513.6%Hispanic
- 5503.1%Two or more races
- 1150.6%Other race alone
- 880.5%Asian alone
- 480.3%Black alone
- 30.02%American Indian alone
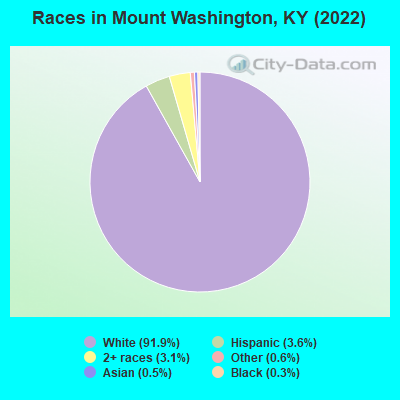
Races in Mount Washington detailed stats: ancestries, foreign born residents, place of birth
According to our research of Kentucky and other state lists, there were 24 registered sex offenders living in Mount Washington, Kentucky as of June 10, 2024.
The ratio of all residents to sex offenders in Mount Washington is 590 to 1.
The ratio of registered sex offenders to all residents in this city is lower than the state average.
Type |
2009 |
2010 |
2011 |
2012 |
2013 |
2014 |
2015 |
2016 |
2017 |
2018 |
2019 |
2020 |
2021 |
2022 |
|---|---|---|---|---|---|---|---|---|---|---|---|---|---|---|
| Murders (per 100,000) | 0 (0.0) | 0 (0.0) | 0 (0.0) | 0 (0.0) | 0 (0.0) | 0 (0.0) | 0 (0.0) | 0 (0.0) | 2 (13.8) | 0 (0.0) | 0 (0.0) | 0 (0.0) | 0 (0.0) | 0 (0.0) |
| Rapes (per 100,000) | 1 (8.1) | 2 (21.9) | 4 (43.6) | 2 (21.7) | 1 (10.7) | 1 (8.2) | 3 (24.2) | 3 (21.2) | 2 (13.8) | 3 (20.4) | 3 (20.2) | 3 (20.0) | 0 (0.0) | 1 (5.4) |
| Robberies (per 100,000) | 1 (8.1) | 1 (11.0) | 9 (98.0) | 2 (21.7) | 0 (0.0) | 1 (8.2) | 2 (16.2) | 4 (28.2) | 2 (13.8) | 2 (13.6) | 1 (6.7) | 3 (20.0) | 2 (13.3) | 2 (10.8) |
| Assaults (per 100,000) | 4 (32.2) | 5 (54.8) | 4 (43.6) | 2 (21.7) | 2 (21.3) | 4 (32.9) | 3 (24.2) | 4 (28.2) | 3 (20.7) | 8 (54.4) | 4 (26.9) | 2 (13.4) | 4 (26.6) | 6 (32.5) |
| Burglaries (per 100,000) | 62 (499.4) | 50 (548.4) | 90 (980.4) | 77 (833.6) | 40 (426.6) | 33 (271.2) | 36 (290.9) | 34 (240.1) | 39 (268.8) | 31 (210.8) | 12 (80.8) | 19 (127.0) | 9 (59.8) | 19 (103.0) |
| Thefts (per 100,000) | 111 (894.2) | 126 (1,382) | 142 (1,547) | 109 (1,180) | 92 (981.1) | 71 (583.4) | 96 (775.7) | 156 (1,102) | 81 (558.2) | 86 (584.9) | 83 (558.7) | 79 (527.9) | 89 (591.4) | 71 (385.0) |
| Auto thefts (per 100,000) | 17 (136.9) | 11 (120.7) | 8 (87.1) | 5 (54.1) | 6 (64.0) | 13 (106.8) | 9 (72.7) | 19 (134.2) | 17 (117.2) | 19 (129.2) | 16 (107.7) | 22 (147.0) | 19 (126.3) | 16 (86.8) |
| Arson (per 100,000) | 1 (8.1) | 1 (11.0) | 0 (0.0) | 0 (0.0) | 0 (0.0) | 1 (8.2) | 0 (0.0) | 1 (7.1) | 0 (0.0) | 2 (13.6) | 0 (0.0) | 0 (0.0) | 0 (0.0) | 0 (0.0) |
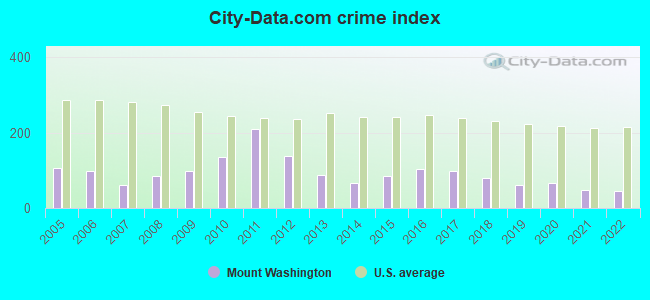
| City-Data.com crime index | 97.0 | 135.1 | 210.5 | 138.0 | 87.0 | 66.5 | 86.3 | 102.7 | 97.4 | 79.8 | 60.2 | 66.5 | 47.2 | 43.7 |
The City-Data.com crime index weighs serious crimes and violent crimes more heavily. Higher means more crime, U.S. average is 246.1. It adjusts for the number of visitors and daily workers commuting into cities.
Crime rate in Mount Washington detailed stats: murders, rapes, robberies, assaults, burglaries, thefts, arson
Full-time law enforcement employees in 2021, including police officers: 22 (21 officers - 21 male; 0 female).
| Officers per 1,000 residents here: | 1.40 |
| Kentucky average: | 1.89 |
 Recent articles from our blog. Our writers, many of them Ph.D. graduates or candidates, create easy-to-read articles on a wide variety of topics.

 | Harvard Body parts scandal comes to Louisville (3 replies) |
| Louisville Exceeded My Expectations!! Thinking of moving.. (21 replies) |
| Pretty neighborhoods in greater Louisville area (13 replies) |
| Thinking of moving to the Louisville area - tell me why not (14 replies) |
| Outdoor Recreation Within Driving Distance (11 replies) |
| The difference between upper midwest and lower midwest (122 replies) |
Latest news from Mount Washington, KY collected exclusively by city-data.com from local newspapers, TV, and radio stations
Ancestries: American (19.4%), English (19.0%), Irish (12.7%), German (9.4%), Italian (5.2%), European (3.6%).
Current Local Time: EST time zone
Incorporated on 01/22/1833
Elevation: 688 feet
Land area: 5.34 square miles.
Population density: 3,450 people per square mile (average).
469 residents are foreign born (1.7% Latin America, 0.4% Europe, 0.3% Asia).
| This city: | 2.6% |
| Kentucky: | 4.1% |
Median real estate property taxes paid for housing units with mortgages in 2022: $2,355 (0.9%)
Median real estate property taxes paid for housing units with no mortgage in 2022: $2,080 (0.9%)
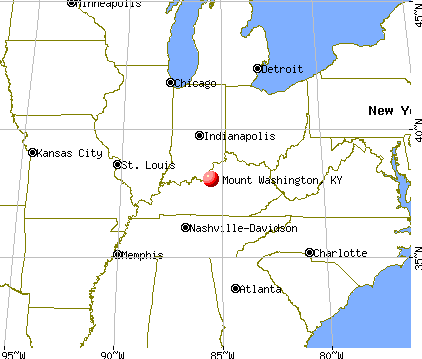
Nearest city with pop. 50,000+: Louisville, KY  (16.5 miles , pop. 256,231).
Nearest city with pop. 1,000,000+: Chicago, IL (285.6 miles , pop. 2,896,016).
Nearest cities:
), ), ), ), ), ), )Latitude: 38.05 N, Longitude: 85.55 W
Daytime population change due to commuting: -5,030 (-27.5%)
Workers who live and work in this city: 1,929 (21.5%)
Area code: 502

| Here: | 3.5% |
| Kentucky: | 3.8% |
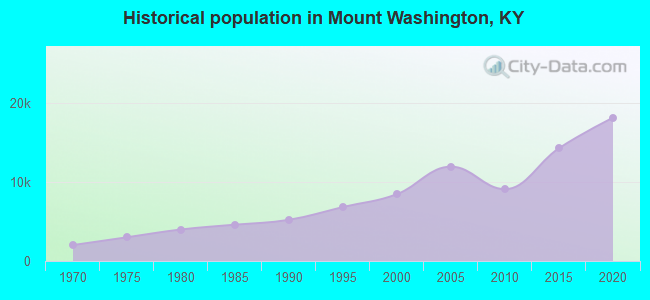
Population change in the 1990s: +2,995 (+54.6%).
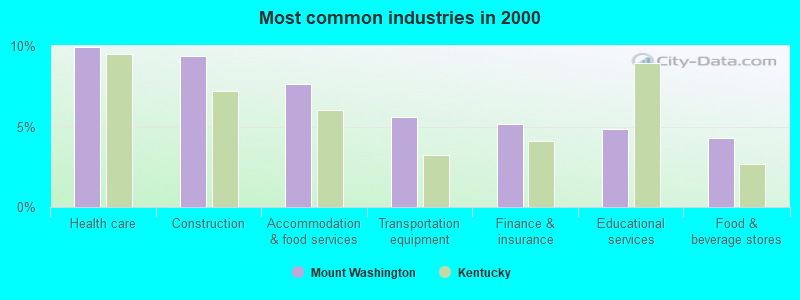
- Health care (9.9%)
- Construction (9.4%)
- Accommodation & food services (7.6%)
- Transportation equipment (5.6%)
- Finance & insurance (5.2%)
- Educational services (4.8%)
- Food & beverage stores (4.3%)
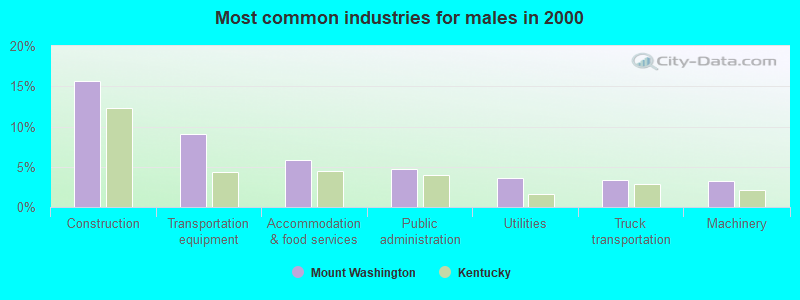
- Construction (15.6%)
- Transportation equipment (9.1%)
- Accommodation & food services (5.9%)
- Public administration (4.8%)
- Utilities (3.6%)
- Truck transportation (3.3%)
- Machinery (3.2%)
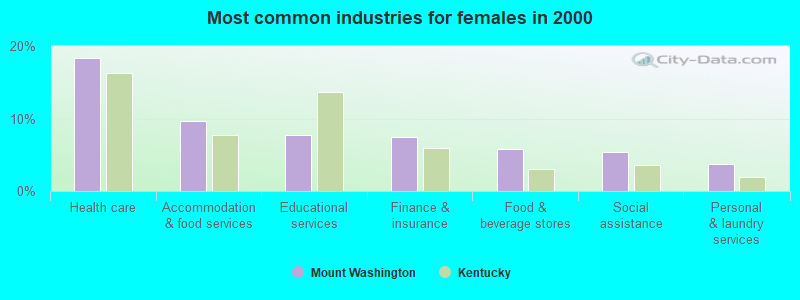
- Health care (18.3%)
- Accommodation & food services (9.7%)
- Educational services (7.7%)
- Finance & insurance (7.5%)
- Food & beverage stores (5.7%)
- Social assistance (5.4%)
- Personal & laundry services (3.8%)
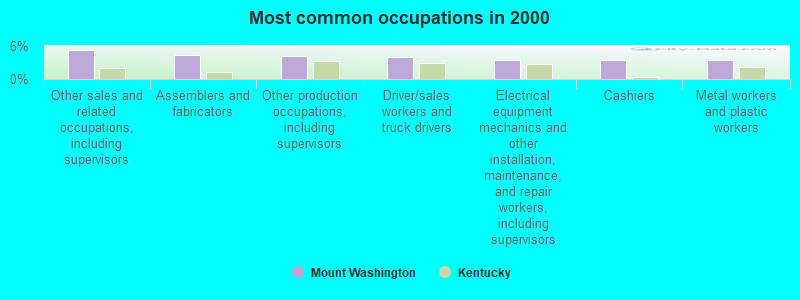
- Other sales and related occupations, including supervisors (5.2%)
- Assemblers and fabricators (4.3%)
- Other production occupations, including supervisors (4.2%)
- Driver/sales workers and truck drivers (4.0%)
- Electrical equipment mechanics and other installation, maintenance, and repair workers, including supervisors (3.4%)
- Cashiers (3.4%)
- Metal workers and plastic workers (3.4%)
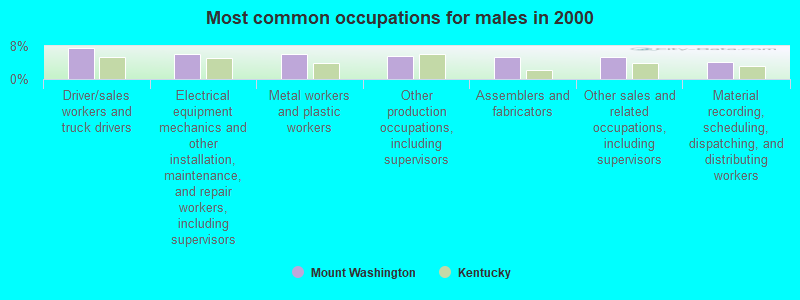
- Driver/sales workers and truck drivers (7.4%)
- Electrical equipment mechanics and other installation, maintenance, and repair workers, including supervisors (6.0%)
- Metal workers and plastic workers (6.0%)
- Other production occupations, including supervisors (5.6%)
- Assemblers and fabricators (5.4%)
- Other sales and related occupations, including supervisors (5.3%)
- Material recording, scheduling, dispatching, and distributing workers (4.1%)
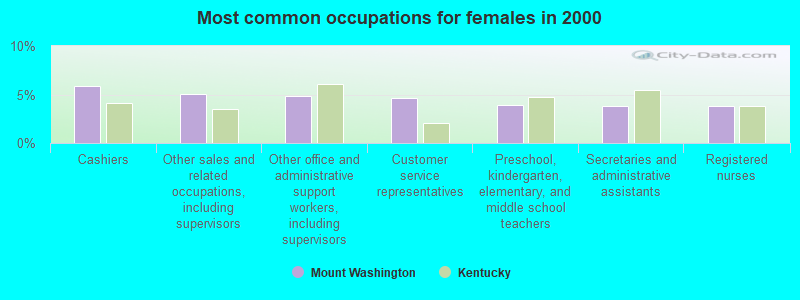
- Cashiers (5.9%)
- Other sales and related occupations, including supervisors (5.1%)
- Other office and administrative support workers, including supervisors (4.8%)
- Customer service representatives (4.6%)
- Preschool, kindergarten, elementary, and middle school teachers (4.0%)
- Secretaries and administrative assistants (3.8%)
- Registered nurses (3.8%)
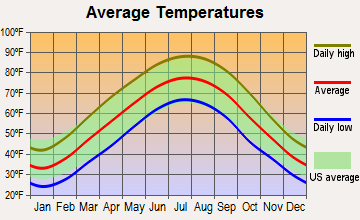
Average climate in Mount Washington, Kentucky
Based on data reported by over 4,000 weather stations


|
|

(lower is better)
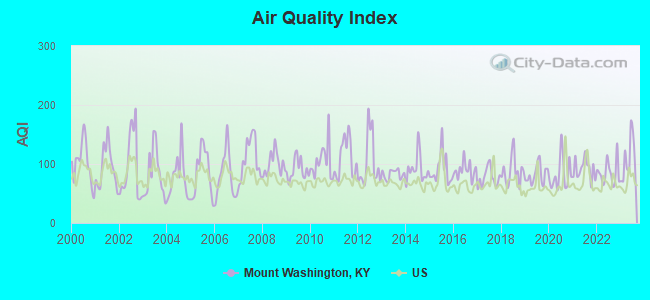
Air Quality Index (AQI) level in 2023 was 109. This is significantly worse than average.
| City: | 109 |
| U.S.: | 73 |
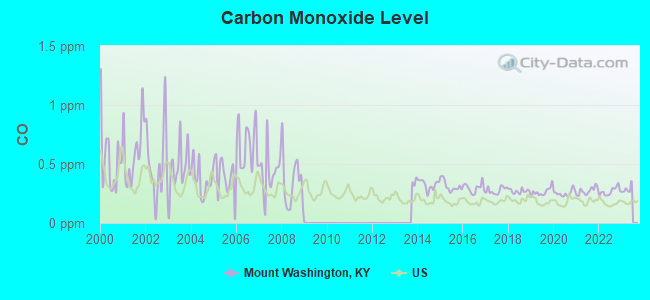
Carbon Monoxide (CO) [ppm] level in 2022 was 0.268. This is about average. Closest monitor was 11.6 miles away from the city center.
| City: | 0.268 |
| U.S.: | 0.251 |
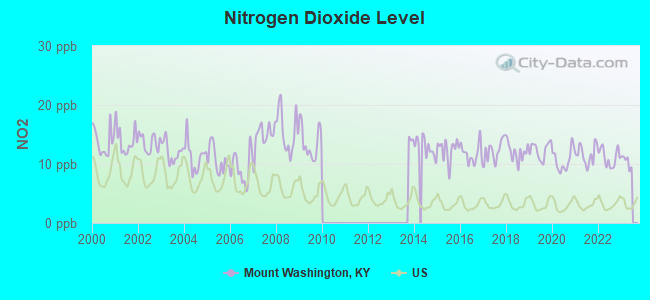
Nitrogen Dioxide (NO2) [ppb] level in 2022 was 11.1. This is significantly worse than average. Closest monitor was 6.5 miles away from the city center.
| City: | 11.1 |
| U.S.: | 5.1 |
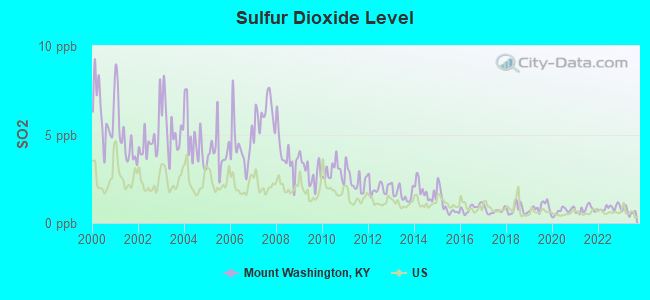
Sulfur Dioxide (SO2) [ppb] level in 2023 was 0.670. This is significantly better than average. Closest monitor was 6.5 miles away from the city center.
| City: | 0.670 |
| U.S.: | 1.515 |
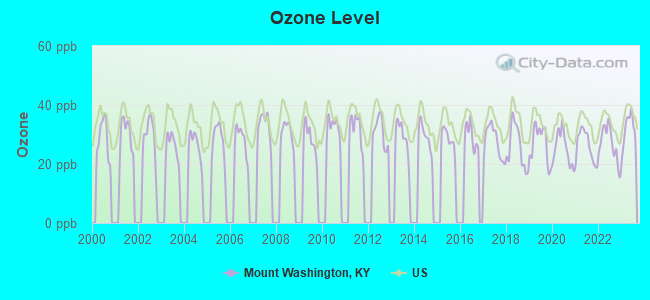
Ozone [ppb] level in 2023 was 31.8. This is about average. Closest monitor was 6.5 miles away from the city center.
| City: | 31.8 |
| U.S.: | 33.3 |
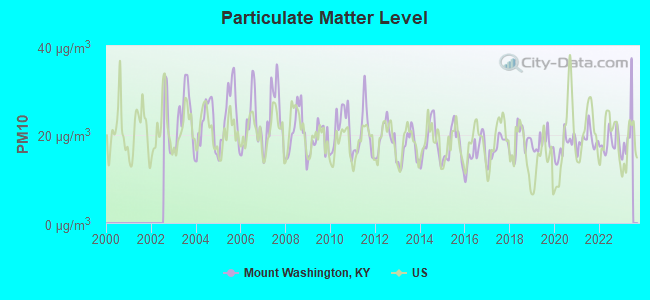
Particulate Matter (PM10) [µg/m3] level in 2022 was 18.2. This is about average. Closest monitor was 9.5 miles away from the city center.
| City: | 18.2 |
| U.S.: | 19.2 |
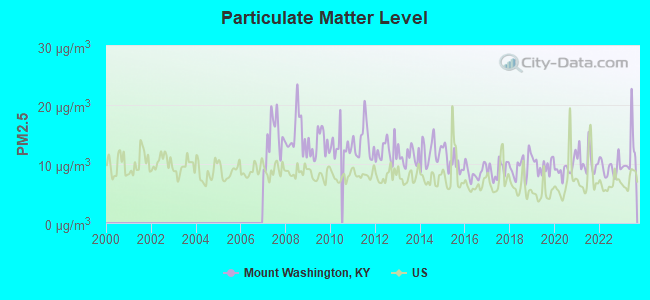
Particulate Matter (PM2.5) [µg/m3] level in 2023 was 11.8. This is significantly worse than average. Closest monitor was 9.5 miles away from the city center.
| City: | 11.8 |
| U.S.: | 8.1 |
Tornado activity:
Mount Washington-area historical tornado activity is slightly above Kentucky state average. It is 57% greater than the overall U.S. average.
On 4/3/1974, a category F5 (max. wind speeds 261-318 mph) tornado 29.7 miles away from the Mount Washington city center killed 31 people and injured 270 people and caused between $500,000 and $5,000,000 in damages.
On 5/28/1996, a category F4 (max. wind speeds 207-260 mph) tornado 12.8 miles away from the city center injured 10 people and caused $101 million in damages.
Earthquake activity:
Mount Washington-area historical earthquake activity is significantly above Kentucky state average. It is 110% greater than the overall U.S. average.On 4/18/2008 at 09:36:59, a magnitude 5.4 (5.1 MB, 4.8 MS, 5.4 MW, 5.2 MW, Class: Moderate, Intensity: VI - VII) earthquake occurred 129.7 miles away from the city center
On 7/27/1980 at 18:52:21, a magnitude 5.2 (5.1 MB, 4.7 MS, 5.0 UK, 5.2 UK) earthquake occurred 88.4 miles away from the city center
On 4/18/2008 at 09:36:59, a magnitude 5.2 (5.2 MW, Depth: 8.9 mi) earthquake occurred 129.7 miles away from Mount Washington center
On 6/10/1987 at 23:48:54, a magnitude 5.1 (4.9 MB, 4.4 MS, 4.6 MS, 5.1 LG) earthquake occurred 137.2 miles away from the city center
On 6/18/2002 at 17:37:15, a magnitude 5.0 (4.3 MB, 4.6 MW, 5.0 LG) earthquake occurred 121.3 miles away from Mount Washington center
On 4/18/2008 at 15:14:16, a magnitude 4.8 (4.5 MB, 4.8 MW, 4.6 MW, Class: Light, Intensity: IV - V) earthquake occurred 128.0 miles away from Mount Washington center
Magnitude types: regional Lg-wave magnitude (LG), body-wave magnitude (MB), surface-wave magnitude (MS), moment magnitude (MW)
Natural disasters:
The number of natural disasters in Bullitt County (18) is near the US average (15).Major Disasters (Presidential) Declared: 14
Emergencies Declared: 2
Causes of natural disasters: Floods: 11, Storms: 10, Tornadoes: 6, Mudslides: 4, Landslides: 3, Winter Storms: 3, Blizzard: 1, Heavy Rain: 1, Hurricane: 1, Snowstorm: 1, Tropical Depression: 1, Wind: 1, Other: 1 (Note: some incidents may be assigned to more than one category).

Hospitals and medical centers in Mount Washington:
Other hospitals and medical centers near Mount Washington:
- WESLEY MANOR NURSING CENTER (Nursing Home, about 8 miles away; LOUISVILLE, KY)
- FILSON CARE HOME (Nursing Home, about 9 miles away; LOUISVILLE, KY)
- REGENCY CARE AND REHABILITATION CENTER (Nursing Home, about 9 miles away; LOUISVILLE, KY)
- FMC - EAST LOUISVILLE (Dialysis Facility, about 9 miles away; LOUISVILLE, KY)
- FRANCISCAN HEALTH CARE CENTER (Nursing Home, about 11 miles away; LOUISVILLE, KY)
- WESTMINSTER TERRACE (Nursing Home, about 12 miles away; LOUISVILLE, KY)
- DAVITA - MEADOWS EAST (Dialysis Facility, about 12 miles away; LOUISVILLE, KY)
Colleges/universities with over 2000 students nearest to Mount Washington:
- Sullivan University (about 14 miles; Louisville, KY; Full-time enrollment: 5,129)
- Bellarmine University (about 15 miles; Louisville, KY; FT enrollment: 3,180)
- The Southern Baptist Theological Seminary (about 16 miles; Louisville, KY; FT enrollment: 2,360)
- University of Louisville (about 17 miles; Louisville, KY; FT enrollment: 16,640)
- Jefferson Community and Technical College (about 18 miles; Louisville, KY; FT enrollment: 7,950)
- Indiana University-Southeast (about 26 miles; New Albany, IN; FT enrollment: 5,050)
- Elizabethtown Community and Technical College (about 30 miles; Elizabethtown, KY; FT enrollment: 3,762)
Public high school in Mount Washington:
- BULLITT EAST HIGH SCHOOL (Students: 1,014, Location: 11450 HWY 44E, Grades: 9-12)
Public elementary/middle schools in Mount Washington:
- PLEASANT GROVE ELEMENTARY SCHOOL (Students: 651, Location: 6415 HWY 44 E, Grades: PK-5)
- MT. WASHINGTON ELEMENTARY (Students: 600, Location: 9234 HWY 44 E, Grades: PK-5)
- OLD MILL ELEMENTARY SCHOOL (Students: 570, Location: 11540 HWY 44 E, Grades: PK-5)
- MT. WASHINGTON MIDDLE SCHOOL (Students: 499, Location: 269 WATER ST, Grades: 6-8)
- EASTSIDE MIDDLE SCHOOL (Students: 457, Location: 6925 HWY 44E, Grades: 6-8)
- CROSSROADS ELEMENTARY (Location: 156 ERIN CIRCLE, Grades: PK-5)
User-submitted facts and corrections:
- Radio station: WFBR, 93.9 FM, www.reach93.org, owner: First Baptist Church Mt Washington
Points of interest:
Notable location: Mount Washington Fire Department (A). Display/hide its location on the map
Cemeteries: Perkins Cemetery (1), Hell Cemetery (2), Highland Memorial Gardens Cemetery (3), Mount Washington Cemetery (4), Saint Francis Cemetery (5), Showalter Cemetery (6). Display/hide their locations on the map
Hotel: Fairfield Inn by Marriott (362 Burnt Sienna Drive) (1). Display/hide its approximate location on the map
| This city: | 2.6 people |
| Kentucky: | 2.5 people |
| This city: | 74.0% |
| Whole state: | 66.9% |
| This city: | 6.6% |
| Whole state: | 6.4% |
Likely homosexual households (counted as self-reported same-sex unmarried-partner households)
- Lesbian couples: 0.3% of all households
- Gay men: 0.3% of all households
8 people in other nonhousehold living situations in 2000
Banks with branches in Mount Washington (2011 data):
- The Peoples Bank: at 201 North Bardstown Road, branch established on 1909/01/01; Mount Washington Drive In Branch at 415 Oakbrooke Drive, branch established on 2000/03/13. Info updated 2010/06/02: Bank assets: $84.6 mil, Deposits: $74.3 mil, local headquarters, negative income in the last year, Commercial Lending Specialization, 2 total offices, Holding Company: Crossroads Bancorp, Inc.
- Citizens Union Bank of Shelbyville: Mount Washington Branch at 375 Oakbrooke Drive, branch established on 2007/10/15. Info updated 2010/06/16: Bank assets: $595.2 mil, Deposits: $497.4 mil, headquarters in Shelbyville, KY, negative income in the last year, Commercial Lending Specialization, 15 total offices, Holding Company: Lea M. Mcmullan Trust
- PNC Bank, National Association: Mt. Washington Ky Branch at 153 Oakbrooke Circle, branch established on 2007/04/23. Info updated 2012/03/20: Bank assets: $263,309.6 mil, Deposits: $197,343.0 mil, headquarters in Wilmington, DE, positive income, Commercial Lending Specialization, 3085 total offices, Holding Company: Pnc Financial Services Group, Inc., The
- The Peoples Bank of Bullitt County: Mount Washington Branch at 100 South Bardstown Road, branch established on 1986/09/22. Info updated 2006/11/03: Bank assets: $214.9 mil, Deposits: $183.9 mil, headquarters in Shepherdsville, KY, positive income, 5 total offices, Holding Company: Peoples Bancorp Inc. Of Bullitt County
- First Federal Savings Bank of Elizabethtown: Mt. Washington Branch at 279 N. Bardstown Road, branch established on 1988/06/30. Info updated 2008/06/26: Bank assets: $1,228.8 mil, Deposits: $1,123.3 mil, headquarters in Elizabethtown, KY, negative income in the last year, Commercial Lending Specialization, 24 total offices, Holding Company: First Financial Service Corporation
- U.S. Bank National Association: Mt. Washington Kroger Branch at 234 Eastbrooke Parkway, branch established on 2009/11/11. Info updated 2012/01/30: Bank assets: $330,470.8 mil, Deposits: $236,091.5 mil, headquarters in Cincinnati, OH, positive income, 3121 total offices, Holding Company: U.S. Bancorp
- First Citizens Bank: Mt. Washington Branch at 157 East Brooke Court, branch established on 2007/06/30. Info updated 2012/03/30: Bank assets: $316.3 mil, Deposits: $268.8 mil, headquarters in Elizabethtown, KY, positive income, Commercial Lending Specialization, 6 total offices, Holding Company: Farmers Capital Bank Corporation
For population 15 years and over in Mount Washington:
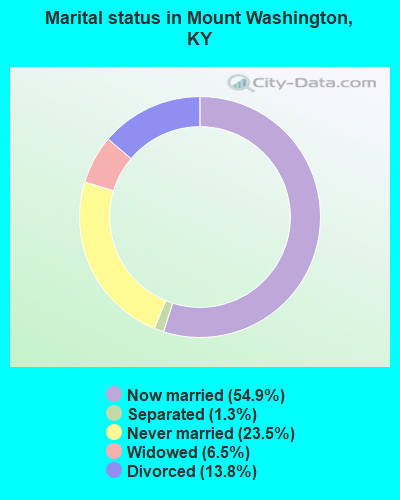
- Never married: 23.5%
- Now married: 54.9%
- Separated: 1.3%
- Widowed: 6.5%
- Divorced: 13.8%
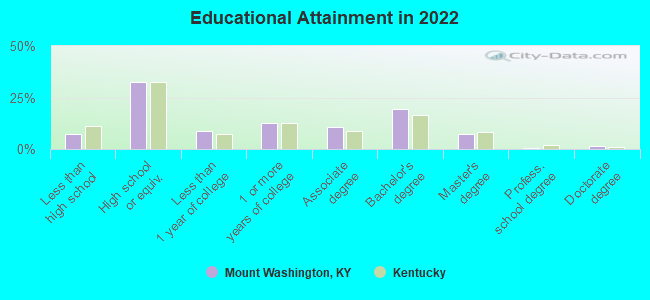
For population 25 years and over in Mount Washington:
- High school or higher: 92.9%
- Bachelor's degree or higher: 23.2%
- Graduate or professional degree: 7.7%
- Unemployed: 3.1%
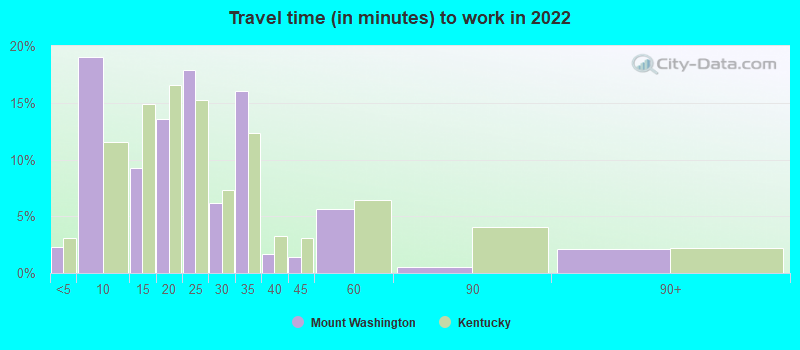
- Mean travel time to work (commute): 26.7 minutes
| Here: | 9.7 |
| Kentucky average: | 11.7 |
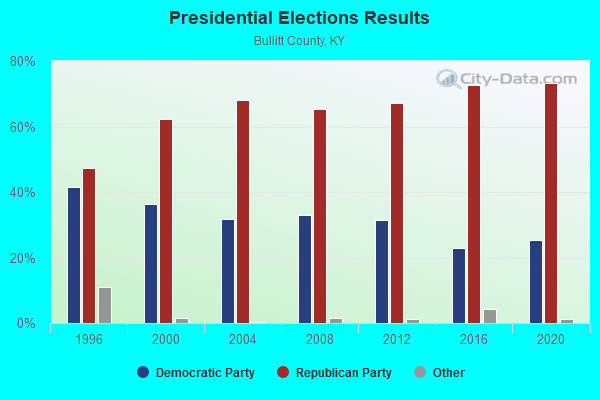
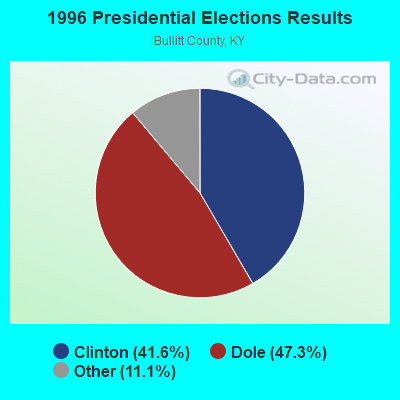
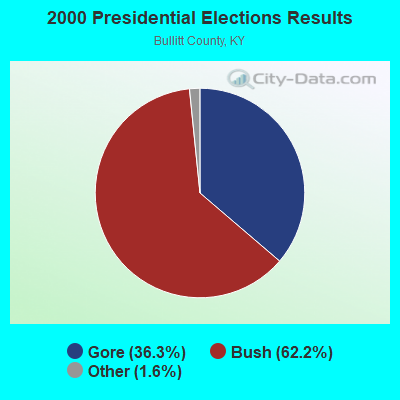
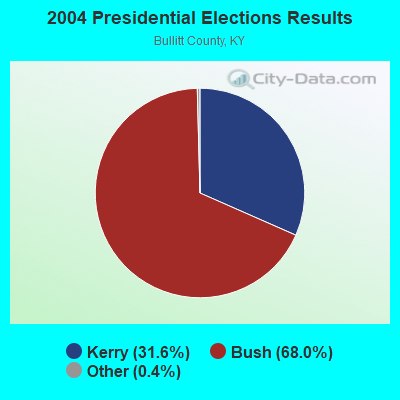


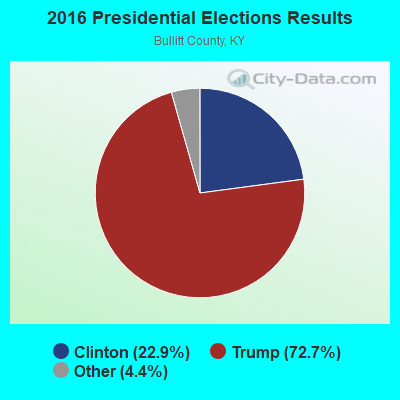
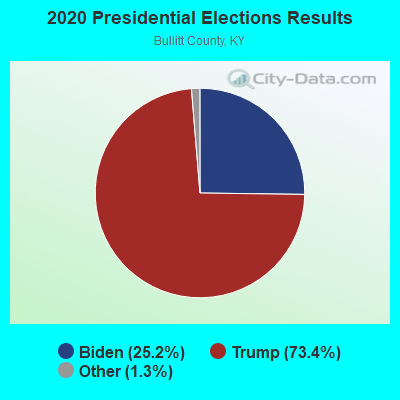
Graphs represent county-level data. Detailed 2008 Election Results
Political contributions by individuals in Mount Washington, KY
Religion statistics for Mount Washington, KY (based on Bullitt County data)
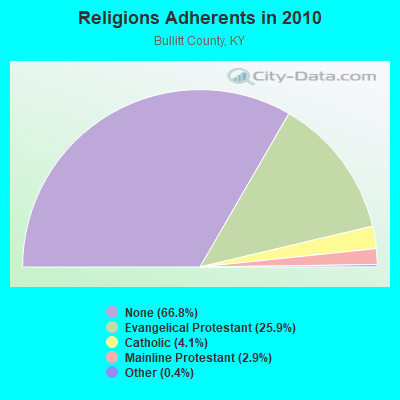
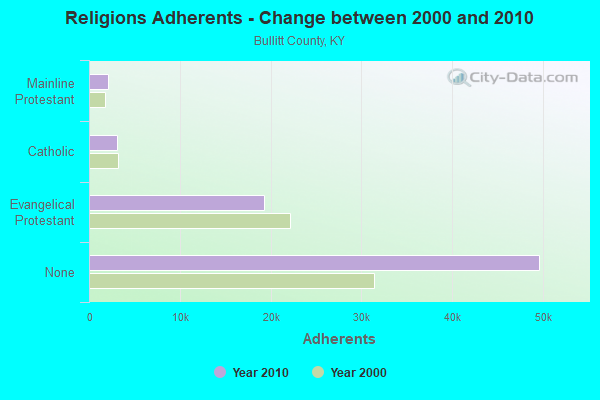
| Religion | Adherents | Congregations |
|---|---|---|
| Evangelical Protestant | 19,239 | 62 |
| Catholic | 3,054 | 3 |
| Mainline Protestant | 2,123 | 10 |
| Other | 291 | 4 |
| None | 49,612 | - |
Food Environment Statistics:
| Bullitt County: | 1.22 / 10,000 pop. |
| State: | 2.19 / 10,000 pop. |
| Here: | 0.41 / 10,000 pop. |
| State: | 0.74 / 10,000 pop. |
| Here: | 4.60 / 10,000 pop. |
| Kentucky: | 4.36 / 10,000 pop. |
| Bullitt County: | 2.84 / 10,000 pop. |
| Kentucky: | 5.74 / 10,000 pop. |
| Here: | 9.1% |
| Kentucky: | 11.0% |
| Bullitt County: | 31.1% |
| State: | 30.0% |
| This county: | 14.8% |
| State: | 15.9% |
Health and Nutrition:
| This city: | 49.0% |
| Kentucky: | 49.9% |
| Here: | 46.4% |
| Kentucky: | 47.0% |
| Mount Washington: | 29.2 |
| Kentucky: | 28.6 |
| This city: | 21.9% |
| State: | 21.0% |
| This city: | 11.0% |
| State: | 10.1% |
| Here: | 6.8 |
| State: | 6.8 |
| Mount Washington: | 35.2% |
| Kentucky: | 33.8% |
| Here: | 57.3% |
| Kentucky: | 56.8% |
| This city: | 79.4% |
| Kentucky: | 78.9% |
More about Health and Nutrition of Mount Washington, KY Residents
| Local government employment and payroll (March 2022) | |||||
| Function | Full-time employees | Monthly full-time payroll | Average yearly full-time wage | Part-time employees | Monthly part-time payroll |
|---|---|---|---|---|---|
| Police Protection - Officers | 25 | $147,248 | $70,679 | 0 | $0 |
| Water Supply | 22 | $102,447 | $55,880 | 2 | $1,539 |
| Parks and Recreation | 9 | $70,709 | $94,279 | 1 | $1,290 |
| Other Government Administration | 9 | $45,762 | $61,016 | 0 | $0 |
| Sewerage | 5 | $25,195 | $60,468 | 0 | $0 |
| Housing and Community Development (Local) | 2 | $8,977 | $53,862 | 2 | $695 |
| Other and Unallocable | 0 | $0 | 10 | $10,761 | |
| Totals for Government | 72 | $400,338 | $66,723 | 15 | $14,285 |
Mount Washington government finances - Expenditure in 2021 (per resident):
- Construction - Sewerage: $624,000 ($33.87)
Water Utilities: $390,000 ($21.17)
- Current Operations - Water Utilities: $4,372,000 ($237.30)
Police Protection: $2,367,000 ($128.47)
Sewerage: $2,109,000 ($114.47)
Solid Waste Management: $1,438,000 ($78.05)
Central Staff Services: $1,152,000 ($62.53)
Regular Highways: $730,000 ($39.62)
Parks and Recreation: $602,000 ($32.67)
Protective Inspection and Regulation - Other: $296,000 ($16.07)
Housing and Community Development: $212,000 ($11.51)
Elementary and Secondary Education: $12,000 ($0.65)
- General - Interest on Debt: $396,000 ($21.49)
- Intergovernmental to Local - Other - General - Other: $156,000 ($8.47)
- Other Capital Outlay - Water Utilities: $508,000 ($27.57)
Central Staff Services: $457,000 ($24.80)
Parks and Recreation: $130,000 ($7.06)
Police Protection: $14,000 ($0.76)
- Total Salaries and Wages: $4,759,000 ($258.30)
- Water Utilities - Interest on Debt: $352,000 ($19.11)
Mount Washington government finances - Revenue in 2021 (per resident):
- Charges - Sewerage: $3,828,000 ($207.77)
Solid Waste Management: $1,590,000 ($86.30)
Parks and Recreation: $181,000 ($9.82)
Other: $85,000 ($4.61)
- Federal Intergovernmental - Other: $1,366,000 ($74.14)
- Local Intergovernmental - Other: $49,000 ($2.66)
- Miscellaneous - Rents: $968,000 ($52.54)
Special Assessments: $475,000 ($25.78)
Donations From Private Sources: $51,000 ($2.77)
Sale of Property: $44,000 ($2.39)
Interest Earnings: $29,000 ($1.57)
Fines and Forfeits: $2,000 ($0.11)
- Revenue - Water Utilities: $5,490,000 ($297.98)
- State Intergovernmental - Highways: $196,000 ($10.64)
Other: $152,000 ($8.25)
- Tax - Individual Income: $1,922,000 ($104.32)
Property: $1,684,000 ($91.40)
Insurance Premiums Sales: $1,398,000 ($75.88)
Public Utilities Sales: $1,276,000 ($69.26)
Alcoholic Beverage License: $261,000 ($14.17)
Other License: $219,000 ($11.89)
Occupation and Business License - Other: $105,000 ($5.70)
Mount Washington government finances - Debt in 2021 (per resident):
- Long Term Debt - Beginning Outstanding - Unspecified Public Purpose: $25,221,000 ($1368.92)
Outstanding Unspecified Public Purpose: $24,207,000 ($1313.88)
Retired Unspecified Public Purpose: $1,239,000 ($67.25)
Issue, Unspecified Public Purpose: $226,000 ($12.27)
Mount Washington government finances - Cash and Securities in 2021 (per resident):
- Other Funds - Cash and Securities: $10,614,000 ($576.10)
| Businesses in Mount Washington, KY | ||||
| Name | Count | Name | Count | |
|---|---|---|---|---|
| AT&T | 1 | McDonald's | 1 | |
| Arby's | 1 | SONIC Drive-In | 1 | |
| Curves | 1 | Taco Bell | 1 | |
| Dairy Queen | 1 | U-Haul | 1 | |
| H&R Block | 1 | UPS | 1 | |
| KFC | 1 | Walgreens | 1 | |
| Kroger | 1 | |||
Strongest AM radio stations in Mount Washington:
- WHAS (840 AM; 50 kW; LOUISVILLE, KY; Owner: CLEAR CHANNEL BROADCASTING LICENSES, INC.)
- WXXA (790 AM; 5 kW; LOUISVILLE, KY)
- WDRD (680 AM; 1 kW; NEWBURG, KY; Owner: ABC, INC.)
- WKJK (1080 AM; 10 kW; LOUISVILLE, KY; Owner: CLEAR CHANNEL BROADCASTING LICENSES, INC.)
- WGTK (970 AM; 5 kW; LOUISVILLE, KY; Owner: SALEM MEDIA OF KENTUCKY, INC.)
- WLCR (1470 AM; daytime; 2 kW; SHEPHERDSVILLE, KY; Owner: LCR PARTNERS, L.P.)
- WLW (700 AM; 50 kW; CINCINNATI, OH; Owner: JACOR BROADCASTING CORPORATION)
- WSAI (1530 AM; 50 kW; CINCINNATI, OH; Owner: JACOR BROADCASTING CORPORATION)
- WLOU (1350 AM; 2 kW; LOUISVILLE, KY; Owner: MORTENSON BROADCASTING CO., INC.)
- WFIA (900 AM; 1 kW; LOUISVILLE, KY; Owner: SCA LICENSE CORPORATION)
- WLLV (1240 AM; 1 kW; LOUISVILLE, KY; Owner: MORTENSON BROADCASTING COMPANY)
- WBRT (1320 AM; 1 kW; BARDSTOWN, KY; Owner: CBC OF NELSON COUNTY, INC.)
- WSM (650 AM; 50 kW; NASHVILLE, TN; Owner: GAYLORD ENTERTAINMENT COMPANY)
Strongest FM radio stations in Mount Washington:
- W216BM (91.1 FM; OKOLONA, KY; Owner: CALVARY CHAPEL OF TWIN FALLS, INC.)
- WAMZ (97.5 FM; LOUISVILLE, KY; Owner: CLEAR CHANNEL BROADCASTING LICENSES, INC.)
- WJIE-FM (88.5 FM; OKOLONA, KY; Owner: EVANGEL SCHOOLS, INC.)
- WTFX-FM (100.5 FM; LOUISVILLE, KY; Owner: CLEAR CHANNEL BROADCASTING LICENSES, INC.)
- WLRS (105.1 FM; SHEPHERDSVILLE, KY; Owner: BLUE CHIP BROADCASTING LICENSES II, LTD.)
- WFPL (89.3 FM; LOUISVILLE, KY; Owner: KENTUCKY PUBLIC RADIO, INC.)
- WRVI (105.9 FM; VALLEY STATION, KY; Owner: SALEM MEDIA OF KENTUCKY, INC.)
- WMJM (101.3 FM; JEFFERSONTOWN, KY; Owner: BLUE CHIP BROADCASTING LICENSES II, LTD.)
- WQMF (95.7 FM; JEFFERSONVILLE, IN; Owner: CLEAR CHANNEL BROADCASTING LICENSES, INC.)
- WPTI (103.9 FM; LOUISVILLE, KY; Owner: CXR HOLDINGS, INC.)
- WASE (103.5 FM; RADCLIFF, KY; Owner: W & B BROADCASTING, INC.)
- WFPK (91.9 FM; LOUISVILLE, KY; Owner: KENTUCKY PUBLIC RADIO, INC.)
- WUOL-FM (90.5 FM; LOUISVILLE, KY; Owner: KENTUCKY PUBLIC RADIO, INC.)
- WSFR (107.7 FM; CORYDON, IN; Owner: CXR HOLDINGS, INC.)
- WDJX (99.7 FM; LOUISVILLE, KY; Owner: BLUE CHIP BROADCASTING LICENSES II, LTD.)
- WVEZ (106.9 FM; LOUISVILLE, KY; Owner: CXR HOLDINGS, INC.)
- WKUE (90.9 FM; ELIZABETHTOWN, KY; Owner: WESTERN KENTUCKY UNIVERSITY)
- WQXE (98.3 FM; ELIZABETHTOWN, KY; Owner: SKYTOWER COMMUNICATIONS-E'TOWN, INC.)
- WRKA (103.1 FM; ST. MATTHEWS, KY; Owner: CXR HOLDINGS, INC.)
- W284AD (104.7 FM; NEW ALBANY, IN; Owner: LIFETALK RADIO, INC.)
TV broadcast stations around Mount Washington:
- WBKI-CA (Channel 28; LOUISVILLE, KY; Owner: LOUISVILLE COMMUNICATIONS, LLC)
- W24BW (Channel 24; LOUISVILLE, KY; Owner: GREATER LOUISVILLE COMMUNICATIONS)
- WAVE (Channel 3; LOUISVILLE, KY; Owner: LIBCO, INC.)
- WHAS-TV (Channel 11; LOUISVILLE, KY; Owner: BELO KENTUCKY, INC.)
- WVHF-LP (Channel 5; JEFFERSONVILLE, ETC., IN; Owner: JOHN W. SMITH, JR.)
- WDRB (Channel 41; LOUISVILLE, KY; Owner: INDEPENDENCE TELEVISION COMPANY)
- WFTE (Channel 58; SALEM, IN; Owner: INDEPENDENCE TELEVISION COMPANY)
- WLKY-TV (Channel 32; LOUISVILLE, KY; Owner: WLKY HEARST-ARGYLE TELEVISION, INC.)
- WBXV-CA (Channel 13; LOUISVILLE, KY; Owner: THE BOX WORLDWIDE LLC)
- WBKI-TV (Channel 34; CAMPBELLSVILLE, KY; Owner: LOUISVILLE COMMUNICATIONS, LLC)
- WJYL-CA (Channel 45; CLARKSVILLE, IN; Owner: JOHN W. SMITH, JR.)
- WKZT-TV (Channel 23; ELIZABETHTOWN, KY; Owner: KENTUCKY AUTHORITY FOR EDUCATIONAL TV)
- WKPC-TV (Channel 15; LOUISVILLE, KY; Owner: KENTUCKY AUTHORITY FOR EDUC'L. TV)
- WKMJ-TV (Channel 68; LOUISVILLE, KY; Owner: KENTUCKY AUTHORITY FOR EDUCATIONAL TV)
- WBNA (Channel 21; LOUISVILLE, KY; Owner: WORD BROADCASTING NETWORK, INC.)
- W39CJ (Channel 39; ELIZABETHTOWN, KY; Owner: TRINITY BROADCASTING NETWORK)
- W50CI (Channel 50; LOUISVILLE, KY; Owner: SOUTH CENTRAL COMMUNICATIONS CORP.)
- National Bridge Inventory (NBI) Statistics
- 19Number of bridges
- 269ft / 82.3mTotal length
- 68,392Total average daily traffic
- 4,304Total average daily truck traffic
- 60,592Total future (year 2026) average daily traffic
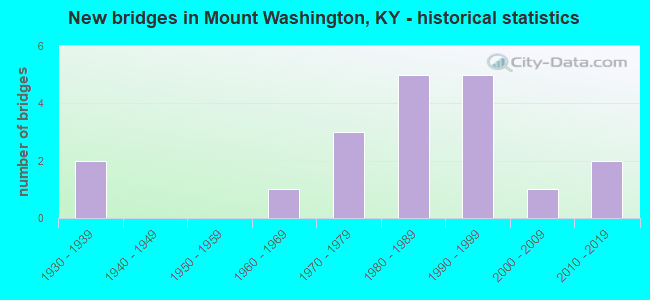
- New bridges - historical statistics
- 21930-1939
- 11960-1969
- 31970-1979
- 51980-1989
- 51990-1999
- 12000-2009
- 22010-2019
FCC Registered Antenna Towers: 54 (See the full list of FCC Registered Antenna Towers)
FCC Registered Broadcast Land Mobile Towers: 14 (See the full list of FCC Registered Broadcast Land Mobile Towers in Mount Washington, KY)
FCC Registered Amateur Radio Licenses: 64 (See the full list of FCC Registered Amateur Radio Licenses in Mount Washington)
FAA Registered Aircraft Manufacturers and Dealers: 1 (See the full list of FAA Registered Manufacturers and Dealers in Mount Washington)
FAA Registered Aircraft: 12 (See the full list of FAA Registered Aircraft)
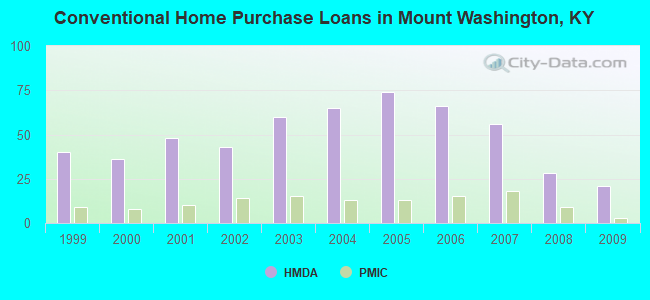
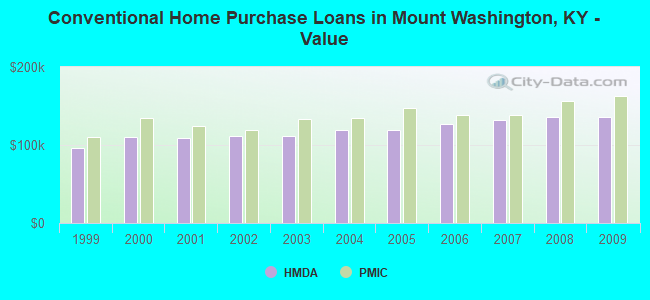
| Home Mortgage Disclosure Act Aggregated Statistics For Year 2009 (Based on 4 partial tracts) | ||||||||||||
| A) FHA, FSA/RHS & VA Home Purchase Loans | B) Conventional Home Purchase Loans | C) Refinancings | D) Home Improvement Loans | F) Non-occupant Loans on < 5 Family Dwellings (A B C & D) | G) Loans On Manufactured Home Dwelling (A B C & D) | |||||||
|---|---|---|---|---|---|---|---|---|---|---|---|---|
| Number | Average Value | Number | Average Value | Number | Average Value | Number | Average Value | Number | Average Value | Number | Average Value | |
| LOANS ORIGINATED | 21 | $148,699 | 21 | $135,295 | 112 | $145,491 | 4 | $62,538 | 6 | $102,853 | 1 | $6,440 |
| APPLICATIONS APPROVED, NOT ACCEPTED | 1 | $135,990 | 0 | $0 | 6 | $168,535 | 1 | $32,540 | 0 | $0 | 0 | $0 |
| APPLICATIONS DENIED | 3 | $152,633 | 3 | $104,210 | 35 | $149,250 | 2 | $36,565 | 1 | $108,280 | 1 | $35,950 |
| APPLICATIONS WITHDRAWN | 2 | $157,830 | 2 | $151,585 | 23 | $156,332 | 0 | $0 | 1 | $64,230 | 0 | $0 |
| FILES CLOSED FOR INCOMPLETENESS | 0 | $0 | 0 | $0 | 7 | $145,634 | 0 | $0 | 0 | $0 | 0 | $0 |
Detailed HMDA statistics for the following Tracts: 0201.00 , 0202.00, 0203.00
| Private Mortgage Insurance Companies Aggregated Statistics For Year 2009 (Based on 4 partial tracts) | ||||
| A) Conventional Home Purchase Loans | B) Refinancings | |||
|---|---|---|---|---|
| Number | Average Value | Number | Average Value | |
| LOANS ORIGINATED | 3 | $162,863 | 4 | $169,282 |
| APPLICATIONS APPROVED, NOT ACCEPTED | 1 | $160,810 | 2 | $177,830 |
| APPLICATIONS DENIED | 0 | $0 | 0 | $0 |
| APPLICATIONS WITHDRAWN | 0 | $0 | 0 | $0 |
| FILES CLOSED FOR INCOMPLETENESS | 0 | $0 | 0 | $0 |
Detailed PMIC statistics for the following Tracts: 0201.00 , 0202.00, 0203.00
| Most common first names in Mount Washington, KY among deceased individuals | ||
| Name | Count | Lived (average) |
|---|---|---|
| William | 75 | 71.3 years |
| James | 65 | 71.0 years |
| Mary | 56 | 78.1 years |
| Robert | 33 | 66.8 years |
| John | 33 | 74.4 years |
| Joseph | 31 | 68.2 years |
| Charles | 28 | 70.7 years |
| George | 23 | 77.0 years |
| Elizabeth | 18 | 78.5 years |
| Edward | 17 | 68.2 years |
| Most common last names in Mount Washington, KY among deceased individuals | ||
| Last name | Count | Lived (average) |
|---|---|---|
| Owen | 30 | 80.6 years |
| Moore | 27 | 75.1 years |
| Smith | 23 | 76.4 years |
| Gentry | 18 | 77.1 years |
| Cox | 16 | 72.1 years |
| Brown | 16 | 64.8 years |
| Harris | 16 | 80.0 years |
| Hall | 16 | 71.5 years |
| Hardin | 14 | 68.4 years |
| Porter | 13 | 77.8 years |
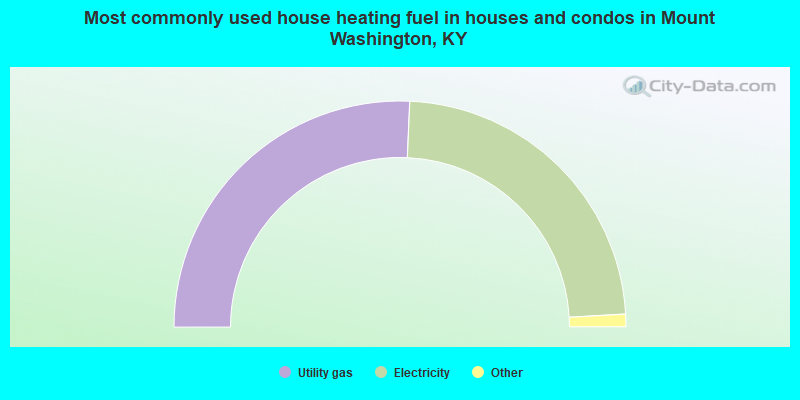
- 51.4%Utility gas
- 46.8%Electricity
- 1.2%Bottled, tank, or LP gas
- 0.3%No fuel used
- 0.1%Fuel oil, kerosene, etc.
- 0.1%Wood
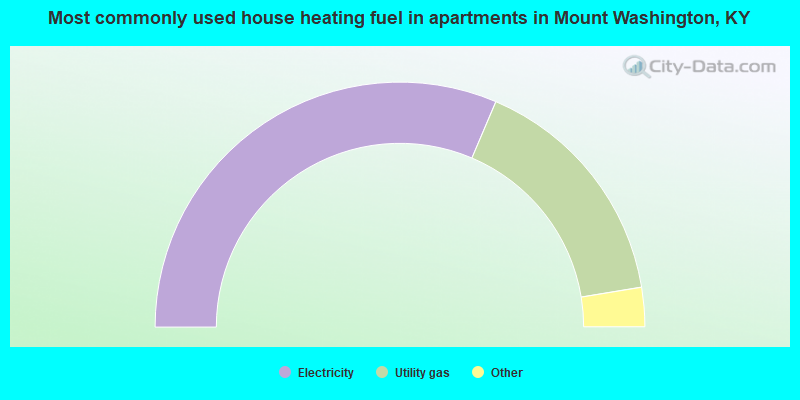
- 62.9%Electricity
- 32.0%Utility gas
- 3.5%Bottled, tank, or LP gas
- 1.6%No fuel used
Mount Washington compared to Kentucky state average:
- Median household income above state average.
- Unemployed percentage significantly below state average.
- Black race population percentage significantly below state average.
- Hispanic race population percentage above state average.
- Median age below state average.
- Length of stay since moving in significantly below state average.
- House age significantly below state average.
Mount Washington on our top lists:
- #28 on the list of "Top 101 cities with largest percentage of females in industries: management of companies and enterprises (population 5,000+)"
- #35 on the list of "Top 101 cities with largest percentage of females in occupations: office and administrative support occupations (population 5,000+)"
- #83 on the list of "Top 101 cities with largest percentage of females in industries: transportation and warehousing (population 5,000+)"
- #15 on the list of "Top 101 counties with the smallest number of people without health insurance coverage in 2000 (pop. 50,000+)"
- #20 on the list of "Top 101 counties with the largest increase in the number of deaths per 1000 residents 2000-2006 to 2007-2013 (pop. 50,000+)"

|
|
Total of 49 patent applications in 2008-2024.