Sunrise, Florida Submit your own pictures of this city and show them to the world
OSM Map
General Map
Google Map
MSN Map
OSM Map
General Map
Google Map
MSN Map
OSM Map
General Map
Google Map
MSN Map
OSM Map
General Map
Google Map
MSN Map
Please wait while loading the map...
Population in 2022: 96,306 (100% urban, 0% rural). Population change since 2000: +12.3%Males: 43,694 Females: 52,612
March 2022 cost of living index in Sunrise: 109.8 (more than average, U.S. average is 100) Percentage of residents living in poverty in 2022: 11.3%for White Non-Hispanic residents , 14.5% for Black residents , 9.7% for Hispanic or Latino residents , 12.6% for other race residents , 9.3% for two or more races residents )
Profiles of local businesses
Business Search - 14 Million verified businesses
Data:
Median household income ($)
Median household income (% change since 2000)
Household income diversity
Ratio of average income to average house value (%)
Ratio of average income to average rent
Median household income ($) - White
Median household income ($) - Black or African American
Median household income ($) - Asian
Median household income ($) - Hispanic or Latino
Median household income ($) - American Indian and Alaska Native
Median household income ($) - Multirace
Median household income ($) - Other Race
Median household income for houses/condos with a mortgage ($)
Median household income for apartments without a mortgage ($)
Races - White alone (%)
Races - White alone (% change since 2000)
Races - Black alone (%)
Races - Black alone (% change since 2000)
Races - American Indian alone (%)
Races - American Indian alone (% change since 2000)
Races - Asian alone (%)
Races - Asian alone (% change since 2000)
Races - Hispanic (%)
Races - Hispanic (% change since 2000)
Races - Native Hawaiian and Other Pacific Islander alone (%)
Races - Native Hawaiian and Other Pacific Islander alone (% change since 2000)
Races - Two or more races (%)
Races - Two or more races (% change since 2000)
Races - Other race alone (%)
Races - Other race alone (% change since 2000)
Racial diversity
Unemployment (%)
Unemployment (% change since 2000)
Unemployment (%) - White
Unemployment (%) - Black or African American
Unemployment (%) - Asian
Unemployment (%) - Hispanic or Latino
Unemployment (%) - American Indian and Alaska Native
Unemployment (%) - Multirace
Unemployment (%) - Other Race
Population density (people per square mile)
Population - Males (%)
Population - Females (%)
Population - Males (%) - White
Population - Males (%) - Black or African American
Population - Males (%) - Asian
Population - Males (%) - Hispanic or Latino
Population - Males (%) - American Indian and Alaska Native
Population - Males (%) - Multirace
Population - Males (%) - Other Race
Population - Females (%) - White
Population - Females (%) - Black or African American
Population - Females (%) - Asian
Population - Females (%) - Hispanic or Latino
Population - Females (%) - American Indian and Alaska Native
Population - Females (%) - Multirace
Population - Females (%) - Other Race
Coronavirus confirmed cases (Jun 10, 2024)
Deaths caused by coronavirus (Jun 10, 2024)
Coronavirus confirmed cases (per 100k population) (Jun 10, 2024)
Deaths caused by coronavirus (per 100k population) (Jun 10, 2024)
Daily increase in number of cases (Jun 10, 2024)
Weekly increase in number of cases (Jun 10, 2024)
Cases doubled (in days) (Jun 10, 2024)
Hospitalized patients (Apr 18, 2022)
Negative test results (Apr 18, 2022)
Total test results (Apr 18, 2022)
COVID Vaccine doses distributed (per 100k population) (Sep 19, 2023)
COVID Vaccine doses administered (per 100k population) (Sep 19, 2023)
COVID Vaccine doses distributed (Sep 19, 2023)
COVID Vaccine doses administered (Sep 19, 2023)
Likely homosexual households (%)
Likely homosexual households (% change since 2000)
Likely homosexual households - Lesbian couples (%)
Likely homosexual households - Lesbian couples (% change since 2000)
Likely homosexual households - Gay men (%)
Likely homosexual households - Gay men (% change since 2000)
Cost of living index
Median gross rent ($)
Median contract rent ($)
Median monthly housing costs ($)
Median house or condo value ($)
Median house or condo value ($ change since 2000)
Mean house or condo value by units in structure - 1, detached ($)
Mean house or condo value by units in structure - 1, attached ($)
Mean house or condo value by units in structure - 2 ($)
Mean house or condo value by units in structure by units in structure - 3 or 4 ($)
Mean house or condo value by units in structure - 5 or more ($)
Mean house or condo value by units in structure - Boat, RV, van, etc. ($)
Mean house or condo value by units in structure - Mobile home ($)
Median house or condo value ($) - White
Median house or condo value ($) - Black or African American
Median house or condo value ($) - Asian
Median house or condo value ($) - Hispanic or Latino
Median house or condo value ($) - American Indian and Alaska Native
Median house or condo value ($) - Multirace
Median house or condo value ($) - Other Race
Median resident age
Resident age diversity
Median resident age - Males
Median resident age - Females
Median resident age - White
Median resident age - Black or African American
Median resident age - Asian
Median resident age - Hispanic or Latino
Median resident age - American Indian and Alaska Native
Median resident age - Multirace
Median resident age - Other Race
Median resident age - Males - White
Median resident age - Males - Black or African American
Median resident age - Males - Asian
Median resident age - Males - Hispanic or Latino
Median resident age - Males - American Indian and Alaska Native
Median resident age - Males - Multirace
Median resident age - Males - Other Race
Median resident age - Females - White
Median resident age - Females - Black or African American
Median resident age - Females - Asian
Median resident age - Females - Hispanic or Latino
Median resident age - Females - American Indian and Alaska Native
Median resident age - Females - Multirace
Median resident age - Females - Other Race
Commute - mean travel time to work (minutes)
Travel time to work - Less than 5 minutes (%)
Travel time to work - Less than 5 minutes (% change since 2000)
Travel time to work - 5 to 9 minutes (%)
Travel time to work - 5 to 9 minutes (% change since 2000)
Travel time to work - 10 to 19 minutes (%)
Travel time to work - 10 to 19 minutes (% change since 2000)
Travel time to work - 20 to 29 minutes (%)
Travel time to work - 20 to 29 minutes (% change since 2000)
Travel time to work - 30 to 39 minutes (%)
Travel time to work - 30 to 39 minutes (% change since 2000)
Travel time to work - 40 to 59 minutes (%)
Travel time to work - 40 to 59 minutes (% change since 2000)
Travel time to work - 60 to 89 minutes (%)
Travel time to work - 60 to 89 minutes (% change since 2000)
Travel time to work - 90 or more minutes (%)
Travel time to work - 90 or more minutes (% change since 2000)
Marital status - Never married (%)
Marital status - Now married (%)
Marital status - Separated (%)
Marital status - Widowed (%)
Marital status - Divorced (%)
Median family income ($)
Median family income (% change since 2000)
Median non-family income ($)
Median non-family income (% change since 2000)
Median per capita income ($)
Median per capita income (% change since 2000)
Median family income ($) - White
Median family income ($) - Black or African American
Median family income ($) - Asian
Median family income ($) - Hispanic or Latino
Median family income ($) - American Indian and Alaska Native
Median family income ($) - Multirace
Median family income ($) - Other Race
Median year house/condo built
Median year apartment built
Year house built - Built 2005 or later (%)
Year house built - Built 2000 to 2004 (%)
Year house built - Built 1990 to 1999 (%)
Year house built - Built 1980 to 1989 (%)
Year house built - Built 1970 to 1979 (%)
Year house built - Built 1960 to 1969 (%)
Year house built - Built 1950 to 1959 (%)
Year house built - Built 1940 to 1949 (%)
Year house built - Built 1939 or earlier (%)
Average household size
Household density (households per square mile)
Average household size - White
Average household size - Black or African American
Average household size - Asian
Average household size - Hispanic or Latino
Average household size - American Indian and Alaska Native
Average household size - Multirace
Average household size - Other Race
Occupied housing units (%)
Vacant housing units (%)
Owner occupied housing units (%)
Renter occupied housing units (%)
Vacancy status - For rent (%)
Vacancy status - For sale only (%)
Vacancy status - Rented or sold, not occupied (%)
Vacancy status - For seasonal, recreational, or occasional use (%)
Vacancy status - For migrant workers (%)
Vacancy status - Other vacant (%)
Residents with income below the poverty level (%)
Residents with income below 50% of the poverty level (%)
Children below poverty level (%)
Poor families by family type - Married-couple family (%)
Poor families by family type - Male, no wife present (%)
Poor families by family type - Female, no husband present (%)
Poverty status for native-born residents (%)
Poverty status for foreign-born residents (%)
Poverty among high school graduates not in families (%)
Poverty among people who did not graduate high school not in families (%)
Residents with income below the poverty level (%) - White
Residents with income below the poverty level (%) - Black or African American
Residents with income below the poverty level (%) - Asian
Residents with income below the poverty level (%) - Hispanic or Latino
Residents with income below the poverty level (%) - American Indian and Alaska Native
Residents with income below the poverty level (%) - Multirace
Residents with income below the poverty level (%) - Other Race
Air pollution - Air Quality Index (AQI)
Air pollution - CO
Air pollution - NO2
Air pollution - SO2
Air pollution - Ozone
Air pollution - PM10
Air pollution - PM25
Air pollution - Pb
Crime - Murders per 100,000 population
Crime - Rapes per 100,000 population
Crime - Robberies per 100,000 population
Crime - Assaults per 100,000 population
Crime - Burglaries per 100,000 population
Crime - Thefts per 100,000 population
Crime - Auto thefts per 100,000 population
Crime - Arson per 100,000 population
Crime - City-data.com crime index
Crime - Violent crime index
Crime - Property crime index
Crime - Murders per 100,000 population (5 year average)
Crime - Rapes per 100,000 population (5 year average)
Crime - Robberies per 100,000 population (5 year average)
Crime - Assaults per 100,000 population (5 year average)
Crime - Burglaries per 100,000 population (5 year average)
Crime - Thefts per 100,000 population (5 year average)
Crime - Auto thefts per 100,000 population (5 year average)
Crime - Arson per 100,000 population (5 year average)
Crime - City-data.com crime index (5 year average)
Crime - Violent crime index (5 year average)
Crime - Property crime index (5 year average)
1996 Presidential Elections Results (%) - Democratic Party (Clinton)
1996 Presidential Elections Results (%) - Republican Party (Dole)
1996 Presidential Elections Results (%) - Other
2000 Presidential Elections Results (%) - Democratic Party (Gore)
2000 Presidential Elections Results (%) - Republican Party (Bush)
2000 Presidential Elections Results (%) - Other
2004 Presidential Elections Results (%) - Democratic Party (Kerry)
2004 Presidential Elections Results (%) - Republican Party (Bush)
2004 Presidential Elections Results (%) - Other
2008 Presidential Elections Results (%) - Democratic Party (Obama)
2008 Presidential Elections Results (%) - Republican Party (McCain)
2008 Presidential Elections Results (%) - Other
2012 Presidential Elections Results (%) - Democratic Party (Obama)
2012 Presidential Elections Results (%) - Republican Party (Romney)
2012 Presidential Elections Results (%) - Other
2016 Presidential Elections Results (%) - Democratic Party (Clinton)
2016 Presidential Elections Results (%) - Republican Party (Trump)
2016 Presidential Elections Results (%) - Other
2020 Presidential Elections Results (%) - Democratic Party (Biden)
2020 Presidential Elections Results (%) - Republican Party (Trump)
2020 Presidential Elections Results (%) - Other
Ancestries Reported - Arab (%)
Ancestries Reported - Czech (%)
Ancestries Reported - Danish (%)
Ancestries Reported - Dutch (%)
Ancestries Reported - English (%)
Ancestries Reported - French (%)
Ancestries Reported - French Canadian (%)
Ancestries Reported - German (%)
Ancestries Reported - Greek (%)
Ancestries Reported - Hungarian (%)
Ancestries Reported - Irish (%)
Ancestries Reported - Italian (%)
Ancestries Reported - Lithuanian (%)
Ancestries Reported - Norwegian (%)
Ancestries Reported - Polish (%)
Ancestries Reported - Portuguese (%)
Ancestries Reported - Russian (%)
Ancestries Reported - Scotch-Irish (%)
Ancestries Reported - Scottish (%)
Ancestries Reported - Slovak (%)
Ancestries Reported - Subsaharan African (%)
Ancestries Reported - Swedish (%)
Ancestries Reported - Swiss (%)
Ancestries Reported - Ukrainian (%)
Ancestries Reported - United States (%)
Ancestries Reported - Welsh (%)
Ancestries Reported - West Indian (%)
Ancestries Reported - Other (%)
Educational Attainment - No schooling completed (%)
Educational Attainment - Less than high school (%)
Educational Attainment - High school or equivalent (%)
Educational Attainment - Less than 1 year of college (%)
Educational Attainment - 1 or more years of college (%)
Educational Attainment - Associate degree (%)
Educational Attainment - Bachelor's degree (%)
Educational Attainment - Master's degree (%)
Educational Attainment - Professional school degree (%)
Educational Attainment - Doctorate degree (%)
School Enrollment - Nursery, preschool (%)
School Enrollment - Kindergarten (%)
School Enrollment - Grade 1 to 4 (%)
School Enrollment - Grade 5 to 8 (%)
School Enrollment - Grade 9 to 12 (%)
School Enrollment - College undergrad (%)
School Enrollment - Graduate or professional (%)
School Enrollment - Not enrolled in school (%)
School enrollment - Public schools (%)
School enrollment - Private schools (%)
School enrollment - Not enrolled (%)
Median number of rooms in houses and condos
Median number of rooms in apartments
Housing units lacking complete plumbing facilities (%)
Housing units lacking complete kitchen facilities (%)
Density of houses
Urban houses (%)
Rural houses (%)
Households with people 60 years and over (%)
Households with people 65 years and over (%)
Households with people 75 years and over (%)
Households with one or more nonrelatives (%)
Households with no nonrelatives (%)
Population in households (%)
Family households (%)
Nonfamily households (%)
Population in families (%)
Family households with own children (%)
Median number of bedrooms in owner occupied houses
Mean number of bedrooms in owner occupied houses
Median number of bedrooms in renter occupied houses
Mean number of bedrooms in renter occupied houses
Median number of vehichles in owner occupied houses
Mean number of vehichles in owner occupied houses
Median number of vehichles in renter occupied houses
Mean number of vehichles in renter occupied houses
Mortgage status - with mortgage (%)
Mortgage status - with second mortgage (%)
Mortgage status - with home equity loan (%)
Mortgage status - with both second mortgage and home equity loan (%)
Mortgage status - without a mortgage (%)
Average family size
Average family size - White
Average family size - Black or African American
Average family size - Asian
Average family size - Hispanic or Latino
Average family size - American Indian and Alaska Native
Average family size - Multirace
Average family size - Other Race
Geographical mobility - Same house 1 year ago (%)
Geographical mobility - Moved within same county (%)
Geographical mobility - Moved from different county within same state (%)
Geographical mobility - Moved from different state (%)
Geographical mobility - Moved from abroad (%)
Place of birth - Born in state of residence (%)
Place of birth - Born in other state (%)
Place of birth - Native, outside of US (%)
Place of birth - Foreign born (%)
Housing units in structures - 1, detached (%)
Housing units in structures - 1, attached (%)
Housing units in structures - 2 (%)
Housing units in structures - 3 or 4 (%)
Housing units in structures - 5 to 9 (%)
Housing units in structures - 10 to 19 (%)
Housing units in structures - 20 to 49 (%)
Housing units in structures - 50 or more (%)
Housing units in structures - Mobile home (%)
Housing units in structures - Boat, RV, van, etc. (%)
House/condo owner moved in on average (years ago)
Renter moved in on average (years ago)
Year householder moved into unit - Moved in 1999 to March 2000 (%)
Year householder moved into unit - Moved in 1995 to 1998 (%)
Year householder moved into unit - Moved in 1990 to 1994 (%)
Year householder moved into unit - Moved in 1980 to 1989 (%)
Year householder moved into unit - Moved in 1970 to 1979 (%)
Year householder moved into unit - Moved in 1969 or earlier (%)
Means of transportation to work - Drove car alone (%)
Means of transportation to work - Carpooled (%)
Means of transportation to work - Public transportation (%)
Means of transportation to work - Bus or trolley bus (%)
Means of transportation to work - Streetcar or trolley car (%)
Means of transportation to work - Subway or elevated (%)
Means of transportation to work - Railroad (%)
Means of transportation to work - Ferryboat (%)
Means of transportation to work - Taxicab (%)
Means of transportation to work - Motorcycle (%)
Means of transportation to work - Bicycle (%)
Means of transportation to work - Walked (%)
Means of transportation to work - Other means (%)
Working at home (%)
Industry diversity
Most Common Industries - Agriculture, forestry, fishing and hunting, and mining (%)
Most Common Industries - Agriculture, forestry, fishing and hunting (%)
Most Common Industries - Mining, quarrying, and oil and gas extraction (%)
Most Common Industries - Construction (%)
Most Common Industries - Manufacturing (%)
Most Common Industries - Wholesale trade (%)
Most Common Industries - Retail trade (%)
Most Common Industries - Transportation and warehousing, and utilities (%)
Most Common Industries - Transportation and warehousing (%)
Most Common Industries - Utilities (%)
Most Common Industries - Information (%)
Most Common Industries - Finance and insurance, and real estate and rental and leasing (%)
Most Common Industries - Finance and insurance (%)
Most Common Industries - Real estate and rental and leasing (%)
Most Common Industries - Professional, scientific, and management, and administrative and waste management services (%)
Most Common Industries - Professional, scientific, and technical services (%)
Most Common Industries - Management of companies and enterprises (%)
Most Common Industries - Administrative and support and waste management services (%)
Most Common Industries - Educational services, and health care and social assistance (%)
Most Common Industries - Educational services (%)
Most Common Industries - Health care and social assistance (%)
Most Common Industries - Arts, entertainment, and recreation, and accommodation and food services (%)
Most Common Industries - Arts, entertainment, and recreation (%)
Most Common Industries - Accommodation and food services (%)
Most Common Industries - Other services, except public administration (%)
Most Common Industries - Public administration (%)
Occupation diversity
Most Common Occupations - Management, business, science, and arts occupations (%)
Most Common Occupations - Management, business, and financial occupations (%)
Most Common Occupations - Management occupations (%)
Most Common Occupations - Business and financial operations occupations (%)
Most Common Occupations - Computer, engineering, and science occupations (%)
Most Common Occupations - Computer and mathematical occupations (%)
Most Common Occupations - Architecture and engineering occupations (%)
Most Common Occupations - Life, physical, and social science occupations (%)
Most Common Occupations - Education, legal, community service, arts, and media occupations (%)
Most Common Occupations - Community and social service occupations (%)
Most Common Occupations - Legal occupations (%)
Most Common Occupations - Education, training, and library occupations (%)
Most Common Occupations - Arts, design, entertainment, sports, and media occupations (%)
Most Common Occupations - Healthcare practitioners and technical occupations (%)
Most Common Occupations - Health diagnosing and treating practitioners and other technical occupations (%)
Most Common Occupations - Health technologists and technicians (%)
Most Common Occupations - Service occupations (%)
Most Common Occupations - Healthcare support occupations (%)
Most Common Occupations - Protective service occupations (%)
Most Common Occupations - Fire fighting and prevention, and other protective service workers including supervisors (%)
Most Common Occupations - Law enforcement workers including supervisors (%)
Most Common Occupations - Food preparation and serving related occupations (%)
Most Common Occupations - Building and grounds cleaning and maintenance occupations (%)
Most Common Occupations - Personal care and service occupations (%)
Most Common Occupations - Sales and office occupations (%)
Most Common Occupations - Sales and related occupations (%)
Most Common Occupations - Office and administrative support occupations (%)
Most Common Occupations - Natural resources, construction, and maintenance occupations (%)
Most Common Occupations - Farming, fishing, and forestry occupations (%)
Most Common Occupations - Construction and extraction occupations (%)
Most Common Occupations - Installation, maintenance, and repair occupations (%)
Most Common Occupations - Production, transportation, and material moving occupations (%)
Most Common Occupations - Production occupations (%)
Most Common Occupations - Transportation occupations (%)
Most Common Occupations - Material moving occupations (%)
People in Group quarters - Institutionalized population (%)
People in Group quarters - Correctional institutions (%)
People in Group quarters - Federal prisons and detention centers (%)
People in Group quarters - Halfway houses (%)
People in Group quarters - Local jails and other confinement facilities (including police lockups) (%)
People in Group quarters - Military disciplinary barracks (%)
People in Group quarters - State prisons (%)
People in Group quarters - Other types of correctional institutions (%)
People in Group quarters - Nursing homes (%)
People in Group quarters - Hospitals/wards, hospices, and schools for the handicapped (%)
People in Group quarters - Hospitals/wards and hospices for chronically ill (%)
People in Group quarters - Hospices or homes for chronically ill (%)
People in Group quarters - Military hospitals or wards for chronically ill (%)
People in Group quarters - Other hospitals or wards for chronically ill (%)
People in Group quarters - Hospitals or wards for drug/alcohol abuse (%)
People in Group quarters - Mental (Psychiatric) hospitals or wards (%)
People in Group quarters - Schools, hospitals, or wards for the mentally retarded (%)
People in Group quarters - Schools, hospitals, or wards for the physically handicapped (%)
People in Group quarters - Institutions for the deaf (%)
People in Group quarters - Institutions for the blind (%)
People in Group quarters - Orthopedic wards and institutions for the physically handicapped (%)
People in Group quarters - Wards in general hospitals for patients who have no usual home elsewhere (%)
People in Group quarters - Wards in military hospitals for patients who have no usual home elsewhere (%)
People in Group quarters - Juvenile institutions (%)
People in Group quarters - Long-term care (%)
People in Group quarters - Homes for abused, dependent, and neglected children (%)
People in Group quarters - Residential treatment centers for emotionally disturbed children (%)
People in Group quarters - Training schools for juvenile delinquents (%)
People in Group quarters - Short-term care, detention or diagnostic centers for delinquent children (%)
People in Group quarters - Type of juvenile institution unknown (%)
People in Group quarters - Noninstitutionalized population (%)
People in Group quarters - College dormitories (includes college quarters off campus) (%)
People in Group quarters - Military quarters (%)
People in Group quarters - On base (%)
People in Group quarters - Barracks, unaccompanied personnel housing (UPH), (Enlisted/Officer), ;and similar group living quarters for military personnel (%)
People in Group quarters - Transient quarters for temporary residents (%)
People in Group quarters - Military ships (%)
People in Group quarters - Group homes (%)
People in Group quarters - Homes or halfway houses for drug/alcohol abuse (%)
People in Group quarters - Homes for the mentally ill (%)
People in Group quarters - Homes for the mentally retarded (%)
People in Group quarters - Homes for the physically handicapped (%)
People in Group quarters - Other group homes (%)
People in Group quarters - Religious group quarters (%)
People in Group quarters - Dormitories (%)
People in Group quarters - Agriculture workers' dormitories on farms (%)
People in Group quarters - Job Corps and vocational training facilities (%)
People in Group quarters - Other workers' dormitories (%)
People in Group quarters - Crews of maritime vessels (%)
People in Group quarters - Other nonhousehold living situations (%)
People in Group quarters - Other noninstitutional group quarters (%)
Residents speaking English at home (%)
Residents speaking English at home - Born in the United States (%)
Residents speaking English at home - Native, born elsewhere (%)
Residents speaking English at home - Foreign born (%)
Residents speaking Spanish at home (%)
Residents speaking Spanish at home - Born in the United States (%)
Residents speaking Spanish at home - Native, born elsewhere (%)
Residents speaking Spanish at home - Foreign born (%)
Residents speaking other language at home (%)
Residents speaking other language at home - Born in the United States (%)
Residents speaking other language at home - Native, born elsewhere (%)
Residents speaking other language at home - Foreign born (%)
Class of Workers - Employee of private company (%)
Class of Workers - Self-employed in own incorporated business (%)
Class of Workers - Private not-for-profit wage and salary workers (%)
Class of Workers - Local government workers (%)
Class of Workers - State government workers (%)
Class of Workers - Federal government workers (%)
Class of Workers - Self-employed workers in own not incorporated business and Unpaid family workers (%)
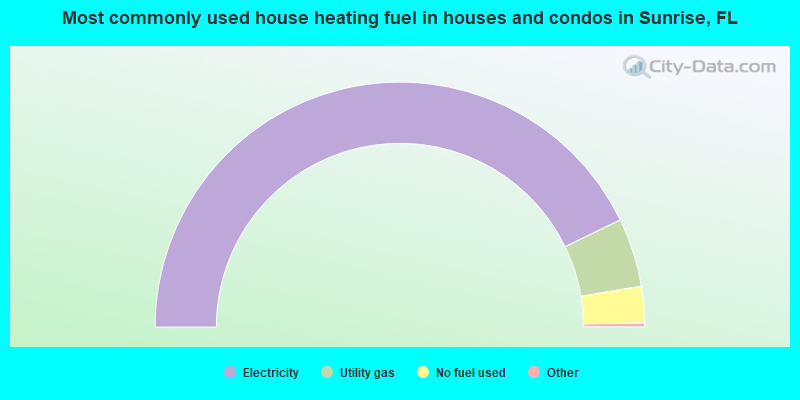
House heating fuel used in houses and condos - Utility gas (%)
House heating fuel used in houses and condos - Bottled, tank, or LP gas (%)
House heating fuel used in houses and condos - Electricity (%)
House heating fuel used in houses and condos - Fuel oil, kerosene, etc. (%)
House heating fuel used in houses and condos - Coal or coke (%)
House heating fuel used in houses and condos - Wood (%)
House heating fuel used in houses and condos - Solar energy (%)
House heating fuel used in houses and condos - Other fuel (%)
House heating fuel used in houses and condos - No fuel used (%)
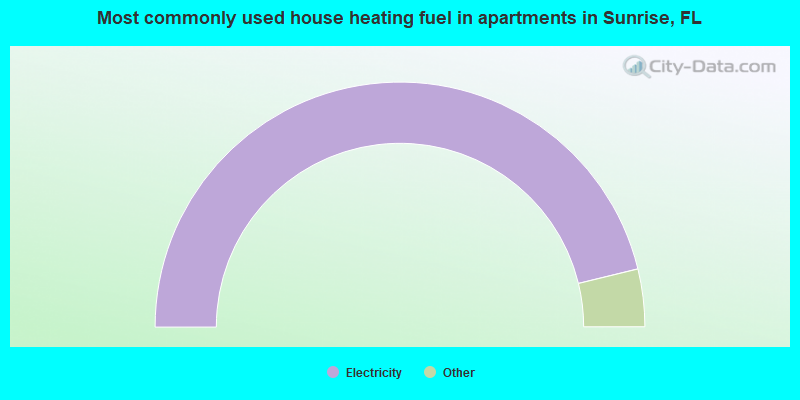
House heating fuel used in apartments - Utility gas (%)
House heating fuel used in apartments - Bottled, tank, or LP gas (%)
House heating fuel used in apartments - Electricity (%)
House heating fuel used in apartments - Fuel oil, kerosene, etc. (%)
House heating fuel used in apartments - Coal or coke (%)
House heating fuel used in apartments - Wood (%)
House heating fuel used in apartments - Solar energy (%)
House heating fuel used in apartments - Other fuel (%)
House heating fuel used in apartments - No fuel used (%)
Armed forces status - In Armed Forces (%)
Armed forces status - Civilian (%)
Armed forces status - Civilian - Veteran (%)
Armed forces status - Civilian - Nonveteran (%)
Fatal accidents locations in years 2005-2021
Fatal accidents locations in 2005
Fatal accidents locations in 2006
Fatal accidents locations in 2007
Fatal accidents locations in 2008
Fatal accidents locations in 2009
Fatal accidents locations in 2010
Fatal accidents locations in 2011
Fatal accidents locations in 2012
Fatal accidents locations in 2013
Fatal accidents locations in 2014
Fatal accidents locations in 2015
Fatal accidents locations in 2016
Fatal accidents locations in 2017
Fatal accidents locations in 2018
Fatal accidents locations in 2019
Fatal accidents locations in 2020
Fatal accidents locations in 2021
Alcohol use - People drinking some alcohol every month (%)
Alcohol use - People not drinking at all (%)
Alcohol use - Average days/month drinking alcohol
Alcohol use - Average drinks/week
Alcohol use - Average days/year people drink much
Audiometry - Average condition of hearing (%)
Audiometry - People that can hear a whisper from across a quiet room (%)
Audiometry - People that can hear normal voice from across a quiet room (%)
Audiometry - Ears ringing, roaring, buzzing (%)
Audiometry - Had a job exposure to loud noise (%)
Audiometry - Had off-work exposure to loud noise (%)
Blood Pressure & Cholesterol - Has high blood pressure (%)
Blood Pressure & Cholesterol - Checking blood pressure at home (%)
Blood Pressure & Cholesterol - Frequently checking blood cholesterol (%)
Blood Pressure & Cholesterol - Has high cholesterol level (%)
Consumer Behavior - Money monthly spent on food at supermarket/grocery store
Consumer Behavior - Money monthly spent on food at other stores
Consumer Behavior - Money monthly spent on eating out
Consumer Behavior - Money monthly spent on carryout/delivered foods
Consumer Behavior - Income spent on food at supermarket/grocery store (%)
Consumer Behavior - Income spent on food at other stores (%)
Consumer Behavior - Income spent on eating out (%)
Consumer Behavior - Income spent on carryout/delivered foods (%)
Current Health Status - General health condition (%)
Current Health Status - Blood donors (%)
Current Health Status - Has blood ever tested for HIV virus (%)
Current Health Status - Left-handed people (%)
Dermatology - People using sunscreen (%)
Diabetes - Diabetics (%)
Diabetes - Had a blood test for high blood sugar (%)
Diabetes - People taking insulin (%)
Diet Behavior & Nutrition - Diet health (%)
Diet Behavior & Nutrition - Milk product consumption (# of products/month)
Diet Behavior & Nutrition - Meals not home prepared (#/week)
Diet Behavior & Nutrition - Meals from fast food or pizza place (#/week)
Diet Behavior & Nutrition - Ready-to-eat foods (#/month)
Diet Behavior & Nutrition - Frozen meals/pizza (#/month)
Drug Use - People that ever used marijuana or hashish (%)
Drug Use - Ever used hard drugs (%)
Drug Use - Ever used any form of cocaine (%)
Drug Use - Ever used heroin (%)
Drug Use - Ever used methamphetamine (%)
Health Insurance - People covered by health insurance (%)
Kidney Conditions-Urology - Avg. # of times urinating at night
Medical Conditions - People with asthma (%)
Medical Conditions - People with anemia (%)
Medical Conditions - People with psoriasis (%)
Medical Conditions - People with overweight (%)
Medical Conditions - Elderly people having difficulties in thinking or remembering (%)
Medical Conditions - People who ever received blood transfusion (%)
Medical Conditions - People having trouble seeing even with glass/contacts (%)
Medical Conditions - People with arthritis (%)
Medical Conditions - People with gout (%)
Medical Conditions - People with congestive heart failure (%)
Medical Conditions - People with coronary heart disease (%)
Medical Conditions - People with angina pectoris (%)
Medical Conditions - People who ever had heart attack (%)
Medical Conditions - People who ever had stroke (%)
Medical Conditions - People with emphysema (%)
Medical Conditions - People with thyroid problem (%)
Medical Conditions - People with chronic bronchitis (%)
Medical Conditions - People with any liver condition (%)
Medical Conditions - People who ever had cancer or malignancy (%)
Mental Health - People who have little interest in doing things (%)
Mental Health - People feeling down, depressed, or hopeless (%)
Mental Health - People who have trouble sleeping or sleeping too much (%)
Mental Health - People feeling tired or having little energy (%)
Mental Health - People with poor appetite or overeating (%)
Mental Health - People feeling bad about themself (%)
Mental Health - People who have trouble concentrating on things (%)
Mental Health - People moving or speaking slowly or too fast (%)
Mental Health - People having thoughts they would be better off dead (%)
Oral Health - Average years since last visit a dentist
Oral Health - People embarrassed because of mouth (%)
Oral Health - People with gum disease (%)
Oral Health - General health of teeth and gums (%)
Oral Health - Average days a week using dental floss/device
Oral Health - Average days a week using mouthwash for dental problem
Oral Health - Average number of teeth
Pesticide Use - Households using pesticides to control insects (%)
Pesticide Use - Households using pesticides to kill weeds (%)
Physical Activity - People doing vigorous-intensity work activities (%)
Physical Activity - People doing moderate-intensity work activities (%)
Physical Activity - People walking or bicycling (%)
Physical Activity - People doing vigorous-intensity recreational activities (%)
Physical Activity - People doing moderate-intensity recreational activities (%)
Physical Activity - Average hours a day doing sedentary activities
Physical Activity - Average hours a day watching TV or videos
Physical Activity - Average hours a day using computer
Physical Functioning - People having limitations keeping them from working (%)
Physical Functioning - People limited in amount of work they can do (%)
Physical Functioning - People that need special equipment to walk (%)
Physical Functioning - People experiencing confusion/memory problems (%)
Physical Functioning - People requiring special healthcare equipment (%)
Prescription Medications - Average number of prescription medicines taking
Preventive Aspirin Use - Adults 40+ taking low-dose aspirin (%)
Reproductive Health - Vaginal deliveries (%)
Reproductive Health - Cesarean deliveries (%)
Reproductive Health - Deliveries resulted in a live birth (%)
Reproductive Health - Pregnancies resulted in a delivery (%)
Reproductive Health - Women breastfeeding newborns (%)
Reproductive Health - Women that had a hysterectomy (%)
Reproductive Health - Women that had both ovaries removed (%)
Reproductive Health - Women that have ever taken birth control pills (%)
Reproductive Health - Women taking birth control pills (%)
Reproductive Health - Women that have ever used Depo-Provera or injectables (%)
Reproductive Health - Women that have ever used female hormones (%)
Sexual Behavior - People 18+ that ever had sex (vaginal, anal, or oral) (%)
Sexual Behavior - Males 18+ that ever had vaginal sex with a woman (%)
Sexual Behavior - Males 18+ that ever performed oral sex on a woman (%)
Sexual Behavior - Males 18+ that ever had anal sex with a woman (%)
Sexual Behavior - Males 18+ that ever had any sex with a man (%)
Sexual Behavior - Females 18+ that ever had vaginal sex with a man (%)
Sexual Behavior - Females 18+ that ever performed oral sex on a man (%)
Sexual Behavior - Females 18+ that ever had anal sex with a man (%)
Sexual Behavior - Females 18+ that ever had any kind of sex with a woman (%)
Sexual Behavior - Average age people first had sex
Sexual Behavior - Average number of female sex partners in lifetime (males 18+)
Sexual Behavior - Average number of female vaginal sex partners in lifetime (males 18+)
Sexual Behavior - Average age people first performed oral sex on a woman (18+)
Sexual Behavior - Average number of woman performed oral sex on in lifetime (18+)
Sexual Behavior - Average number of male sex partners in lifetime (males 18+)
Sexual Behavior - Average number of male anal sex partners in lifetime (males 18+)
Sexual Behavior - Average age people first performed oral sex on a man (18+)
Sexual Behavior - Average number of male oral sex partners in lifetime (18+)
Sexual Behavior - People using protection when performing oral sex (%)
Sexual Behavior - Average number of times people have vaginal or anal sex a year
Sexual Behavior - People having sex without condom (%)
Sexual Behavior - Average number of male sex partners in lifetime (females 18+)
Sexual Behavior - Average number of male vaginal sex partners in lifetime (females 18+)
Sexual Behavior - Average number of female sex partners in lifetime (females 18+)
Sexual Behavior - Circumcised males 18+ (%)
Sleep Disorders - Average hours sleeping at night
Sleep Disorders - People that has trouble sleeping (%)
Smoking-Cigarette Use - People smoking cigarettes (%)
Taste & Smell - People 40+ having problems with smell (%)
Taste & Smell - People 40+ having problems with taste (%)
Taste & Smell - People 40+ that ever had wisdom teeth removed (%)
Taste & Smell - People 40+ that ever had tonsils teeth removed (%)
Taste & Smell - People 40+ that ever had a loss of consciousness because of a head injury (%)
Taste & Smell - People 40+ that ever had a broken nose or other serious injury to face or skull (%)
Taste & Smell - People 40+ that ever had two or more sinus infections (%)
Weight - Average height (inches)
Weight - Average weight (pounds)
Weight - Average BMI
Weight - People that are obese (%)
Weight - People that ever were obese (%)
Weight - People trying to lose weight (%)
According to our research of Florida and other state lists, there were 55 registered sex offenders living in Sunrise, Florida as of June 10, 2024 . The ratio of all residents to sex offenders in Sunrise is 1,704 to 1.The ratio of registered sex offenders to all residents in this city is much lower than the state average.
The City-Data.com crime index weighs serious crimes and violent crimes more heavily. Higher means more crime, U.S. average is 246.1. It adjusts for the number of visitors and daily workers commuting into cities.
- means the value is smaller than the state average.
- means the value is about the same as the state average.
- means the value is bigger than the state average.
- means the value is much bigger than the state average.
Crime rate in Sunrise detailed stats: murders, rapes, robberies, assaults, burglaries, thefts, arson Officers per 1,000 residents here:
1.81Florida average:
2.33
Latest news from Sunrise, FL collected exclusively by city-data.com from local newspapers, TV, and radio stations
Ancestries: Haitian (11.4%), Jamaican (11.3%), American (8.3%), Italian (3.0%), German (1.3%), English (1.3%).
Current Local Time:
Land area: 18.2 square miles.
Population density: 5,291 people per square mile (average).
43,382 residents are foreign born (35.9% Latin America ).
This city:
44.8%Florida:
21.1%
Median real estate property taxes paid for housing units with mortgages in 2022: $3,232 (0.9%)Median real estate property taxes paid for housing units with no mortgage in 2022: $1,598 (0.6%)
Nearest city with pop. 200,000+: Hialeah, FL
Nearest city with pop. 1,000,000+: Houston, TX
Nearest cities:
Latitude: 26.16 N, Longitude: 80.29 W
Daytime population change due to commuting: -3,882 (-4.0%)Workers who live and work in this city: 11,587 (22.8%)
Property values in Sunrise, FL
Sunrise tourist attractions:
Single-family new house construction building permits:
2017: 121 buildings , average cost: $261,9002016: 1 building , cost: $120,0002015: 10 buildings , average cost: $151,8002012: 6 buildings , average cost: $264,5002011: 292 buildings , average cost: $132,6002010: 92 buildings , average cost: $283,7002009: 83 buildings , average cost: $231,9002008: 111 buildings , average cost: $135,0002007: 20 buildings , average cost: $85,2002006: 18 buildings , average cost: $84,3002005: 1 building , cost: $287,0002004: 46 buildings , average cost: $76,3002003: 282 buildings , average cost: $78,1002002: 137 buildings , average cost: $75,9002001: 177 buildings , average cost: $77,5002000: 347 buildings , average cost: $79,0001999: 397 buildings , average cost: $75,3001998: 245 buildings , average cost: $86,5001997: 158 buildings , average cost: $99,900Unemployment in December 2023:
Population change in the 1990s: +19,200 (+28.8%).
Most common occupations in Sunrise, FL (%)
Both Males Females
Other sales and related occupations, including supervisors (5.4%)
Other office and administrative support workers, including supervisors (4.4%)
Other management occupations, except farmers and farm managers (3.9%)
Retail sales workers, except cashiers (3.7%)
Customer service representatives (3.3%)
Secretaries and administrative assistants (3.1%)
Preschool, kindergarten, elementary, and middle school teachers (3.1%)
Other sales and related occupations, including supervisors (6.3%)
Electrical equipment mechanics and other installation, maintenance, and repair workers, including supervisors (5.3%)
Other management occupations, except farmers and farm managers (4.8%)
Material recording, scheduling, dispatching, and distributing workers (4.1%)
Driver/sales workers and truck drivers (3.8%)
Vehicle and mobile equipment mechanics, installers, and repairers (3.7%)
Building and grounds cleaning and maintenance occupations (3.6%)
Other office and administrative support workers, including supervisors (7.1%)
Secretaries and administrative assistants (6.2%)
Preschool, kindergarten, elementary, and middle school teachers (4.9%)
Customer service representatives (4.6%)
Other sales and related occupations, including supervisors (4.4%)
Registered nurses (4.4%)
Information and record clerks, except customer service representatives (4.1%)
Tornado activity:
Sunrise-area historical tornado activity is slightly below Florida state average. It is 24% smaller than the overall U.S. average.
On 3/1/1980, a category F3 (max. wind speeds 158-206 mph) tornado 7.3 miles away from the Sunrise city center killed one person and injured 33 people and caused between $5,000,000 and $50,000,000 in damages.
On 2/23/1965, a category F3 tornado 8.2 miles away from the city center injured 6 people and caused between $50,000 and $500,000 in damages.
Earthquake activity:
Sunrise-area historical earthquake activity is significantly below Florida state average. It is 99% smaller than the overall U.S. average. On 9/10/2006 at 14:56:08, a magnitude 5.9 (5.9 MB, 5.5 MS, 5.8 MW, Class: Moderate, Intensity: VI - VII) earthquake occurred 393.7 miles away from Sunrise center On 2/22/1992 at 04:21:34, a magnitude 3.2 (3.2 MB, Depth: 6.2 mi, Class: Light, Intensity: II - III) earthquake occurred 87.8 miles away from the city center On 6/23/2016 at 17:20:29, a magnitude 3.8 (3.8 ML) earthquake occurred 270.3 miles away from the city center On 7/16/2016 at 20:00:10, a magnitude 3.7 (3.7 MB) earthquake occurred 254.9 miles away from the city center On 9/21/2016 at 16:30:52, a magnitude 3.8 (3.8 ML) earthquake occurred 275.1 miles away from the city center On 9/4/2016 at 18:29:29, a magnitude 3.8 (3.8 ML) earthquake occurred 276.1 miles away from the city center Magnitude types: body-wave magnitude (MB), local magnitude (ML), surface-wave magnitude (MS), moment magnitude (MW) Natural disasters: The number of natural disasters in Broward County (27) is a lot greater than the US average (15).Major Disasters (Presidential) Declared: 15Emergencies Declared: 8Hurricanes: 16, Fires: 3, Floods: 3, Tornadoes: 3, Freezes: 2, Tropical Storms: 2, Heavy Rain: 1, Storm: 1, Wind: 1, Other: 2 (Note: some incidents may be assigned to more than one category). Main business address for: E COM VENTURES INC RETAIL-MISCELLANEOUS RETAIL ), PEDIATRIX MEDICAL GROUP INC SERVICES-HOSPITALS ), MAYORS JEWELERS INC/DE RETAIL-JEWELRY STORES ), Odimo INC RETAIL-JEWELRY STORES ), NationsHealth, Inc. RETAIL-DRUG STORES AND PROPRIETARY STORES ).
Hospitals in Sunrise: HEALTHSOUTH SUNRISE REHABILITATION HOSPITAL (4399 NOB HILL ROAD) SUNRISE REGIONAL MEDICAL CENTER (555 SW 148TH AVE) Home Health Centers in Sunrise: A + QUALITY HOME HEALTH CARE (10286 NW 47TH ST) ABBEY HOME HEALTH CARE INC (7800 W OAKLAND PARK BLVD STE E115) ASERACARE HOME HEALTH (13680 NW 5TH STREET SUITE 220) EXECUTIVE CARE OF FLORIDA, INC (10226 NW 47 ST) HOME HEALTH CARE TEAM, LLC (2574 N UNIVERSITY DR, STE 216) ISIS HOME HEALTH CARE INC (4690 NW 103RD AVE) MASTER HOME HEALTH CARE INC (10001 NW 50 ST STE 102A) P AND M HOME HEALTH SERVICES LLC (6299 W SUNRISE BLVD STE 201) SHANDS HOMECARE (13650 NW 8TH STREET 103) TEAM NURSING, INC (6561 SUNSET STRIP) Nursing Homes in Sunrise: REGENTS PARK OF SUNRISE (9711 W OAKLAND PARK BLVD) SPRINGTREE REHABILITATION AND HEALTH CARE CENTER (4251 SPRINGTREE DRIVE) SUNRISE HEALTH AND REHABILITATION CENTER (4800 NOB HILL ROAD) Heliports located in Sunrise: Amtrak stations near Sunrise: 8 miles: FORT LAUDERDALE (200 SW 21ST TERRACE) Services: ticket office, partially wheelchair accessible, enclosed waiting area, public restrooms, public payphones, vending machines, free short-term parking, free long-term parking, call for car rental service, call for taxi service, public transit connection.
13 miles: HOLLYWOOD (3001 HOLLYWOOD BLVD.) Services: ticket office, partially wheelchair accessible, enclosed waiting area, public restrooms, public payphones, vending machines, free short-term parking, free long-term parking, taxi stand, public transit connection.
16 miles: DEERFIELD BEACH (1300 W. HILLSBORO BLVD.) Services: ticket office, fully wheelchair accessible, enclosed waiting area, public restrooms, public payphones, free short-term parking, free long-term parking, call for taxi service, public transit connection.
Colleges/universities with over 2000 students nearest to Sunrise:
Nova Southeastern University (about 7 miles; Fort Lauderdale, FL ; Full-time enrollment: 25,621)
Broward College (about 7 miles; Fort Lauderdale, FL ; FT enrollment: 30,322)
Keiser University-Ft Lauderdale (about 8 miles; Fort Lauderdale, FL ; FT enrollment: 18,270)
DeVry University-Florida (about 13 miles; Miramar, FL ; FT enrollment: 3,674)
Everest University-Pompano Beach (about 13 miles; Pompano Beach, FL ; FT enrollment: 2,316)
St Thomas University (about 17 miles; Miami Gardens, FL ; FT enrollment: 2,096)
Lynn University (about 19 miles; Boca Raton, FL ; FT enrollment: 2,151)
Public high schools in Sunrise: ARC BROWARD, INC. Location: 10250 NW 53RD ST, Grades: PK-12)ACADEMIC SOLUTIONS HIGH SCHOOL Location: 4099 N PINE ISLAND RD, Grades: 9-12, Charter school )
Biggest public elementary/middle schools in Sunrise: WESTPINE MIDDLE SCHOOL Students: 1,483, Location: 9393 NW 50TH ST, Grades: 6-8)SAWGRASS ELEMENTARY SCHOOL Students: 486, Location: 12655 NW 8TH ST, Grades: PK-5)SANDPIPER ELEMENTARY SCHOOL Students: 420, Location: 3700 N HIATUS RD, Grades: PK-5)WELLEBY ELEMENTARY SCHOOL Location: 3230 N NOB HILL RD, Grades: PK-5)
VILLAGE ELEMENTARY SCHOOL Location: 2100 NW 70TH AVE, Grades: PK-5)
HORIZON ELEMENTARY SCHOOL Location: 2101 N PINE ISLAND RD, Grades: PK-5)
BAIR MIDDLE SCHOOL Location: 9100 NW 21ST MNR, Grades: 6-8)
NOB HILL ELEMENTARY SCHOOL Location: 2100 NW 104TH AVE, Grades: PK-5)
BANYAN ELEMENTARY SCHOOL Location: 8800 NW 50TH ST, Grades: PK-5)
DISCOVERY ELEMENTARY SCHOOL Location: 8800 NW 54TH CT, Grades: PK-5)Private elementary/middle schools in Sunrise: ALL SAINTS CATHOLIC SCHOOL Students: 264, Location: 10900 W OAKLAND PARK BLVD, Grades: KG-8)
SALAH TAWFIK ELEMENTARY & MIDDLE SCHOOL Students: 180, Location: 5455 NW 108TH AVE, Grades: PK-8)
See full list of schools located in Sunrise
Notable locations in Sunrise: (A) , Sunrise Country Club (B) , Harrison Industrial Park (C) , Turnbull Bay Golf and Country Club (D) , Nob Hill Plaza (E) , Lake Nona Golf and Country Club (F) , Inverrama Shopping Plaza (G) , Sawgrass International Corporate Center (H) , Sunsey Square (I) , Sunrise Plaza (J) , Welleby Plaza (K) , University Plaza (L) , Royal Plaza Shopping and Office Complex (M) , Sunrise Sports Complex (N) , Sunrise Town Center (O) , Sunset Strip Branch Library (P) , Sunrise City Hall (Q) , Sunrise Dan Pearl Branch Library (R) , Sunrise Fire Station (S) , Sunrise Health and Rehabilitation Center (T) . Display/hide their locations on the map
Shopping Centers: (1) , Old Florida Plaza Shopping Center (2) , Lincoln Park Shopping Center (3) , Gold Coast Plaza Shopping Center (4) , Sawgrass Mills Shopping Center (5) , Shoppes of Sawgrass Shopping Center (6) , Springtree Shopping Center (7) , Welleby Square Shopping Center (8) . Display/hide their locations on the map
Main business address in Sunrise include: (A) , PEDIATRIX MEDICAL GROUP INC (B) , MAYORS JEWELERS INC/DE (C) , Odimo INC (D) , NationsHealth, Inc. (E) . Display/hide their locations on the map
Park in Sunrise: (1) . Display/hide its location on the map
Hotels: (1) , Baymont Inns & Suites (13651 Northwest 2nd Street) (2) . Display/hide their approximate locations on the map
Birthplace of: Josh Robinson - Football cornerback, Stanley Arnoux - Football player.
Broward County has a predicted average indoor radon screening level less than 2 pCi/L (pico curies per liter) - Low Potential Average household size: This city:
2.6 peopleFlorida:
2.5 people
Percentage of family households: This city:
66.5%Whole state:
65.2%
Percentage of households with unmarried partners: This city:
6.7%Whole state:
7.3%
Likely homosexual households (counted as self-reported same-sex unmarried-partner households)
Lesbian couples: 0.4% of all households Gay men: 0.4% of all households
People in group quarters in Sunrise in 2010:
496 people in nursing facilities/skilled-nursing facilities
49 people in group homes intended for adults
15 people in other noninstitutional facilities
10 people in group homes for juveniles (non-correctional)
8 people in workers' group living quarters and job corps centers
People in group quarters in Sunrise in 2000:
685 people in nursing homes
285 people in other noninstitutional group quarters
59 people in mental (psychiatric) hospitals or wards
27 people in homes for abused, dependent, and neglected children
10 people in other nonhousehold living situations
Arena or stadium:
BankAtlantic Center. Florida Panthers (NHL).
Banks with most branches in Sunrise (2011 data):
Wells Fargo Bank, National Association: Sunset Strip Branch, Welleby Plaza Branch, West Sunrise, Bonaventure Branch. Info updated 2011/04/05: Bank assets: $1,161,490.0 mil, Deposits: $905,653.0 mil, headquarters in Sioux Falls, SD, positive income , 6395 total offices , Holding Company: Wells Fargo & Company
Bank of America, National Association: Sunrise Branch, West Oakland Branch, Nob Hill Branch. Info updated 2009/11/18: Bank assets: $1,451,969.3 mil, Deposits: $1,077,176.8 mil, headquarters in Charlotte, NC, positive income , 5782 total offices , Holding Company: Bank Of America Corporation
JPMorgan Chase Bank, National Association: Sunrise Branch at 12590 West Sunrise Boulevard, branch established on 1994/10/03; N University Drive Branch at 3300 N. North University Drive, branch established on 1933/12/01. Info updated 2011/11/10: Bank assets: $1,811,678.0 mil, Deposits: $1,190,738.0 mil, headquarters in Columbus, OH, positive income , International Specialization, 5577 total offices , Holding Company: Jpmorgan Chase & Co.
Firstbank of Puerto Rico: Sunrise Branch at 10147-A West Oakland Park Booulevard, Welleby Plaza, branch established on 1997/01/06. Info updated 2009/10/06: Bank assets: $13,111.7 mil, Deposits: $9,952.9 mil, headquarters in Santurce, PR, negative income in the last year , Commercial Lending Specialization, 17 total offices , Holding Company: First Bancorp
BankAtlantic: West Oakland Park Branch at 3401 Pine Island Road, branch established on 1981/02/18. Info updated 2011/07/21: Bank assets: $3,648.1 mil, Deposits: $3,293.2 mil, headquarters in Fort Lauderdale, FL, negative income in the last year , Commercial Lending Specialization, 78 total offices
BankUnited, National Association: Sunrise Branch at 13705 West Sunrise Boulevard, branch established on 2004/07/30. Info updated 2012/03/05: Bank assets: $11,197.9 mil, Deposits: $7,515.1 mil, headquarters in Miami Lakes, FL, positive income , 82 total offices
Branch Banking and Trust Company: Sunrise Branch at 1580 Sawgrass Corporate Pkwy Ste 120, branch established on 2003/01/27. Info updated 2010/03/29: Bank assets: $168,867.6 mil, Deposits: $127,549.5 mil, headquarters in Winston Salem, NC, positive income , Commercial Lending Specialization, 1793 total offices , Holding Company: Bb&T Corporation
Great Florida Bank: Sawgrass Office at 143 N.W. 136th Avenue, branch established on 2008/06/23. Info updated 2010/08/19: Bank assets: $1,145.7 mil, Deposits: $994.9 mil, headquarters in Coral Gables, FL, negative income in the last year , Commercial Lending Specialization, 26 total offices
Banco Popular North America: Sunrise Branch at 8401 West Oakland Park Boulevard, branch established on 2003/04/28. Info updated 2012/01/27: Bank assets: $8,605.3 mil, Deposits: $6,167.7 mil, headquarters in New York, NY, positive income , Commercial Lending Specialization, 97 total offices , Holding Company: Popular, Inc.
4 other banks with 4 local branches
For population 15 years and over in Sunrise:
Never married: 35.8%Now married: 43.0%Separated: 2.5%Widowed: 5.3%Divorced: 13.4% For population 25 years and over in Sunrise:
High school or higher: 88.4%Bachelor's degree or higher: 36.9%Graduate or professional degree: 11.7%Unemployed: 4.4%Mean travel time to work (commute): 26.3 minutes
Education Gini index (Inequality in education) Here:
11.2Florida average:
12.2
Religion statistics for Sunrise, FL (based on Broward County data)
Religion Adherents Congregations Catholic 280,324 47 Evangelical Protestant 221,258 701 Other 63,064 143 Mainline Protestant 53,412 88 Black Protestant 17,866 45 Orthodox 5,648 16 None 1,106,494 -
Source: Clifford Grammich, Kirk Hadaway, Richard Houseal, Dale E.Jones, Alexei Krindatch, Richie Stanley and Richard H.Taylor. 2012. 2010 U.S.Religion Census: Religious Congregations & Membership Study. Association of Statisticians of American Religious Bodies. Jones, Dale E., et al. 2002. Congregations and Membership in the United States 2000. Nashville, TN: Glenmary Research Center. Graphs represent county-level data
Food Environment Statistics: Number of grocery stores : 359Broward County :
2.05 / 10,000 pop.Florida :
2.04 / 10,000 pop.
Number of supercenters and club stores : 15Broward County :
0.09 / 10,000 pop.Florida :
0.11 / 10,000 pop.
Number of convenience stores (no gas) : 268This county :
1.53 / 10,000 pop.State :
1.28 / 10,000 pop.
Number of convenience stores (with gas) : 391Broward County :
2.24 / 10,000 pop.Florida :
3.04 / 10,000 pop.
Number of full-service restaurants : 1,399Broward County :
8.00 / 10,000 pop.Florida :
7.45 / 10,000 pop.
Adult diabetes rate : Broward County :
8.4%Florida :
9.2%
Adult obesity rate : This county :
20.6%State :
23.7%
Low-income preschool obesity rate : Broward County :
14.0%Florida :
14.0%
Health and Nutrition:
Average overall health of teeth and gums : People feeling badly about themselves : Sunrise:
18.9%Florida:
19.5%
People not drinking alcohol at all : Average hours sleeping at night : Overweight people : This city:
34.2%State:
34.7%
General health condition : This city:
57.1%Florida:
57.0%
Average condition of hearing : This city:
80.1%State:
79.2%
More about Health and Nutrition of Sunrise, FL Residents
Local government employment and payroll (March 2022)
Function
Full-time employees
Monthly full-time payroll
Average yearly full-time wage
Part-time employees
Monthly part-time payroll
Water Supply
202 $1,326,190 $78,784 1 $830 Police Protection - Officers
180 $1,921,251 $128,083 6 $17,825 Firefighters
163 $1,590,768 $117,112 0 $0 Housing and Community Development (Local)
87 $643,190 $88,716 1 $2,776 Parks and Recreation
87 $442,708 $61,063 60 $101,217 Police - Other
62 $342,059 $66,205 29 $73,160 Financial Administration
58 $473,242 $97,912 1 $1,157 Other and Unallocable
43 $256,928 $71,701 0 $0 Other Government Administration
32 $272,645 $102,242 2 $3,926 Sewerage
23 $111,369 $58,106 0 $0 Gas Supply
21 $113,470 $64,840 0 $0 Welfare
17 $86,806 $61,275 3 $4,353 Fire - Other
8 $55,143 $82,715 0 $0 Judicial and Legal
5 $64,423 $154,615 0 $0 Solid Waste Management
1 $9,287 $111,444 0 $0
Totals for Government
989 $7,709,479 $93,543 103 $205,244
Sunrise government finances - Expenditure in 2021 (per resident):
Construction - Water Utilities: $22,869,000 ($237.46)
General - Other: $3,108,000 ($32.27)Regular Highways: $1,086,000 ($11.28)Current Operations - Police Protection: $48,158,000 ($500.05)
Sewerage: $34,553,000 ($358.78)Water Utilities: $32,920,000 ($341.83)Local Fire Protection: $30,122,000 ($312.77)Parks and Recreation: $13,526,000 ($140.45)Solid Waste Management: $13,373,000 ($138.86)Protective Inspection and Regulation - Other: $8,931,000 ($92.74)Central Staff Services: $7,974,000 ($82.80)Financial Administration: $6,776,000 ($70.36)Gas Utilities: $6,275,000 ($65.16)Natural Resources - Other: $5,034,000 ($52.27)Regular Highways: $3,475,000 ($36.08)Judicial and Legal Services: $1,223,000 ($12.70)General - Other: $1,181,000 ($12.26)Transit Utilities: $822,000 ($8.54)Housing and Community Development: $338,000 ($3.51)Parking Facilities: $2,000 ($0.02)General - Interest on Debt: $2,065,000 ($21.44)
Other Capital Outlay - Parks and Recreation: $11,596,000 ($120.41)
Local Fire Protection: $654,000 ($6.79)Police Protection: $244,000 ($2.53)Protective Inspection and Regulation - Other: $63,000 ($0.65)Central Staff Services: $53,000 ($0.55)Natural Resources - Other: $28,000 ($0.29)Financial Administration: $3,000 ($0.03)Water Utilities - Interest on Debt: $8,582,000 ($89.11)
Sunrise government finances - Revenue in 2021 (per resident):
Charges - Sewerage: $60,054,000 ($623.57)
Other: $30,802,000 ($319.83)Solid Waste Management: $12,193,000 ($126.61)Natural Resources - Other: $9,242,000 ($95.96)Parks and Recreation: $1,844,000 ($19.15)Regular Highways: $24,000 ($0.25)Federal Intergovernmental - Other: $4,888,000 ($50.75)
Housing and Community Development: $367,000 ($3.81)Public Welfare: $29,000 ($0.30)Local Intergovernmental - General Local Government Support: $94,000 ($0.98)
Other: $86,000 ($0.89)Miscellaneous - Special Assessments: $12,203,000 ($126.71)
General Revenue - Other: $7,754,000 ($80.51)Interest Earnings: $5,643,000 ($58.59)Fines and Forfeits: $1,931,000 ($20.05)Rents: $294,000 ($3.05)Donations From Private Sources: $143,000 ($1.48)Revenue - Water Utilities: $55,909,000 ($580.53)
Gas Utilities: $7,400,000 ($76.84)State Intergovernmental - General Local Government Support: $8,847,000 ($91.86)
Sewerage: $753,000 ($7.82)Other: $452,000 ($4.69)Housing and Community Development: $158,000 ($1.64)Highways: $107,000 ($1.11)Tax - Property: $49,897,000 ($518.11)
Public Utilities Sales: $13,063,000 ($135.64)Occupation and Business License - Other: $11,214,000 ($116.44)Other License: $7,682,000 ($79.77)Insurance Premiums Sales: $1,719,000 ($17.85)Motor Fuels Sales: $1,471,000 ($15.27)
Sunrise government finances - Debt in 2021 (per resident):
Long Term Debt - Outstanding Unspecified Public Purpose: $244,804,000 ($2541.94)
Beginning Outstanding - Unspecified Public Purpose: $226,634,000 ($2353.27)Issue, Unspecified Public Purpose: $24,997,000 ($259.56)Retired Unspecified Public Purpose: $14,023,000 ($145.61)Beginning Outstanding - Public Debt for Private Purpose: $1,126,000 ($11.69)Retired Nonguaranteed - Public Debt for Private Purpose: $563,000 ($5.85)Outstanding Nonguaranteed - Industrial Revenue: $563,000 ($5.85)
Sunrise government finances - Cash and Securities in 2021 (per resident):
Bond Funds - Cash and Securities: $42,282,000 ($439.04)
Other Funds - Cash and Securities: $504,274,000 ($5236.16)
Sinking Funds - Cash and Securities: $5,921,000 ($61.48)
6.62% of this county's 2021 resident taxpayers lived in other counties in 2020 ($102,632 average adjusted gross income )
Here:
6.62%Florida average:
8.80%
0.03% of residents moved from foreign countries ($231 average AGI )Broward County:
0.03%Florida average:
0.05%
Top counties from which taxpayers relocated into this county between 2020 and 2021:
6.99% of this county's 2020 resident taxpayers moved to other counties in 2021 ($73,182 average adjusted gross income )
Here:
6.99%Florida average:
7.45%
0.03% of residents moved to foreign countries ($336 average AGI )Broward County:
0.03%Florida average:
0.04%
Top counties to which taxpayers relocated from this county between 2020 and 2021:
Businesses in Sunrise, FL
Name Count Name Count
24 Hour Fitness 1 Johnny Rockets 1 7-Eleven 3 Jones New York 1 ALDO 2 Journeys 1 AT&T 2 Juicy Couture 1 Advance Auto Parts 2 Justice 1 Aeropostale 1 KFC 3 American Eagle Outfitters 1 LA Fitness 2 Ann Taylor 1 La Quinta 2 Arby's 1 La-Z-Boy 1 Ashley Furniture 1 Lane Bryant 1 Banana Republic 1 LensCrafters 1 Bath & Body Works 1 Levi Strauss & Co. 1 Bed Bath & Beyond 1 Little Caesars Pizza 1 Ben & Jerry's 1 Lowe's 1 Blockbuster 1 Marshalls 1 Brooks Brothers 1 MasterBrand Cabinets 4 Budget Car Rental 1 McDonald's 7 Burger King 6 Men's Wearhouse 1 Burlington Coat Factory 1 Motherhood Maternity 1 CVS 2 Nike 16 Cache 1 Nordstrom 1 Charlotte Russe 1 Office Depot 2 Chevrolet 1 OfficeMax 1 Chick-Fil-A 1 Pac Sun 1 Chico's 1 Panda Express 2 Chipotle 1 Panera Bread 1 Chuck E. Cheese's 1 Payless 2 Cinnabon 2 Pizza Hut 2 Circle K 1 Popeyes 1 Clarks 1 Publix Super Markets 3 Curves 1 Quiznos 2 DHL 5 RadioShack 2 Dairy Queen 2 Sam's Club 1 Decora Cabinetry 2 Skechers USA 1 Dunkin Donuts 5 Spencer Gifts 1 Famous Footwear 1 Sprint Nextel 3 FedEx 17 Staples 1 Finish Line 1 Starbucks 4 Foot Locker 1 Steak 'n Shake 1 Ford 1 Subway 8 Forever 21 1 T-Mobile 4 GNC 2 T.G.I. Driday's 1 GameStop 3 T.J.Maxx 1 Gap 1 Taco Bell 3 Gymboree 1 Target 1 H&R Block 2 The Athlete's Foot 1 Haagen-Dazs 1 The Cheesecake Factory 1 Havertys Furniture 1 Tire Kingdom 2 Holiday Inn 2 U-Haul 3 Home Depot 2 UPS 11 Hot Topic 1 Value City Furniture 1 IHOP 1 Vans 7 IZOD 1 Victoria's Secret 1 J.Crew 1 Walgreens 4 JCPenney 1 Walmart 2
Strongest AM radio stations in Sunrise:
WWNN (1470 AM; 50 kW; POMPANO BEACH, FL; Owner: WWNN LICENSE, LLC)
WAQI (710 AM; 50 kW; MIAMI, FL; Owner: LICENSE CORPORATION #1)
WRFX (940 AM; 50 kW; MIAMI, FL; Owner: CLEAR CHANNEL BROADCASTING LICENSES, INC.)
WSRF (1580 AM; 10 kW; FORT LAUDERDALE, FL; Owner: URBAN RADIO OF FLORIDA, LLC)
WWFE (670 AM; 50 kW; MIAMI, FL; Owner: FENIX BROADCASTING CORP.)
WNMA (1210 AM; 49 kW; MIAMI SPRINGS, FL; Owner: RADIO UNICA OF MIAMI LICENSE CORP.)
WAVS (1170 AM; 5 kW; DAVIE, FL; Owner: RADIO WAVS, INC.)
WRHC (1550 AM; 45 kW; CORAL GABLES, FL; Owner: WRHC BROADCASTING CORP.)
WSUA (1260 AM; 50 kW; MIAMI, FL; Owner: WSUA BROADCASTING CORPORATION)
WLQY (1320 AM; 5 kW; HOLLYWOOD, FL; Owner: ENTRAVISION HOLDINGS, LLC)
WQBA (1140 AM; 50 kW; MIAMI, FL; Owner: WQBA-AM LICENSE CORP.)
WLVJ (1040 AM; 25 kW; BOYNTON BEACH, FL; Owner: JAMES CRYSTAL BOYNTON BEACH, INC.)
WFTL (850 AM; 50 kW; WEST PALM BEACH, FL; Owner: JAMES CRYSTAL ENTERPRISES II, L.L.C.)
Strongest FM radio stations in Sunrise:
WEDR (99.1 FM; MIAMI, FL; Owner: COX RADIO, INC.)
WBGG-FM (105.9 FM; FORT LAUDERDALE, FL; Owner: CLEAR CHANNEL BROADCASTING LICENSES, INC.)
WKPX (88.5 FM; SUNRISE, FL; Owner: SCHOOL BOARD OF BROWARD COUNTY, FLORIDA)
WHYI-FM (100.7 FM; FORT LAUDERDALE, FL; Owner: CLEAR CHANNEL BROADCASTING LICENSES, INC.)
WKIS (99.9 FM; BOCA RATON, FL; Owner: WKIS LICENSE LIMITED PARTNERSHIP)
WRMA (106.7 FM; FORT LAUDERDALE, FL; Owner: WRMA LICENSING, INC.)
WFLC (97.3 FM; MIAMI, FL; Owner: COX RADIO, INC.)
WPYM (93.1 FM; MIAMI, FL; Owner: COX RADIO-MIAMI, LLC)
WHQT (105.1 FM; CORAL GABLES, FL; Owner: COX RADIO, INC.)
WLVE (93.9 FM; MIAMI BEACH, FL; Owner: CLEAR CHANNEL BROADCASTING LICENSES, INC.)
WMIB (103.5 FM; FORT LAUDERDALE, FL; Owner: CLEAR CHANNEL BROADCASTING LICENSES, INC.)
WMXJ (102.7 FM; POMPANO BEACH, FL; Owner: JEFFERSON-PILOT COMMUNICATIONS CO. OF FLORIDA)
WPOW (96.5 FM; MIAMI, FL; Owner: WPOW LICENSE LIMITED PARTNERSHIP)
WZTA (94.9 FM; MIAMI BEACH, FL; Owner: CLEAR CHANNEL BROADCASTING LICENSES, INC.)
WLRN-FM (91.3 FM; MIAMI, FL; Owner: THE SCHOOL BOARD OF MIAMI - DADE COUNTY, FL)
WLYF (101.5 FM; MIAMI, FL; Owner: JEFFERSON-PILOT COMMUNICATIONS CO. OF FLORIDA)
WXDJ (95.7 FM; NORTH MIAMI BEACH, FL; Owner: WXDJ LICENSING, INC.)
WEAT-FM (104.3 FM; WEST PALM BEACH, FL; Owner: INFINITY RADIO OPERATIONS INC.)
WAMR-FM (107.5 FM; MIAMI, FL; Owner: WQBA-FM LICENSE CORP.)
WXEL (90.7 FM; WEST PALM BEACH, FL; Owner: BARRY TELECOMMUNICATIONS, INC.)
TV broadcast stations around Sunrise:
WHDT-LP (Channel 44; MIAMI, FL; Owner: GUENTER MARKSTEINER)
WPBT (Channel 2; MIAMI, FL; Owner: COMMUNITY TV FOUNDATION OF S. FLORIDA, INC.)
WSVN (Channel 7; MIAMI, FL; Owner: SUNBEAM TELEVISION CORP.)
WAMI-TV (Channel 69; HOLLYWOOD, FL; Owner: TELEFUTURA MIAMI LLC)
W58BU (Channel 58; HALLANDALE, FL; Owner: NBC STATIONS MANAGEMENT,INC.)
WPPB-TV (Channel 63; BOCA RATON, FL; Owner: THE SCHOOL BOARD OF BROWARD COUNTY, FLORIDA)
WSCV (Channel 51; FORT LAUDERDALE, FL; Owner: TELEMUNDO OF FLORIDA LICENSE CORP.)
WHFT-TV (Channel 45; MIAMI, FL; Owner: TRINITY BROADCASTING OF FLORIDA, INC.)
WLRN-TV (Channel 17; MIAMI, FL; Owner: THE SCHOOL BOARD OF MIAMI - DADE COUNTY, FL)
W24CA (Channel 24; MARATHON, FL; Owner: KEY COMMUNICATIONS OF TEXAS)
WPLG (Channel 10; MIAMI, FL; Owner: POST-NEWSWEEK STATIONS, FLORIDA, INC.)
WLTV (Channel 23; MIAMI, FL; Owner: WLTV LICENSE PARTNERSHIP, G.P.)
WBZL (Channel 39; MIAMI, FL; Owner: CHANNEL 39, INC.)
WBFS-TV (Channel 33; MIAMI, FL; Owner: VIACOM STATIONS GROUP OF MIAMI INC.)
WPXM (Channel 35; MIAMI, FL; Owner: PAXSON COMMUNICATIONS LICENSE COMPANY, LLC)
WLMF-LP (Channel 53; MIAMI, FL; Owner: PAGING SYSTEMS, INC.)
WPTV (Channel 5; WEST PALM BEACH, FL; Owner: SCRIPPS HOWARD BROADCASTING COMPANY)
WFLX (Channel 29; WEST PALM BEACH, FL; Owner: RAYCOM NATIONAL, INC.)
WXEL-TV (Channel 42; WEST PALM BEACH, FL; Owner: BARRY TELECOMMUNICATIONS, INC.)
WFUN-CA (Channel 48; MIAMI, ETC., FL; Owner: LOCALONE TEXAS, LTD.)
WTVJ (Channel 6; MIAMI, FL; Owner: NBC STATIONS MANAGEMENT, INC.)
WPEC (Channel 12; WEST PALM BEACH, FL; Owner: FREEDOM BROADCASTING OF FLORIDA, INC)
WFGC (Channel 61; PALM BEACH, FL; Owner: CHRISTIAN TELEVISION OF PALM BEACH COUNTY, INC.)
WGEN-LP (Channel 55; MIAMI, FL; Owner: WDLP BROADCASTING COMPANY, LLC)
WDLP-CA (Channel 21; POMPANO BEACH, FL; Owner: WDLP BROADCASTING COMPANY, LLC)
National Bridge Inventory (NBI) Statistics 88 Number of bridges2,178ft / 664m Total length2,248,223 Total average daily traffic163,574 Total average daily truck traffic
New bridges - historical statistics
1 1960-1969 5 1970-1979 71 1980-1989 3 1990-1999 7 2010-2019 1 2020-2022
See full National Bridge Inventory statistics for Sunrise, FL
Home Mortgage Disclosure Act Aggregated Statistics For Year 2009(Based on 15 full and 1 partial tracts) A) FHA, FSA/RHS & VA B) Conventional C) Refinancings D) Home Improvement Loans F) Non-occupant Loans on G) Loans On Manufactured Number Average Value Number Average Value Number Average Value Number Average Value Number Average Value Number Average Value
LOANS ORIGINATED 462 $156,377 220 $111,209 377 $147,823 23 $57,653 83 $112,850 1 $176,030 APPLICATIONS APPROVED, NOT ACCEPTED 38 $152,375 30 $106,435 69 $156,366 9 $51,082 12 $100,087 1 $45,000 APPLICATIONS DENIED 114 $135,793 150 $132,871 474 $158,573 50 $50,999 101 $135,141 2 $43,500 APPLICATIONS WITHDRAWN 92 $143,758 45 $119,855 174 $163,777 3 $64,333 16 $109,826 0 $0 FILES CLOSED FOR INCOMPLETENESS 34 $125,604 21 $121,640 70 $170,304 0 $0 7 $134,251 0 $0
Aggregated Statistics For Year 2008(Based on 15 full and 1 partial tracts) A) FHA, FSA/RHS & VA B) Conventional C) Refinancings D) Home Improvement Loans E) Loans on Dwellings For 5+ Families F) Non-occupant Loans on G) Loans On Manufactured Number Average Value Number Average Value Number Average Value Number Average Value Number Average Value Number Average Value Number Average Value
LOANS ORIGINATED 237 $184,315 447 $142,966 649 $166,203 64 $75,345 2 $1,087,000 164 $131,341 0 $0 APPLICATIONS APPROVED, NOT ACCEPTED 17 $171,951 88 $173,902 215 $164,819 29 $92,107 0 $0 29 $125,489 2 $23,000 APPLICATIONS DENIED 139 $161,946 311 $164,500 913 $187,957 139 $77,649 0 $0 160 $166,311 7 $59,136 APPLICATIONS WITHDRAWN 86 $171,375 137 $158,964 240 $194,714 11 $86,091 0 $0 56 $141,552 0 $0 FILES CLOSED FOR INCOMPLETENESS 16 $167,499 59 $206,292 113 $193,630 8 $137,114 0 $0 20 $197,515 0 $0
Aggregated Statistics For Year 2007(Based on 15 full and 1 partial tracts) A) FHA, FSA/RHS & VA B) Conventional C) Refinancings D) Home Improvement Loans E) Loans on Dwellings For 5+ Families F) Non-occupant Loans on G) Loans On Manufactured Number Average Value Number Average Value Number Average Value Number Average Value Number Average Value Number Average Value Number Average Value
LOANS ORIGINATED 37 $248,115 1,331 $180,107 2,194 $183,430 249 $112,405 12 $3,174,835 366 $172,853 2 $65,500 APPLICATIONS APPROVED, NOT ACCEPTED 0 $0 255 $175,025 532 $180,902 65 $102,117 0 $0 83 $149,058 3 $93,407 APPLICATIONS DENIED 22 $252,932 753 $192,752 1,957 $204,293 270 $110,382 1 $130,000 332 $180,143 11 $110,885 APPLICATIONS WITHDRAWN 5 $195,034 217 $191,335 796 $202,433 57 $139,876 2 $1,013,000 70 $189,670 0 $0 FILES CLOSED FOR INCOMPLETENESS 1 $132,000 87 $208,886 298 $212,283 10 $178,980 0 $0 25 $194,767 0 $0
Aggregated Statistics For Year 2006(Based on 15 full and 1 partial tracts) A) FHA, FSA/RHS & VA B) Conventional C) Refinancings D) Home Improvement Loans E) Loans on Dwellings For 5+ Families F) Non-occupant Loans on G) Loans On Manufactured Number Average Value Number Average Value Number Average Value Number Average Value Number Average Value Number Average Value Number Average Value
LOANS ORIGINATED 22 $250,763 2,604 $160,269 3,331 $182,603 360 $120,867 7 $5,135,084 522 $165,104 4 $62,565 APPLICATIONS APPROVED, NOT ACCEPTED 2 $200,000 378 $154,237 649 $176,436 94 $83,310 1 $2,915,330 87 $147,114 3 $49,310 APPLICATIONS DENIED 5 $191,600 1,142 $162,433 1,706 $190,331 293 $97,261 1 $2,433,000 290 $156,734 10 $60,900 APPLICATIONS WITHDRAWN 2 $197,500 470 $161,914 1,216 $183,095 104 $126,133 3 $610,333 115 $160,414 0 $0 FILES CLOSED FOR INCOMPLETENESS 2 $263,500 165 $164,152 394 $193,584 20 $116,889 0 $0 29 $188,733 1 $146,000
Aggregated Statistics For Year 2005(Based on 15 full and 1 partial tracts) A) FHA, FSA/RHS & VA B) Conventional C) Refinancings D) Home Improvement Loans E) Loans on Dwellings For 5+ Families F) Non-occupant Loans on G) Loans On Manufactured Number Average Value Number Average Value Number Average Value Number Average Value Number Average Value Number Average Value Number Average Value
LOANS ORIGINATED 33 $166,480 3,400 $146,500 3,713 $165,342 373 $114,049 6 $5,136,167 741 $135,134 6 $130,833 APPLICATIONS APPROVED, NOT ACCEPTED 3 $209,543 443 $142,074 583 $157,383 74 $71,426 0 $0 103 $136,222 6 $39,660 APPLICATIONS DENIED 8 $224,812 1,049 $139,808 1,629 $163,890 350 $83,470 2 $348,000 267 $128,863 10 $32,097 APPLICATIONS WITHDRAWN 4 $235,122 591 $152,495 1,383 $165,892 138 $141,973 3 $459,333 110 $150,940 3 $185,423 FILES CLOSED FOR INCOMPLETENESS 1 $148,760 130 $154,426 577 $169,906 31 $67,631 0 $0 39 $160,236 1 $166,730
Aggregated Statistics For Year 2004(Based on 15 full and 1 partial tracts) A) FHA, FSA/RHS & VA B) Conventional C) Refinancings D) Home Improvement Loans E) Loans on Dwellings For 5+ Families F) Non-occupant Loans on G) Loans On Manufactured Number Average Value Number Average Value Number Average Value Number Average Value Number Average Value Number Average Value Number Average Value
LOANS ORIGINATED 88 $159,491 3,250 $129,863 3,306 $134,850 315 $77,046 14 $1,039,477 681 $110,772 9 $80,556 APPLICATIONS APPROVED, NOT ACCEPTED 5 $164,384 527 $117,741 595 $133,898 68 $64,457 1 $8,000,000 127 $98,809 3 $112,753 APPLICATIONS DENIED 21 $145,166 772 $123,851 1,655 $134,177 408 $48,976 1 $1,098,240 240 $111,761 11 $43,057 APPLICATIONS WITHDRAWN 13 $172,846 382 $134,195 1,031 $135,647 107 $72,778 0 $0 71 $118,917 2 $37,500 FILES CLOSED FOR INCOMPLETENESS 5 $159,550 103 $134,793 780 $146,913 31 $68,795 0 $0 32 $108,940 5 $115,800
Aggregated Statistics For Year 2003(Based on 15 full and 1 partial tracts) A) FHA, FSA/RHS & VA B) Conventional C) Refinancings D) Home Improvement Loans E) Loans on Dwellings For 5+ Families F) Non-occupant Loans on Number Average Value Number Average Value Number Average Value Number Average Value Number Average Value Number Average Value
LOANS ORIGINATED 234 $143,993 2,581 $121,200 4,977 $115,547 152 $35,897 6 $5,697,985 501 $96,597 APPLICATIONS APPROVED, NOT ACCEPTED 18 $150,778 316 $115,931 869 $112,848 55 $35,450 0 $0 74 $101,224 APPLICATIONS DENIED 39 $125,777 527 $114,250 2,327 $115,840 208 $31,612 0 $0 148 $101,388 APPLICATIONS WITHDRAWN 26 $154,745 285 $120,967 1,144 $117,210 33 $29,101 1 $8,000,000 57 $94,963 FILES CLOSED FOR INCOMPLETENESS 10 $120,000 98 $115,454 268 $116,077 16 $30,753 0 $0 19 $93,780
Aggregated Statistics For Year 2002(Based on 1 full tract) A) FHA, FSA/RHS & VA B) Conventional C) Refinancings D) Home Improvement Loans E) Loans on Dwellings For 5+ Families F) Non-occupant Loans on Number Average Value Number Average Value Number Average Value Number Average Value Number Average Value Number Average Value
LOANS ORIGINATED 24 $98,750 106 $66,123 127 $78,732 3 $19,000 3 $661,667 38 $57,184 APPLICATIONS APPROVED, NOT ACCEPTED 5 $80,600 15 $64,133 41 $94,561 1 $17,000 0 $0 8 $63,875 APPLICATIONS DENIED 6 $106,333 28 $79,893 101 $72,030 16 $23,938 0 $0 6 $81,000 APPLICATIONS WITHDRAWN 0 $0 9 $53,000 46 $76,000 0 $0 0 $0 2 $53,000 FILES CLOSED FOR INCOMPLETENESS 0 $0 4 $59,000 18 $72,167 0 $0 0 $0 1 $45,000
Aggregated Statistics For Year 2001(Based on 1 full tract) A) FHA, FSA/RHS & VA B) Conventional C) Refinancings D) Home Improvement Loans E) Loans on Dwellings For 5+ Families F) Non-occupant Loans on Number Average Value Number Average Value Number Average Value Number Average Value Number Average Value Number Average Value
LOANS ORIGINATED 29 $87,276 76 $53,026 86 $79,674 7 $19,286 2 $375,000 37 $50,568 APPLICATIONS APPROVED, NOT ACCEPTED 0 $0 15 $70,533 20 $74,750 1 $22,000 0 $0 6 $71,667 APPLICATIONS DENIED 4 $110,000 22 $71,545 107 $59,748 17 $18,000 0 $0 9 $58,556 APPLICATIONS WITHDRAWN 2 $52,000 13 $82,615 49 $76,755 3 $43,667 0 $0 2 $93,500 FILES CLOSED FOR INCOMPLETENESS 0 $0 2 $96,500 6 $93,000 0 $0 0 $0 0 $0
Aggregated Statistics For Year 2000(Based on 1 full tract) A) FHA, FSA/RHS & VA B) Conventional C) Refinancings D) Home Improvement Loans E) Loans on Dwellings For 5+ Families F) Non-occupant Loans on Number Average Value Number Average Value Number Average Value Number Average Value Number Average Value Number Average Value
LOANS ORIGINATED 30 $90,533 88 $47,466 40 $58,225 6 $9,500 1 $281,000 21 $43,571 APPLICATIONS APPROVED, NOT ACCEPTED 2 $62,500 11 $46,545 19 $70,947 8 $25,375 0 $0 8 $68,375 APPLICATIONS DENIED 2 $90,500 44 $46,409 69 $53,362 28 $16,929 0 $0 7 $57,429 APPLICATIONS WITHDRAWN 7 $89,286 8 $43,750 47 $44,255 2 $54,000 0 $0 3 $54,333 FILES CLOSED FOR INCOMPLETENESS 2 $63,500 4 $79,000 15 $52,267 0 $0 0 $0 1 $24,000
Aggregated Statistics For Year 1999(Based on 3 full and 2 partial tracts) A) FHA, FSA/RHS & VA B) Conventional C) Refinancings D) Home Improvement Loans E) Loans on Dwellings For 5+ Families F) Non-occupant Loans on Number Average Value Number Average Value Number Average Value Number Average Value Number Average Value Number Average Value
LOANS ORIGINATED 518 $92,388 1,443 $91,357 958 $89,394 168 $18,929 3 $546,943 168 $67,412 APPLICATIONS APPROVED, NOT ACCEPTED 20 $91,472 173 $93,073 330 $78,795 84 $24,067 0 $0 23 $76,433 APPLICATIONS DENIED 46 $96,571 342 $87,391 811 $84,838 236 $19,944 1 $61,810 47 $71,999 APPLICATIONS WITHDRAWN 37 $90,356 196 $93,900 501 $81,142 40 $41,278 2 $419,500 23 $81,122 FILES CLOSED FOR INCOMPLETENESS 9 $91,979 48 $105,407 162 $92,516 5 $14,020 1 $168,570 11 $56,296
Detailed mortgage data for all 16 tracts in Sunrise, FL
Private Mortgage Insurance Companies Aggregated Statistics For Year 2009(Based on 11 full and 1 partial tracts) A) Conventional B) Refinancings C) Non-occupant Loans on Number Average Value Number Average Value Number Average Value
LOANS ORIGINATED 16 $167,223 1 $91,000 1 $212,000 APPLICATIONS APPROVED, NOT ACCEPTED 11 $186,473 9 $150,556 1 $258,000 APPLICATIONS DENIED 6 $153,705 3 $63,667 0 $0 APPLICATIONS WITHDRAWN 2 $159,500 1 $235,940 0 $0 FILES CLOSED FOR INCOMPLETENESS 1 $39,000 1 $128,000 0 $0
Aggregated Statistics For Year 2008(Based on 15 full and 1 partial tracts) A) Conventional B) Refinancings C) Non-occupant Loans on D) Loans On Manufactured Number Average Value Number Average Value Number Average Value Number Average Value
LOANS ORIGINATED 170 $174,334 46 $223,591 22 $145,255 0 $0 APPLICATIONS APPROVED, NOT ACCEPTED 141 $197,735 88 $235,935 11 $197,761 1 $166,000 APPLICATIONS DENIED 27 $144,299 23 $187,736 15 $167,432 0 $0 APPLICATIONS WITHDRAWN 13 $134,822 7 $213,433 3 $173,227 0 $0 FILES CLOSED FOR INCOMPLETENESS 15 $157,777 6 $202,277 7 $178,237 0 $0
Aggregated Statistics For Year 2007(Based on 15 full and 1 partial tracts) A) Conventional B) Refinancings C) Non-occupant Loans on Number Average Value Number Average Value Number Average Value
LOANS ORIGINATED 491 $204,935 178 $233,338 32 $204,104 APPLICATIONS APPROVED, NOT ACCEPTED 72 $221,023 68 $247,562 15 $187,245 APPLICATIONS DENIED 16 $253,182 10 $189,800 6 $235,558 APPLICATIONS WITHDRAWN 47 $208,634 18 $225,845 4 $246,750 FILES CLOSED FOR INCOMPLETENESS 3 $196,287 0 $0 1 $59,000
Aggregated Statistics For Year 2006(Based on 15 full and 1 partial tracts) A) Conventional B) Refinancings C) Non-occupant Loans on Number Average Value Number Average Value Number Average Value
LOANS ORIGINATED 239 $227,475 84 $225,045 37 $209,171 APPLICATIONS APPROVED, NOT ACCEPTED 45 $226,869 38 $229,268 11 $150,639 APPLICATIONS DENIED 3 $255,333 3 $100,000 1 $153,000 APPLICATIONS WITHDRAWN 12 $192,295 12 $218,557 3 $172,607 FILES CLOSED FOR INCOMPLETENESS 3 $285,000 3 $240,000 0 $0
Aggregated Statistics For Year 2005(Based on 15 full and 1 partial tracts) A) Conventional B) Refinancings C) Non-occupant Loans on Number Average Value Number Average Value Number Average Value
LOANS ORIGINATED 428 $195,341 123 $191,043 79 $159,666 APPLICATIONS APPROVED, NOT ACCEPTED 99 $170,001 32 $196,751 25 $133,335 APPLICATIONS DENIED 9 $194,544 4 $266,310 2 $211,445 APPLICATIONS WITHDRAWN 28 $144,477 13 $175,375 4 $141,918 FILES CLOSED FOR INCOMPLETENESS 2 $198,500 1 $178,000 0 $0
Aggregated Statistics For Year 2004(Based on 15 full and 1 partial tracts) A) Conventional B) Refinancings C) Non-occupant Loans on D) Loans On Manufactured Number Average Value Number Average Value Number Average Value Number Average Value
LOANS ORIGINATED 747 $149,805 156 $157,675 115 $121,240 0 $0 APPLICATIONS APPROVED, NOT ACCEPTED 160 $140,605 64 $148,655 25 $110,127 1 $115,560 APPLICATIONS DENIED 19 $158,219 5 $145,356 5 $73,166 0 $0 APPLICATIONS WITHDRAWN 38 $136,904 19 $160,784 7 $98,817 0 $0 FILES CLOSED FOR INCOMPLETENESS 8 $140,679 3 $127,360 1 $151,000 0 $0
Aggregated Statistics For Year 2003(Based on 15 full and 1 partial tracts) A) Conventional B) Refinancings C) Non-occupant Loans on Number Average Value Number Average Value Number Average Value
LOANS ORIGINATED 984 $135,917 374 $139,026 109 $111,712 APPLICATIONS APPROVED, NOT ACCEPTED 151 $122,130 109 $132,826 20 $101,591 APPLICATIONS DENIED 26 $161,527 11 $152,936 11 $141,069 APPLICATIONS WITHDRAWN 64 $142,389 47 $130,916 14 $123,410 FILES CLOSED FOR INCOMPLETENESS 4 $140,300 0 $0 0 $0
Aggregated Statistics For Year 2002(Based on 1 full tract) A) Conventional B) Refinancings C) Non-occupant Loans on Number Average Value Number Average Value Number Average Value
LOANS ORIGINATED 40 $80,375 6 $81,667 7 $71,857 APPLICATIONS APPROVED, NOT ACCEPTED 5 $85,000 2 $66,000 1 $38,000 APPLICATIONS DENIED 1 $158,000 0 $0 1 $158,000 APPLICATIONS WITHDRAWN 9 $52,778 1 $45,000 8 $52,625 FILES CLOSED FOR INCOMPLETENESS 0 $0 0 $0 0 $0
Aggregated Statistics For Year 2001(Based on 1 full tract) A) Conventional B) Refinancings C) Non-occupant Loans on Number Average Value Number Average Value Number Average Value
LOANS ORIGINATED 31 $68,290 2 $100,500 3 $79,000 APPLICATIONS APPROVED, NOT ACCEPTED 7 $85,857 2 $92,500 1 $70,000 APPLICATIONS DENIED 3 $86,333 1 $96,000 1 $88,000 APPLICATIONS WITHDRAWN 2 $106,500 0 $0 1 $103,000 FILES CLOSED FOR INCOMPLETENESS 0 $0 0 $0 0 $0
Aggregated Statistics For Year 2000(Based on 1 full tract) A) Conventional B) Refinancings C) Non-occupant Loans on Number Average Value Number Average Value Number Average Value
LOANS ORIGINATED 36 $56,750 6 $87,000 9 $66,333 APPLICATIONS APPROVED, NOT ACCEPTED 4 $51,250 2 $79,500 2 $47,000 APPLICATIONS DENIED 2 $118,500 0 $0 1 $144,000 APPLICATIONS WITHDRAWN 0 $0 1 $79,000 0 $0 FILES CLOSED FOR INCOMPLETENESS 0 $0 0 $0 0 $0
Aggregated Statistics For Year 1999(Based on 3 full and 2 partial tracts) A) Conventional B) Refinancings C) Non-occupant Loans on Number Average Value Number Average Value Number Average Value
LOANS ORIGINATED 578 $93,512 125 $100,733 34 $67,334 APPLICATIONS APPROVED, NOT ACCEPTED 40 $94,409 30 $104,807 0 $0 APPLICATIONS DENIED 44 $98,399 16 $101,789 4 $89,950 APPLICATIONS WITHDRAWN 33 $103,287 10 $124,573 2 $26,030 FILES CLOSED FOR INCOMPLETENESS 3 $118,267 3 $110,803 1 $19,100
Fire-safe hotels and motels in Sunrise, Florida:
Baymont Inn & Suites, 13651 NW 2ND St, Sunrise, Florida 33325 Phone: (954) 846-1200
Doubletree By Hilton Sunrise - Sawgrass Mills, 13400 W Sunrise Blvd, Sunrise, Florida 33323 Phone: (954) 851-1020, Fax: (954) 851-0500
All 2 fire-safe hotels and motels in Sunrise, Florida Sunrise compared to Florida state average:
Unemployed percentage significantly below state average. Black race population percentage above state average. Foreign-born population percentage significantly above state average. Sunrise, FL compared to other similar cities:
#3 on the list of "Top 101 cities with largest percentage of males in occupations: fire fighting and prevention workers including supervisors (population 50,000+)"
#6 on the list of "Top 101 cities with the lowest average snowfall in a year (population 50,000+)"
#11 on the list of "Top 101 cities with largest percentage of females in industries: administrative and support and waste management services (population 50,000+)"
#11 on the list of "Top 101 cities with the most residents born in Jamaica (population 500+)"
#11 on the list of "Top 101 cities with largest percentage of males in occupations: office and administrative support occupations (population 50,000+)"
#14 on the list of "Top 101 cities with largest percentage of females in occupations: extraction workers (population 50,000+)"
#14 on the list of "Top 101 cities with largest percentage of females in occupations: fishing and hunting, and forest and logging workers (population 50,000+)"
#14 on the list of "Top 101 cities with largest percentage of females in occupations: office and administrative support occupations (population 50,000+)"
#15 on the list of "Top 101 cities with largest percentage of males in industries: wholesale electronic markets and agents and brokers (population 50,000+)"
#15 on the list of "Top 101 cities with largest percentage of females in industries: wholesale electronic markets and agents and brokers (population 50,000+)"
#15 on the list of "Top 101 cities with largest percentage of males in industries: broadcasting, internet publishing, and telecommunications services (population 50,000+)"
#15 on the list of "Top 101 cities with largest percentage of females in industries: broadcasting, internet publishing, and telecommunications services (population 50,000+)"
#16 on the list of "Top 101 cities with largest percentage of females in occupations: fire fighting and prevention workers including supervisors (population 50,000+)"
#18 on the list of "Top 101 cities with the highest average temperatures (population 50,000+)"
#18 on the list of "Top 101 cities with the highest average yearly precipitation (population 50,000+)"
#25 on the list of "Top 101 cities with the smallest racial income disparities between White and Black householders (with at least 2,000 householders)"
#27 on the list of "Top 100 cities with the largest percentage of females (pop. 50,000+)"
#33 on the list of "Top 101 cities with largest percentage of males in industries: administrative and support and waste management services (population 50,000+)"
#39 on the list of "Top 101 cities with the smallest differences between daily high and daily low temperatures (population 50,000+)"
#47 on the list of "Top 101 cities with largest percentage of males in industries: real estate and rental and leasing (population 50,000+)"
#7 on the list of "Top 101 counties with the highest ground withdrawal of fresh water for public supply"
#15 on the list of "Top 101 counties with the most Evangelical Protestant congregations"
#18 on the list of "Top 101 counties with the most Evangelical Protestant adherents"
#20 on the list of "Top 101 counties with the lowest average weight of females"
#24 on the list of "Top 101 counties with the highest total withdrawal of fresh water for public supply (pop. 50,000+)"
Top Patent Applicants
Yadunandana N. Rao (31)
Samuel Arbefeuille (21)
Robert M. Dare (20)
Jacek Korec (17)
Shashidhar R. Gandham (16)
Humberto Berra (14)
Jeffrey A. Larose (11)
Sunny Rajpal (11)
Fletcher Christian (11)
John C. Canning (11)
Total of 403 patent applications in 2008-2024.
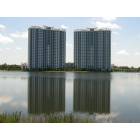
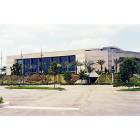
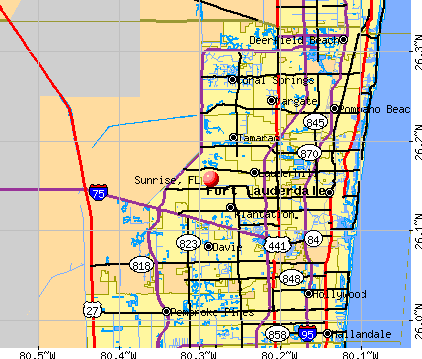


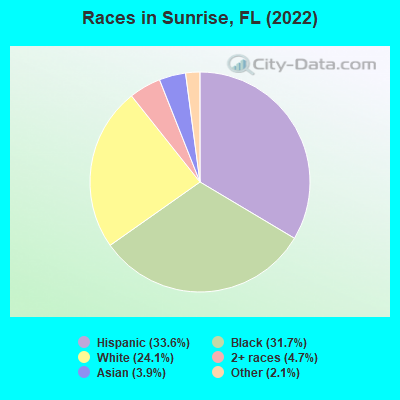
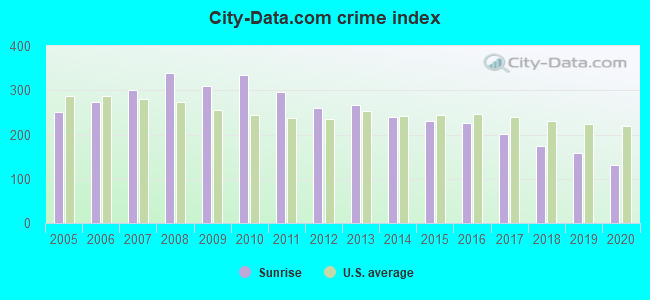
 Recent articles from our blog. Our writers, many of them Ph.D. graduates or candidates, create easy-to-read articles on a wide variety of topics.

 (20.5 miles
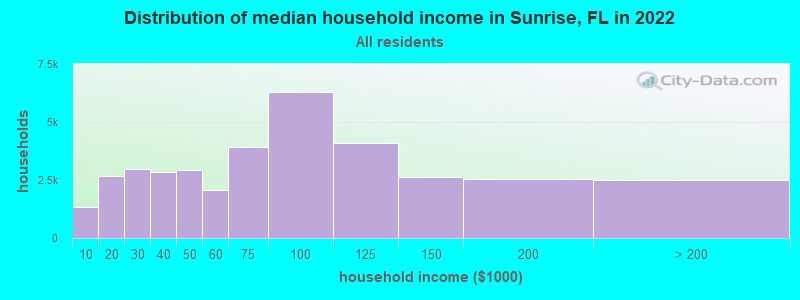
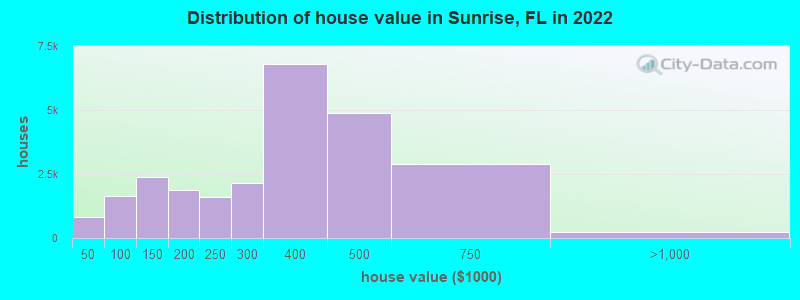

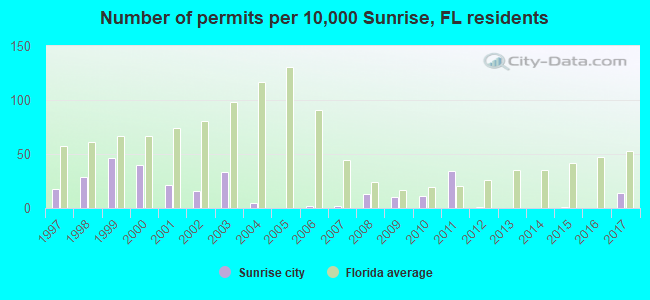
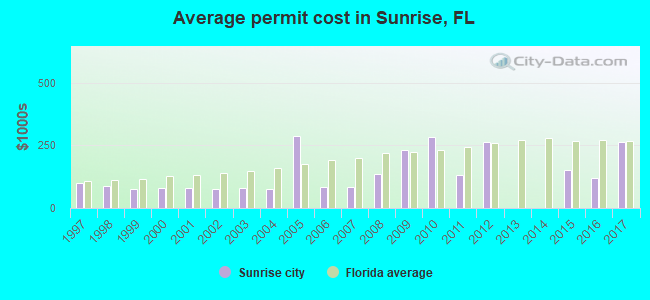
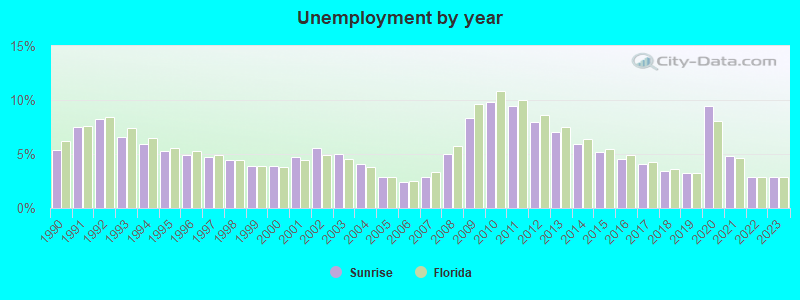
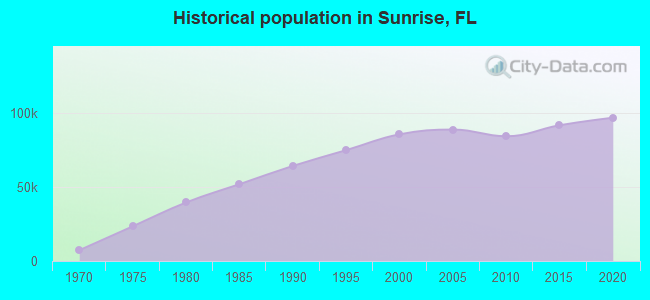
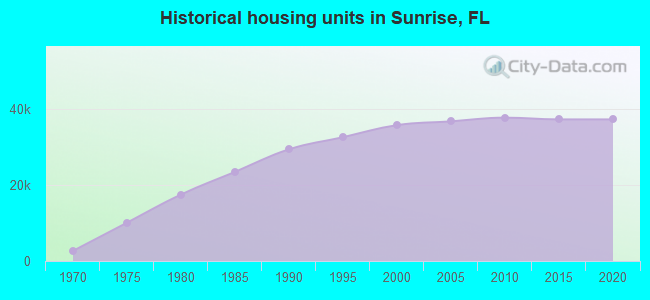
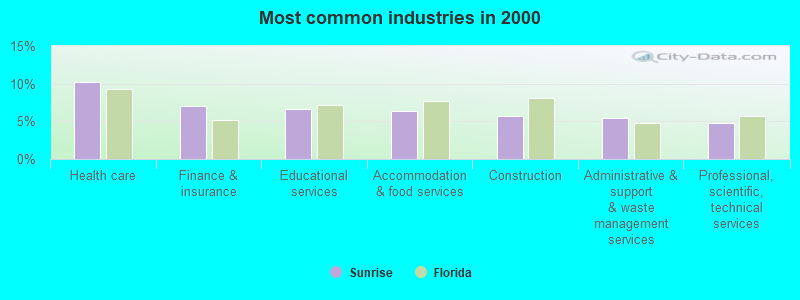
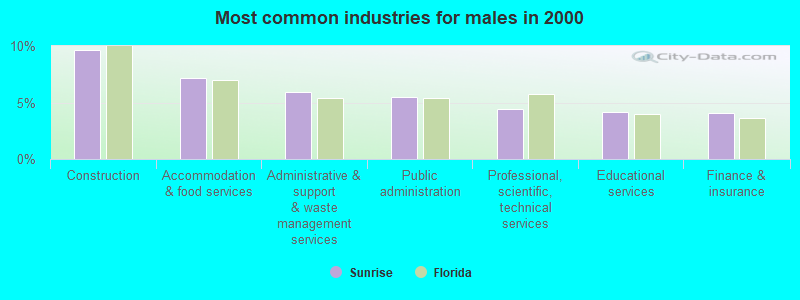
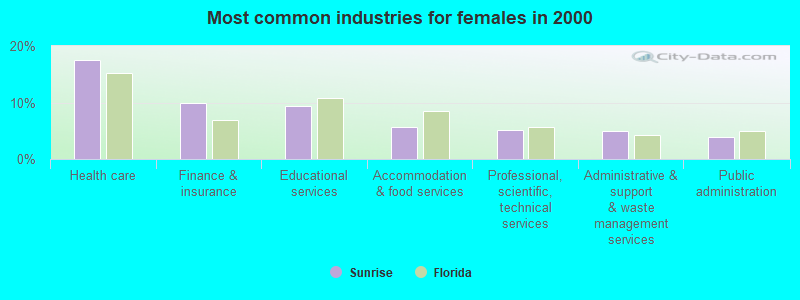
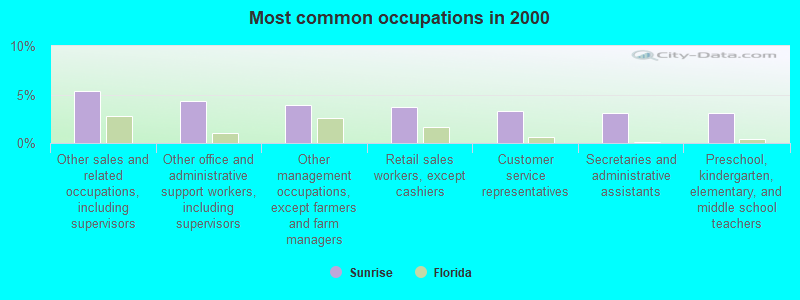
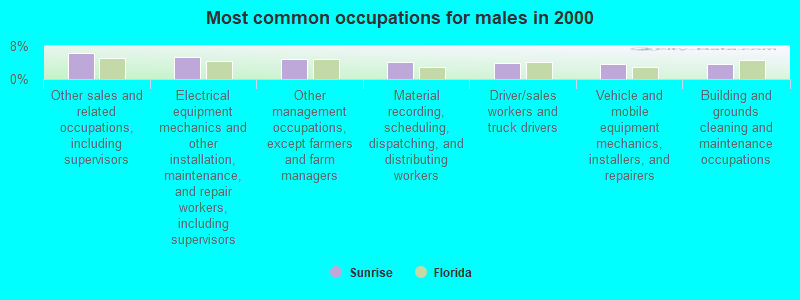
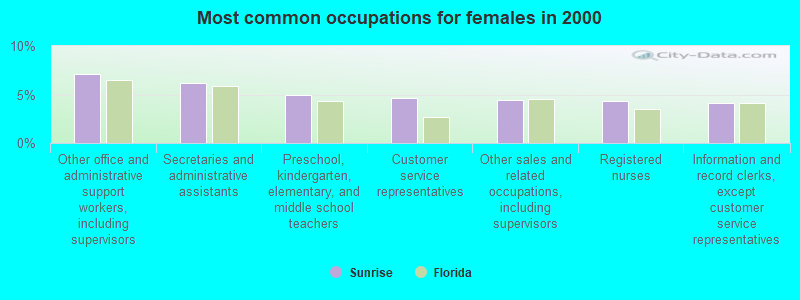


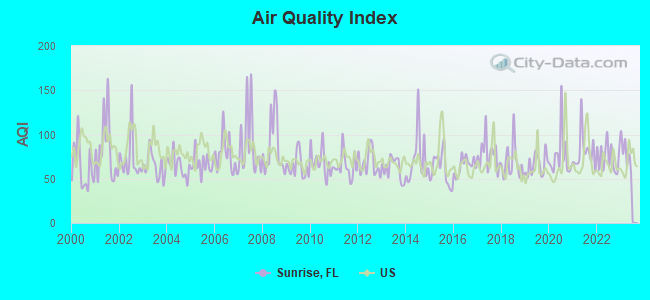
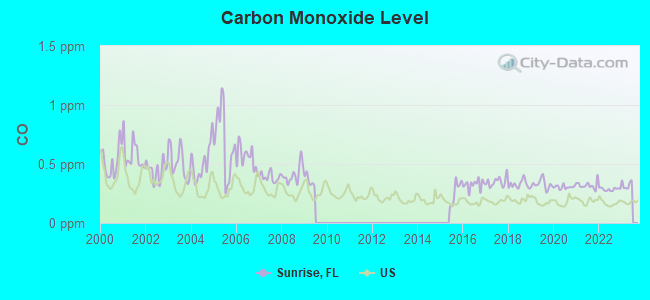
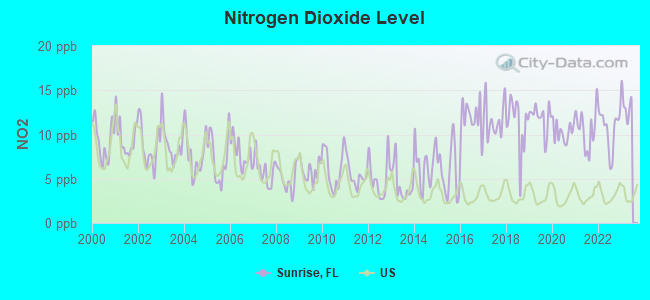
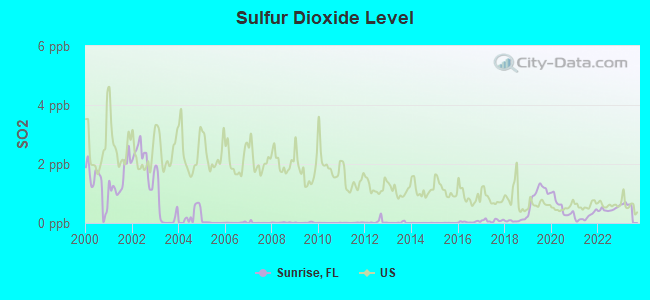
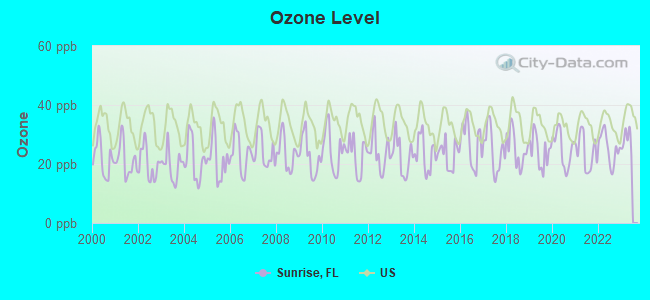
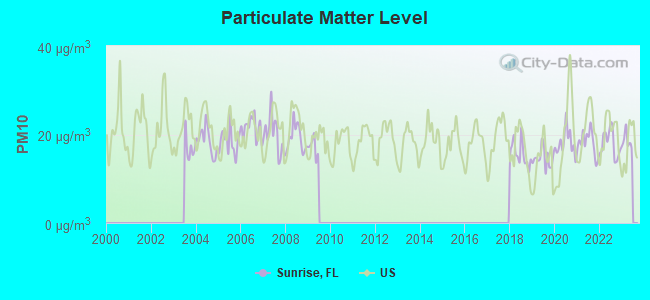
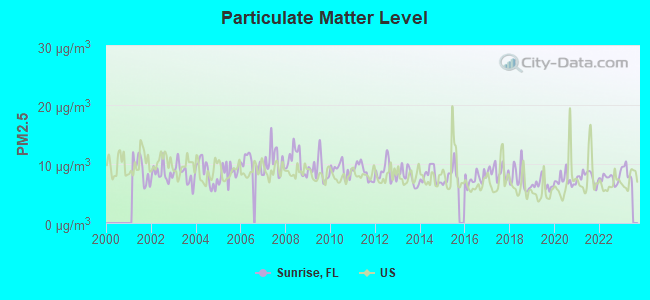
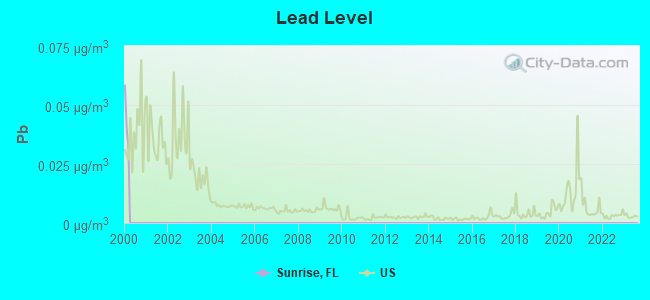

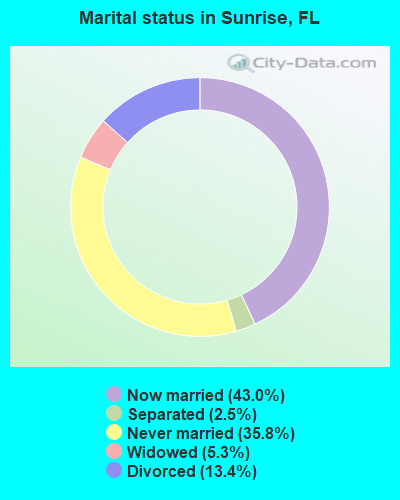
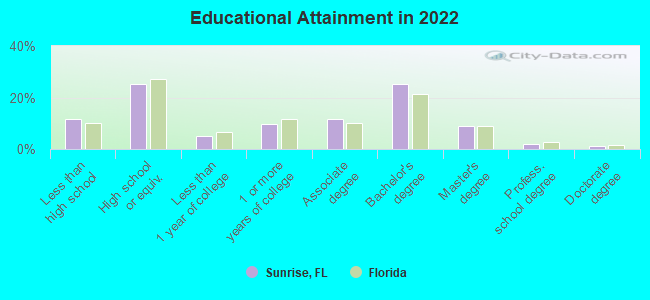
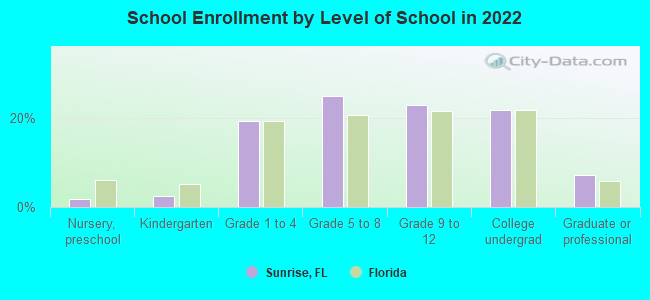
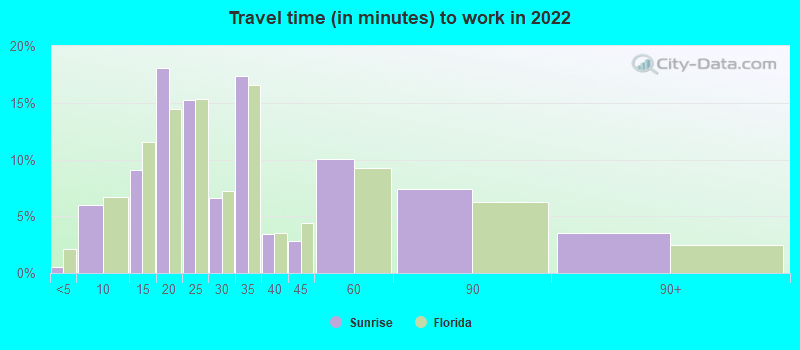
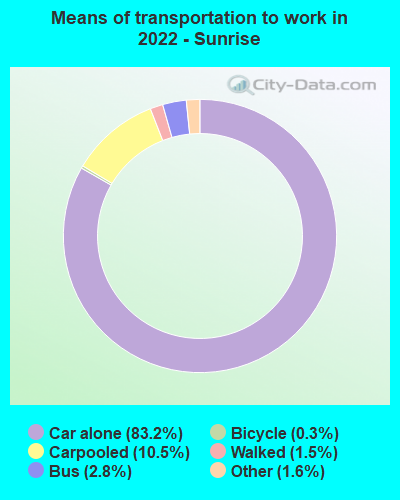
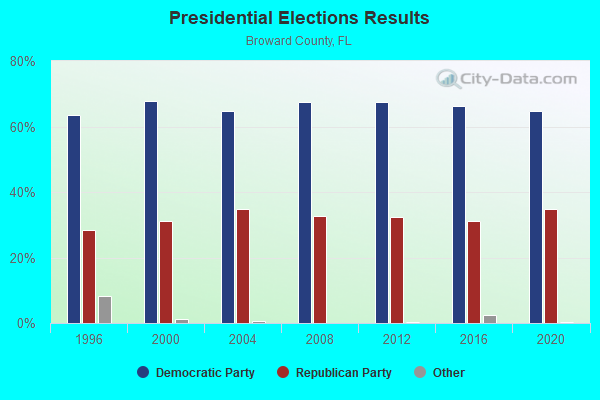
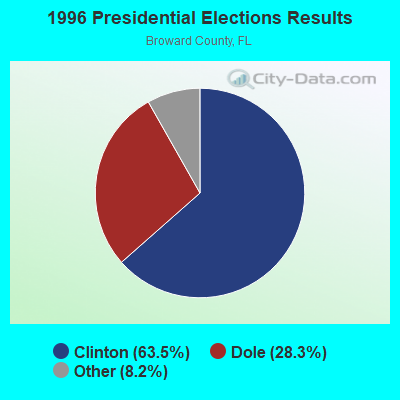
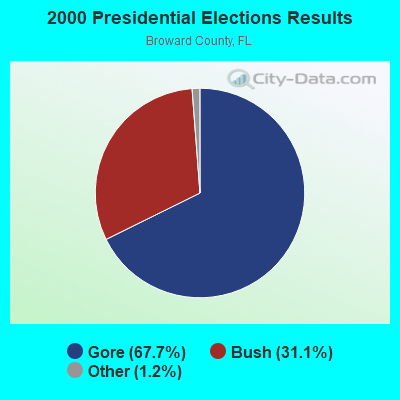
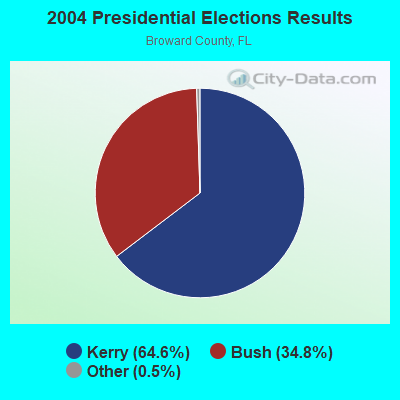
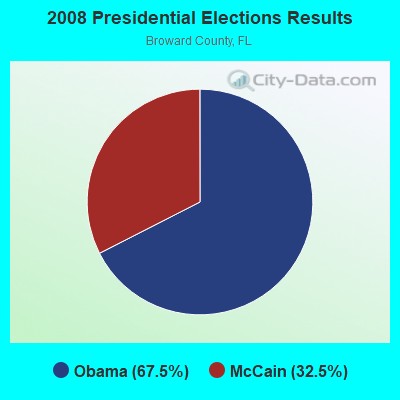
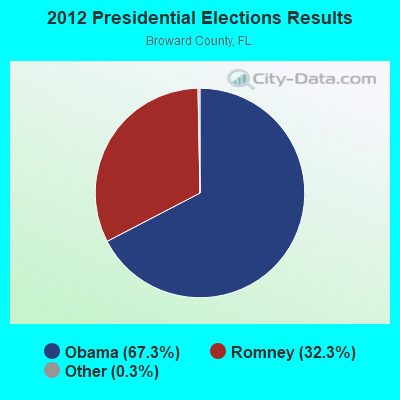
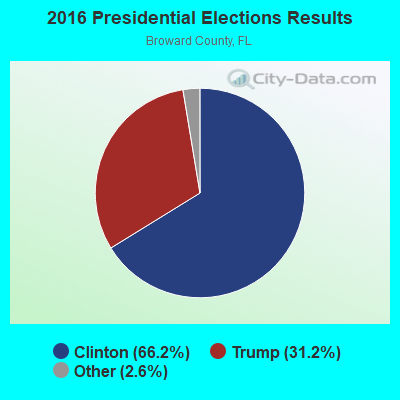
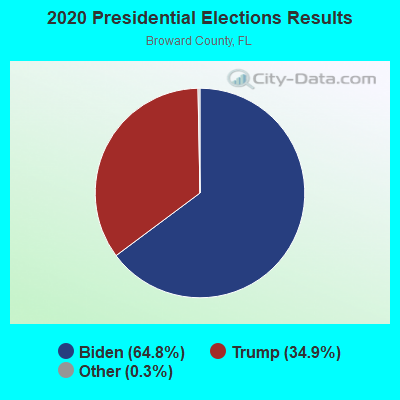
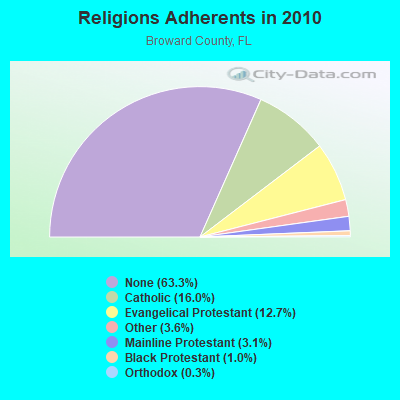
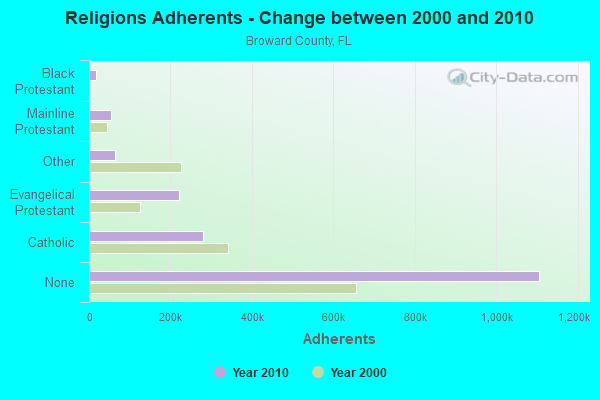
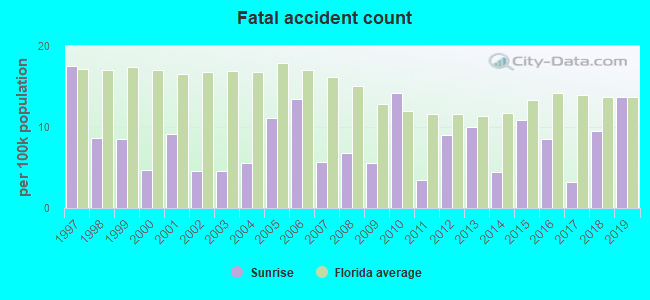
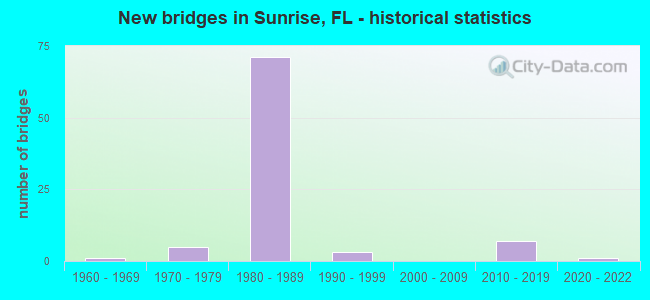
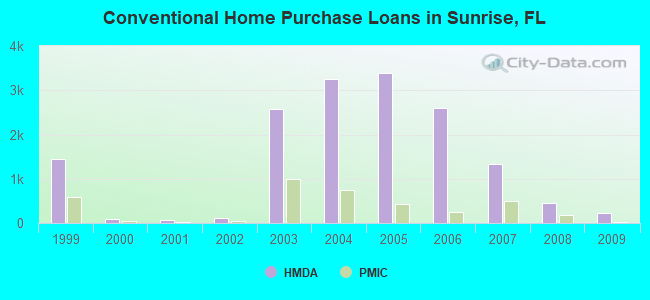
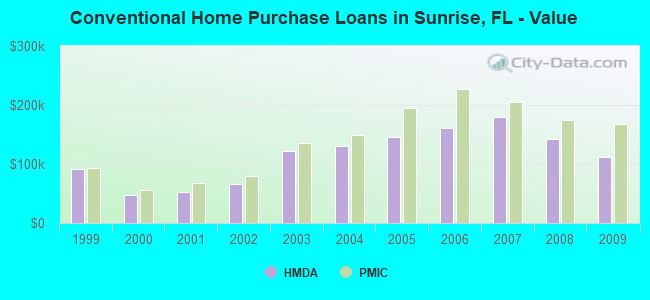
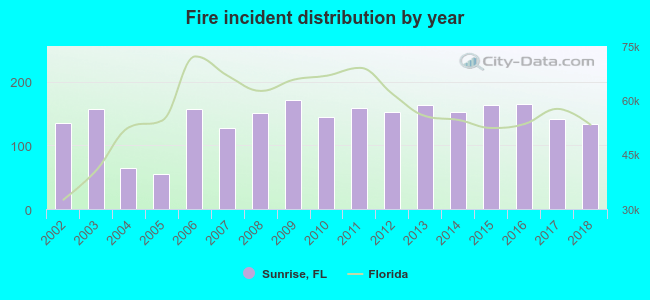 Based on the data from the years 2002 - 2018 the average number of fire incidents per year is 141. The highest number of fires - 171 took place in 2009, and the least - 55 in 2005. The data has a decreasing trend.
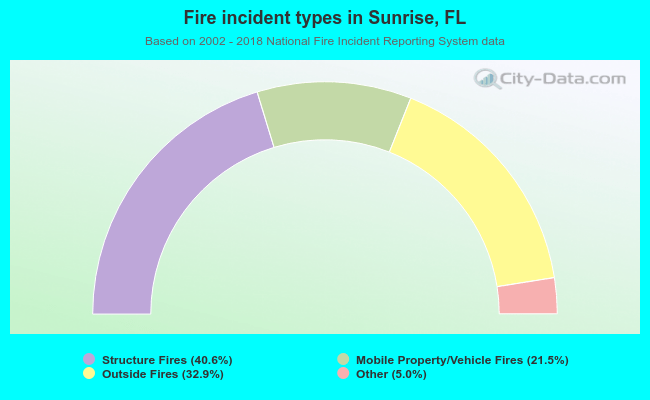 When looking into fire subcategories, the most incidents belonged to: Structure Fires (40.6%), and Outside Fires (32.9%).