Richland, WA (Washington) Houses and Residents
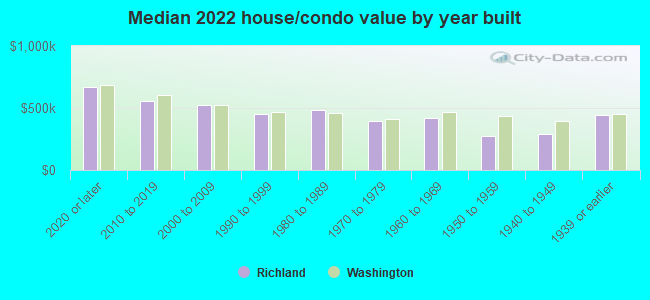
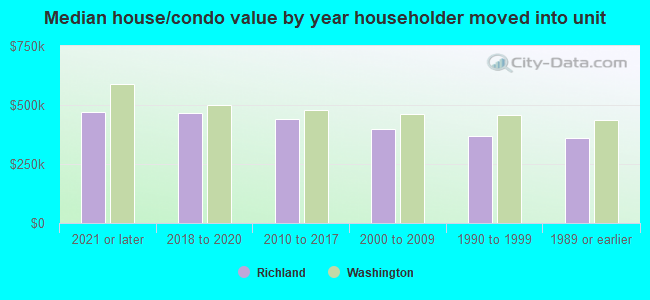
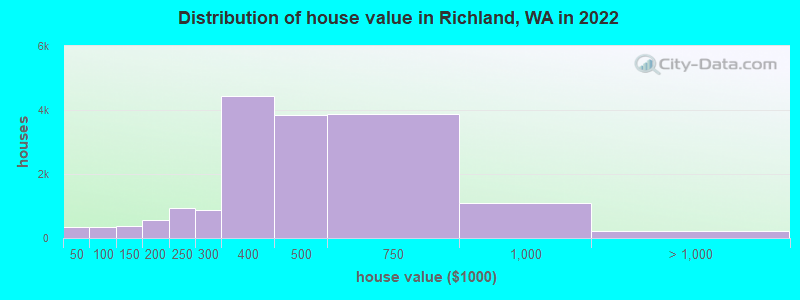
Estimated median house or condo value in 2022: $425,741 (it was $123,000 in 2000 )
Richland:
$425,741Washington:
$569,500
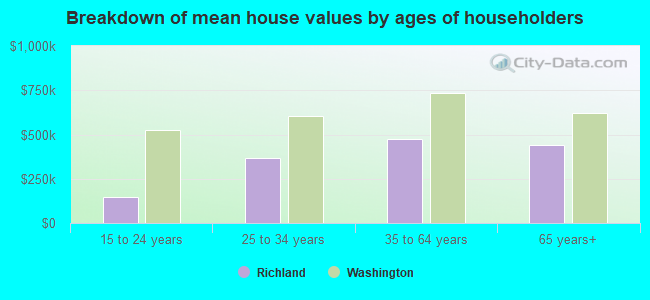
Lower value quartile - upper value quartile: $322,800 - $584,307Mean price in 2022: Detached houses: $479,077 Here:
$479,077State:
$734,307
Townhouses or other attached units: $503,186 Here:
$503,186State:
$657,697
In 2-unit structures: $269,958 Here:
$269,958State:
$534,634
In 3-to-4-unit structures: $1,568,328 Here:
$1,568,328State:
$510,239
In 5-or-more-unit structures: $359,687 Here:
$359,687State:
$503,183
Mobile homes: $95,975 Here:
$95,975State:
$218,362
Occupied boats, RVs, vans, etc.: $28,636 Here:
$28,636State:
$159,523
Total population: 53,019 (Urban population: 37,822, Rural population: 831 (all nonfarm) )
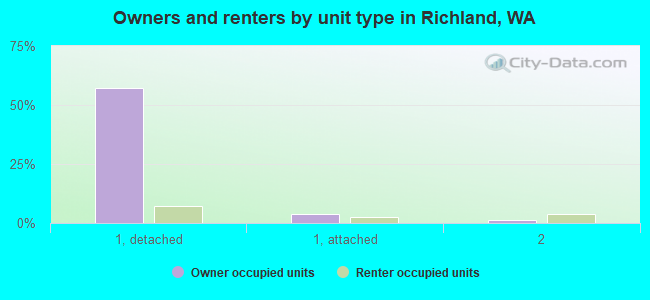
Houses: 26,452 (24,947 occupied: 16,112 owner occupied, 8,843 renter occupied )
% of renters here:
35%State:
36%
Housing density: 760 houses/condos per square mile
Median price asked for vacant for-sale houses and condos in 2022: $294,383.
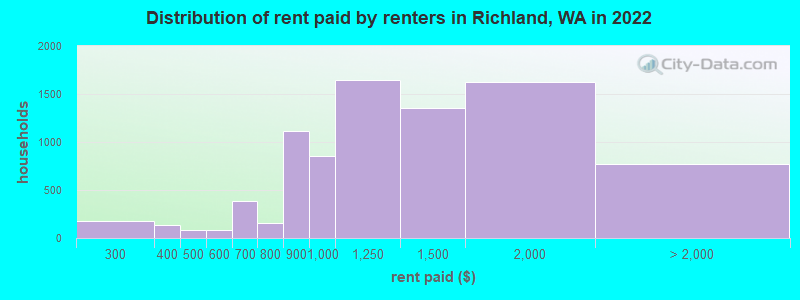
Median contract rent in 2022: $1,093 (lower quartile is $904, upper quartile is $1,491)
Median rent asked for vacant for-rent units in 2022: $1,261
Median gross rent in Richland, WA in 2022: $1,327
Housing units in Richland with a mortgage: 10,031 (678 second mortgage, 0 home equity loan, 645 both second mortgage and home equity loan )Houses without a mortgage: 164
Median household income for houses/condos with a mortgage: $120,766
Median household income for apartments without a mortgage: $110,700
Median monthly housing costs: $1,313
Data:
Median house or condo value ($)
Median house or condo value ($ change since 2000)
Median house or condo value ($) - White
Median house or condo value ($) - Black or African American
Median house or condo value ($) - Asian
Median house or condo value ($) - Hispanic or Latino
Median house or condo value ($) - American Indian and Alaska Native
Median house or condo value ($) - Multirace
Median house or condo value ($) - Other Race
Median price asked for mobile homes ($)
Household density (households per square mile)
Mean house or condo value by units in structure - 1, detached ($)
Mean house or condo value by units in structure - 1, attached ($)
Mean house or condo value by units in structure - 2 ($)
Mean house or condo value by units in structure by units in structure - 3 or 4 ($)
Mean house or condo value by units in structure - 5 or more ($)
Mean house or condo value by units in structure - Boat, RV, van, etc. ($)
Mean house or condo value by units in structure - Mobile home ($)
Median contract rent ($)
Median contract rent - Lower quartile ($)
Median contract rent - Upper quartile ($)
Median gross rent ($)
Urban houses (%)
Rural houses (%)
Houses occupied (%)
Houses occupied (% change since 2000)
Houses owner occupied (%)
Houses owner occupied (% change since 2000)
Houses renter occupied (%)
Houses renter occupied (% change since 2000)
Vacant housing units - For rent (%)
Vacant housing units - For rent (% change since 2000)
Vacant housing units - For sale only (%)
Vacant housing units - For sale only (% change since 2000)
Vacant housing units - Rented or sold, not occupied (%)
Vacant housing units - Rented or sold, not occupied (% change since 2000)
Vacant housing units - For seasonal, recreational, or occasional use (%)
Vacant housing units - For seasonal, recreational, or occasional use (% change since 2000)
Vacant housing units - For migrant workers (%)
Vacant housing units - For migrant workers (% change since 2000)
Vacant housing units - Other vacant (%)
Vacant housing units - Other vacant (% change since 2000)
Median monthly housing costs ($)
Median household income for houses/condos with a mortgage ($)
Median household income for houses/condos without a mortgage ($)
Median household income ($)
Median household income ($) - White
Median household income ($) - Black or African American
Median household income ($) - Asian
Median household income ($) - Hispanic or Latino
Median household income ($) - American Indian and Alaska Native
Median household income ($) - Multirace
Median household income ($) - Other Race
Mortgage status - with mortgage (%)
Mortgage status - with second mortgage (%)
Mortgage status - with home equity loan (%)
Mortgage status - with both second mortgage and home equity loan (%)
Mortgage status - without a mortgage (%)
Median year house/condo built
Median year apartment built
Household type by relationship - Male householder living alone (%)
Household type by relationship - Male householder not living alone (%)
Household type by relationship - Female householder living alone (%)
Household type by relationship - Female householder not living alone (%)
Household type by relationship - Opposite-Sex spouse (%)
Household type by relationship - Same-Sex spouse (%)
Household type by relationship - Opposite-Sex unmarried partner (%)
Household type by relationship - Same-Sex unmarried partner (%)
Household type by relationship - In group quarters (%)
Size of family households - 2-person household (%)
Size of family households - 3-person household (%)
Size of family households - 4-person household (%)
Size of family households - 5-person household (%)
Size of family households - 6-person household (%)
Size of family households - 7-or-more-person household (%)
Size of nonfamily households - 1-person household (%)
Size of nonfamily households - 2-person household (%)
Size of nonfamily households - 3-person household (%)
Size of nonfamily households - 4-person household (%)
Size of nonfamily households - 5-person household (%)
Size of nonfamily households - 6-person household (%)
Size of nonfamily households - 7-or-moreperson household (%)
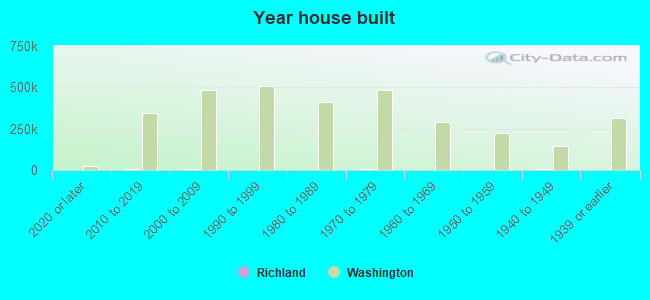
Year house built - Built 2010 or later (%)
Year house built - Built 2000 to 2009 (%)
Year house built - Built 1990 to 1999 (%)
Year house built - Built 1980 to 1989 (%)
Year house built - Built 1970 to 1979 (%)
Year house built - Built 1960 to 1969 (%)
Year house built - Built 1950 to 1959 (%)
Year house built - Built 1940 to 1949 (%)
Year house built - Built 1939 or earlier (%)
Median number of rooms in houses and condos
Median number of rooms in apartments
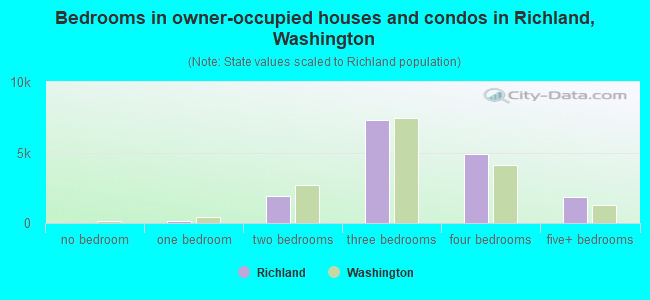
Median number of bedrooms in owner occupied houses
Mean number of bedrooms in owner occupied houses
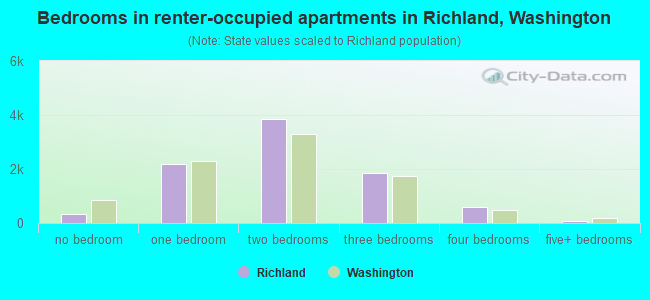
Median number of bedrooms in renter occupied houses
Mean number of bedrooms in renter occupied houses
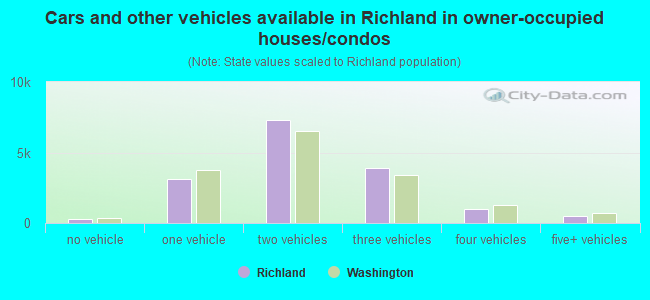
Median number of vehichles in owner occupied houses
Mean number of vehichles in owner occupied houses
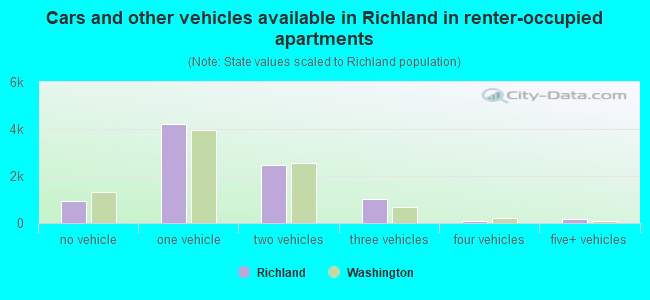
Median number of vehichles in renter occupied houses
Mean number of vehichles in renter occupied houses
Rooms in owner-occupied houses - 1 room (%)
Rooms in owner-occupied houses - 2 rooms (%)
Rooms in owner-occupied houses - 3 rooms (%)
Rooms in owner-occupied houses - 4 rooms (%)
Rooms in owner-occupied houses - 5 rooms (%)
Rooms in owner-occupied houses - 6 rooms (%)
Rooms in owner-occupied houses - 7 rooms (%)
Rooms in owner-occupied houses - 8 rooms (%)
Rooms in owner-occupied houses - 9+ rooms (%)
Rooms in renter-occupied houses - 1 room (%)
Rooms in renter-occupied houses - 2 rooms (%)
Rooms in renter-occupied houses - 3 rooms (%)
Rooms in renter-occupied houses - 4 rooms (%)
Rooms in renter-occupied houses - 5 rooms (%)
Rooms in renter-occupied houses - 6 rooms (%)
Rooms in renter-occupied houses - 7 rooms (%)
Rooms in renter-occupied houses - 8 rooms (%)
Rooms in renter-occupied houses - 9+ rooms (%)
Bedrooms in owner-occupied houses - no bedrooms (%)
Bedrooms in owner-occupied houses - 1 bedroom (%)
Bedrooms in owner-occupied houses - 2 bedrooms (%)
Bedrooms in owner-occupied houses - 3 bedrooms (%)
Bedrooms in owner-occupied houses - 4 bedrooms (%)
Bedrooms in owner-occupied houses - 5+ bedrooms (%)
Bedrooms in renter-occupied houses - no bedrooms (%)
Bedrooms in renter-occupied houses - 1 bedroom (%)
Bedrooms in renter-occupied houses - 2 bedrooms (%)
Bedrooms in renter-occupied houses - 3 bedrooms (%)
Bedrooms in renter-occupied houses - 4 bedrooms (%)
Bedrooms in renter-occupied houses - 5+ bedrooms (%)
Vehicles available in owner-occupied houses - no vehicle available (%)
Vehicles available in owner-occupied houses - 1 vehicle available(%)
Vehicles available in owner-occupied houses - 2 Vehicles available (%)
Vehicles available in owner-occupied houses - 3 Vehicles available (%)
Vehicles available in owner-occupied houses - 4 Vehicles available (%)
Vehicles available in owner-occupied houses - 5+ Vehicles available (%)
Vehicles available in renter-occupied houses - no vehicle available (%)
Vehicles available in renter-occupied houses - 1 vehicle available (%)
Vehicles available in renter-occupied houses - 2 Vehicles available (%)
Vehicles available in renter-occupied houses - 3 Vehicles available (%)
Vehicles available in renter-occupied houses - 4 Vehicles available (%)
Vehicles available in renter-occupied houses - 5+ Vehicles available (%)
Housing units in structures - 1, detached (%)
Housing units in structures - 1, attached (%)
Housing units in structures - 2 (%)
Housing units in structures - 3 or 4 (%)
Housing units in structures - 5 to 9 (%)
Housing units in structures - 10 to 19 (%)
Housing units in structures - 20 to 49 (%)
Housing units in structures - 50 or more (%)
Housing units in structures - Mobile home (%)
Housing units in structures - Boat, RV, van, etc. (%)
Housing units in structures - Owners - 1, detached (%)
Housing units in structures - Owners - 1, attached (%)
Housing units in structures - Owners - 2 (%)
Housing units in structures - Owners - 3 or 4 (%)
Housing units in structures - Owners - 5 to 9 (%)
Housing units in structures - Owners - 10 to 19 (%)
Housing units in structures - Owners - 20 to 49 (%)
Housing units in structures - Owners - 50 or more (%)
Housing units in structures - Owners - Mobile home (%)
Housing units in structures - Owners - Boat, RV, van, etc. (%)
Housing units in structures - Renters - 1, detached (%)
Housing units in structures - Renters - 1, attached (%)
Housing units in structures - Renters - 2 (%)
Housing units in structures - Renters - 3 or 4 (%)
Housing units in structures - Renters - 5 to 9 (%)
Housing units in structures - Renters - 10 to 19 (%)
Housing units in structures - Renters - 20 to 49 (%)
Housing units in structures - Renters - 50 or more (%)
Housing units in structures - Renters - Mobile home (%)
Housing units in structures - Renters - Boat, RV, van, etc. (%)
House/condo owner moved in on average (years ago)
Renter moved in on average (years ago)
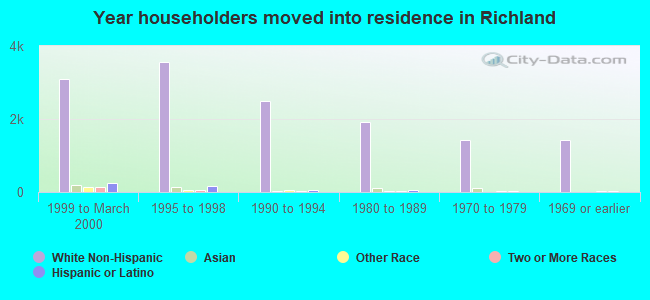
Year householder moved into unit - Moved in 1999 to March 2000 (%)
Year householder moved into unit - Moved in 1999 to March 2000 (%) - White
Year householder moved into unit - Moved in 1999 to March 2000 (%) - Black or African American
Year householder moved into unit - Moved in 1999 to March 2000 (%) - Asian
Year householder moved into unit - Moved in 1999 to March 2000 (%) - Hispanic or Latino
Year householder moved into unit - Moved in 1999 to March 2000 (%) - American Indian and Alaska Native
Year householder moved into unit - Moved in 1999 to March 2000 (%) - Multirace
Year householder moved into unit - Moved in 1999 to March 2000 (%) - Other Race
Year householder moved into unit - Moved in 1995 to 1998 (%)
Year householder moved into unit - Moved in 1995 to 1998 (%) - White
Year householder moved into unit - Moved in 1995 to 1998 (%) - Black or African American
Year householder moved into unit - Moved in 1995 to 1998 (%) - Asian
Year householder moved into unit - Moved in 1995 to 1998 (%) - Hispanic or Latino
Year householder moved into unit - Moved in 1995 to 1998 (%) - American Indian and Alaska Native
Year householder moved into unit - Moved in 1995 to 1998 (%) - Multirace
Year householder moved into unit - Moved in 1995 to 1998 (%) - Other Race
Year householder moved into unit - Moved in 1990 to 1994 (%)
Year householder moved into unit - Moved in 1990 to 1994 (%) - White
Year householder moved into unit - Moved in 1990 to 1994 (%) - Black or African American
Year householder moved into unit - Moved in 1990 to 1994 (%) - Asian
Year householder moved into unit - Moved in 1990 to 1994 (%) - Hispanic or Latino
Year householder moved into unit - Moved in 1990 to 1994 (%) - American Indian and Alaska Native
Year householder moved into unit - Moved in 1990 to 1994 (%) - Multirace
Year householder moved into unit - Moved in 1990 to 1994 (%) - Other Race
Year householder moved into unit - Moved in 1980 to 1989 (%)
Year householder moved into unit - Moved in 1980 to 1989 (%) - White
Year householder moved into unit - Moved in 1980 to 1989 (%) - Black or African American
Year householder moved into unit - Moved in 1980 to 1989 (%) - Asian
Year householder moved into unit - Moved in 1980 to 1989 (%) - Hispanic or Latino
Year householder moved into unit - Moved in 1980 to 1989 (%) - American Indian and Alaska Native
Year householder moved into unit - Moved in 1980 to 1989 (%) - Multirace
Year householder moved into unit - Moved in 1980 to 1989 (%) - Other Race
Year householder moved into unit - Moved in 1970 to 1979 (%)
Year householder moved into unit - Moved in 1970 to 1979 (%) - White
Year householder moved into unit - Moved in 1970 to 1979 (%) - Black or African American
Year householder moved into unit - Moved in 1970 to 1979 (%) - Asian
Year householder moved into unit - Moved in 1970 to 1979 (%) - Hispanic or Latino
Year householder moved into unit - Moved in 1970 to 1979 (%) - American Indian and Alaska Native
Year householder moved into unit - Moved in 1970 to 1979 (%) - Multirace
Year householder moved into unit - Moved in 1970 to 1979 (%) - Other Race
Year householder moved into unit - Moved in 1969 or earlier (%)
Year householder moved into unit - Moved in 1969 or earlier (%) - White
Year householder moved into unit - Moved in 1969 or earlier (%) - Black or African American
Year householder moved into unit - Moved in 1969 or earlier (%) - Asian
Year householder moved into unit - Moved in 1969 or earlier (%) - Hispanic or Latino
Year householder moved into unit - Moved in 1969 or earlier (%) - American Indian and Alaska Native
Year householder moved into unit - Moved in 1969 or earlier (%) - Multirace
Year householder moved into unit - Moved in 1969 or earlier (%) - Other Race
Housing units lacking complete plumbing facilities (%)
Housing units lacking complete kitchen facilities (%)
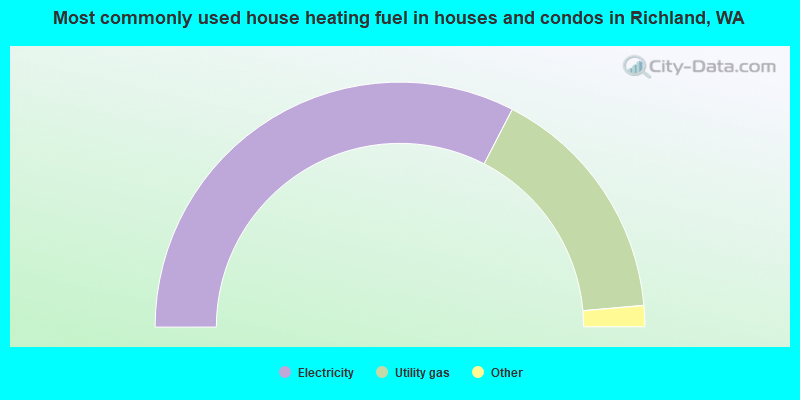
House heating fuel used in houses and condos - Utility gas (%)
House heating fuel used in houses and condos - Bottled, tank, or LP gas (%)
House heating fuel used in houses and condos - Electricity (%)
House heating fuel used in houses and condos - Fuel oil, kerosene, etc. (%)
House heating fuel used in houses and condos - Coal or coke (%)
House heating fuel used in houses and condos - Wood (%)
House heating fuel used in houses and condos - Solar energy (%)
House heating fuel used in houses and condos - Other fuel (%)
House heating fuel used in houses and condos - No fuel used (%)
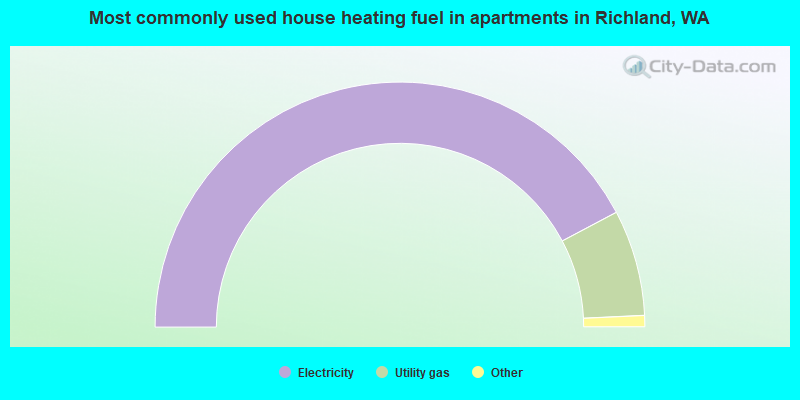
House heating fuel used in apartments - Utility gas (%)
House heating fuel used in apartments - Bottled, tank, or LP gas (%)
House heating fuel used in apartments - Electricity (%)
House heating fuel used in apartments - Fuel oil, kerosene, etc. (%)
House heating fuel used in apartments - Coal or coke (%)
House heating fuel used in apartments - Wood (%)
House heating fuel used in apartments - Solar energy (%)
House heating fuel used in apartments - Other fuel (%)
House heating fuel used in apartments - No fuel used (%)
Latest news about housing in Richland, WA collected exclusively by city-data.com from local newspapers, TV, and radio stations
Median year house/condo built: 1985Median year apartment built: 1982Household type by relationship:
Households: 62,400
Male householders: 13,191 (3,547 living alone ), Female householders: 11,503 (3,935 living alone )11,519 spouses (11,410 opposite-sex spouses ), 2,321 unmarried partners , (2,272 opposite-sex unmarried partners ), 18,564 children (16,888 natural , 711 adopted , 964 stepchildren ), 655 grandchildren , 533 brothers or sisters , 659 parents , 49 foster children , 798 other relatives , 2,298 non-relatives In group quarters: 307
Size of family households: 6,613 2-persons , 3,320 3-persons , 2,519 4-persons , 1,457 5-persons , 476 6-persons , 412 7-or-more-persons .
Size of nonfamily households: 7,869 1-person , 1,878 2-persons , 201 3-persons , 53 4-persons , 12 6-persons .
9,625 married couples with children. single-parent households (1,461 men , 2,906 women ).
86.0% of residents of Richland speak English at home. of residents speak Spanish at home (75% speak English very well , 16% speak English well , 9% speak English not well ).of residents speak other Indo-European language at home (73% speak English very well , 19% speak English well , 7% speak English not well , 1% don't speak English at all ).of residents speak Asian or Pacific Island language at home (65% speak English very well , 21% speak English well , 14% speak English not well ).of residents speak other language at home (82% speak English very well , 5% speak English well , 13% speak English not well ).
Foreign born population: 5,590 (9.0%)of them are naturalized citizens )
Median number of rooms in houses and condos:
Median number of rooms in apartments
Owner-occupied Renter-occupied
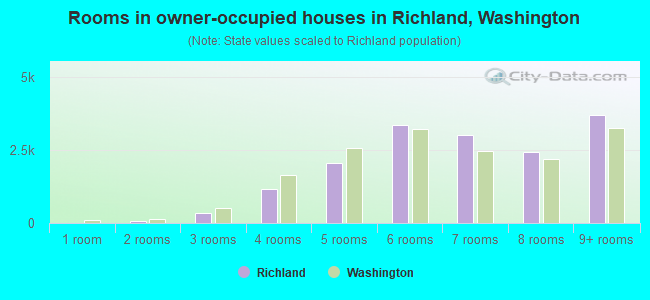
Rooms in owner-occupied houses in Richland, Washington
0 1 room 64 2 rooms 349 3 rooms 1,157 4 rooms 2,056 5 rooms 3,346 6 rooms 3,007 7 rooms 2,428 8 rooms 3,705 9+ rooms
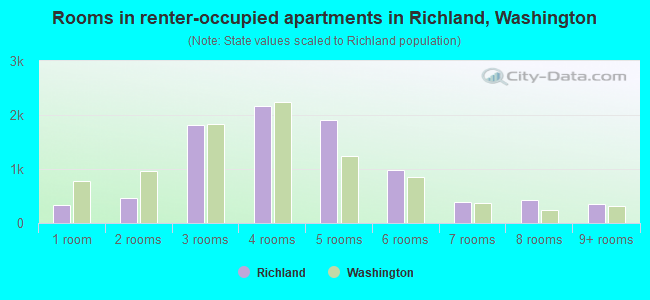
Rooms in renter-occupied apartments in Richland, Washington
327 1 room 469 2 rooms 1,817 3 rooms 2,174 4 rooms 1,903 5 rooms 977 6 rooms 398 7 rooms 424 8 rooms 354 9+ rooms
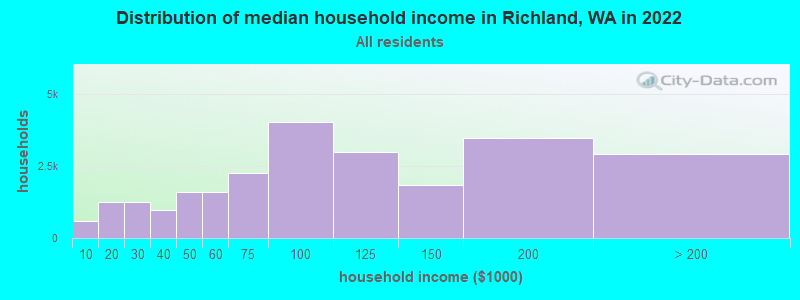
Richland, WA household income distribution 585 Less than $10,0001,251 $10,000 to $19,9991,258 $20,000 to $29,999986 $30,000 to $39,9991,590 $40,000 to $49,9991,598 $50,000 to $59,9992,241 $60,000 to $74,9994,023 $75,000 to $99,9992,990 $100,000 to $124,9991,842 $125,000 to $149,9993,461 $150,000 to $199,9992,920 $200,000 or more
Home value of owner - occupied houses in 2022 in Richland, WA 53 Less than $10,00060 $10,000 to $14,99915 $15,000 to $19,99933 $20,000 to $24,99944 $25,000 to $29,99948 $30,000 to $34,99920 $35,000 to $39,99966 $40,000 to $49,99947 $50,000 to $59,999119 $60,000 to $69,99953 $70,000 to $79,99936 $80,000 to $89,99933 $90,000 to $99,999155 $100,000 to $124,999226 $125,000 to $149,999269 $150,000 to $174,999296 $175,000 to $199,999935 $200,000 to $249,999883 $250,000 to $299,9994,433 $300,000 to $399,9993,846 $400,000 to $499,9993,874 $500,000 to $749,9991,079 $750,000 to $999,999125 $1,000,000 to $1,499,99952 $1,500,000 to $1,999,99940 $2,000,000 or moreRent paid by renters in 2022 in Richland, WA 11 $150 to $19999 $200 to $24977 $250 to $29962 $300 to $34972 $350 to $39915 $400 to $44970 $450 to $49925 $500 to $54958 $550 to $599328 $600 to $64960 $650 to $69959 $700 to $74992 $750 to $7991,117 $800 to $899852 $900 to $9991,650 $1,000 to $1,2491,354 $1,250 to $1,4991,622 $1,500 to $1,999403 $2,000 to $2,49911 $2,500 to $2,99960 $3,000 to $3,49986 $3,500 or more205 No cash rent
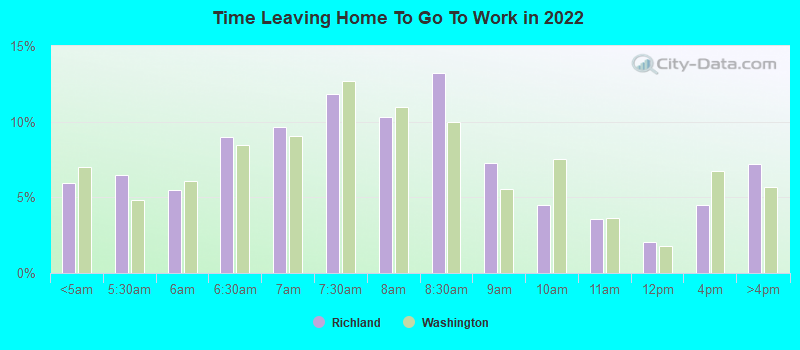
Percentage of workers working in this county: 83.4%Number of people working at home: 5,531 (18.2% of all workers )
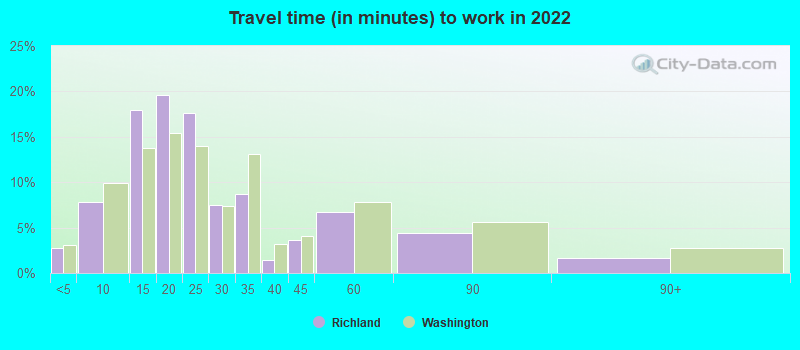
Travel time to work (commute)
Less than 5 minutes: 9515 to 9 minutes: 2,83910 to 14 minutes: 4,85415 to 19 minutes: 6,05220 to 24 minutes: 3,85225 to 29 minutes: 1,70230 to 34 minutes: 1,36935 to 39 minutes: 45440 to 44 minutes: 89245 to 59 minutes: 1,28660 to 89 minutes: 55890 or more minutes: 494
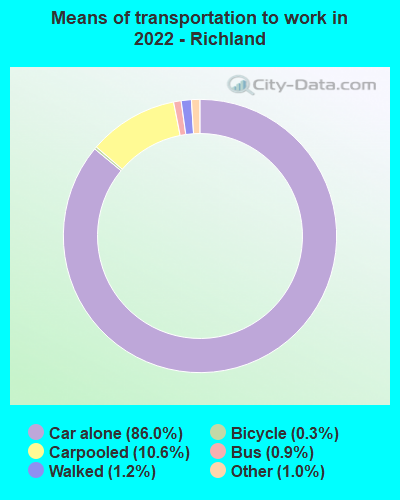
Means of transportation to work:
Drove a car alone: 30,267 (72.5%)Carpooled: 4,321 (10.4%)Bus : 588 (1.4%)Taxi: 359 (0.9%)Bicycle: 90 (0.2%)Walked: 472 (1.1%)Worked at home: 5,531 (13.2%)
Unemployment by race in 2022
Unemployment rate for White non-Hispanic residents 3.3% Males3.5% FemalesUnemployment rate for Black residents 28.9% Males17.0% FemalesUnemployment rate for Asian residents 4.4% Males3.5% FemalesUnemployment rate for other race residents 6.0% Males2.9% FemalesUnemployment rate for two or more race residents 11.2% Males4.4% FemalesUnemployment rate for Hispanic or Latino residents 5.3% Males2.7% Females
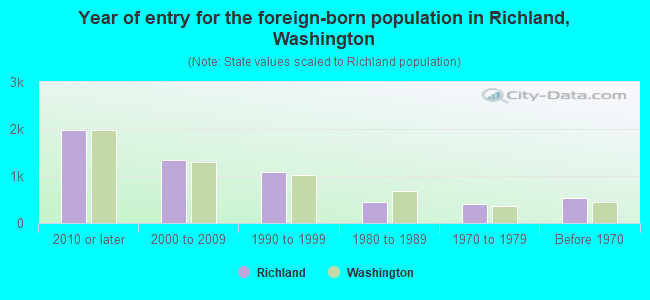
Year of entry for the foreign-born population in Richland, Washington
1,989 2010 or later 1,340 2000 to 2009 1,081 1990 to 1999 449 1980 to 1989 413 1970 to 1979 530 Before 1970
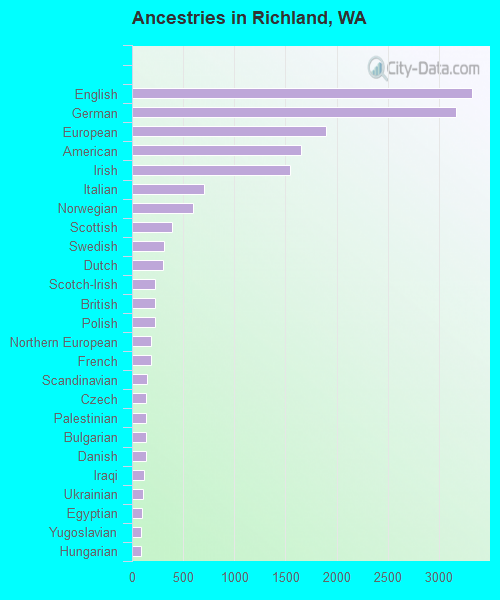
First ancestries reported:
English: 3,324 (12.2%)
German: 3,167 (11.6%)
European: 1,896 (7.0%)
American: 1,651 (6.1%)
Irish: 1,544 (5.7%)
Italian: 702 (2.6%)
Norwegian: 594 (2.2%)
Scottish: 388 (1.4%)
Swedish: 311 (1.1%)
Dutch: 300 (1.1%)
Scotch-Irish: 224 (0.8%)
British: 223 (0.8%)
Polish: 220 (0.8%)
Northern European: 190 (0.7%)
French: 186 (0.7%)
Scandinavian: 150 (0.6%)
Czech: 136 (0.5%)
Palestinian: 132 (0.5%)
Bulgarian: 132 (0.5%)
Danish: 132 (0.5%)
Iraqi: 116 (0.4%)
Ukrainian: 109 (0.4%)
Egyptian: 99 (0.4%)
Yugoslavian: 88 (0.3%)
Hungarian: 87 (0.3%)
French Canadian: 82 (0.3%)
Russian: 78 (0.3%)
Ugandan: 73 (0.3%)
Croatian: 72 (0.3%)
Slovak: 72 (0.3%)
Albanian: 70 (0.3%)
Moroccan: 69 (0.3%)
Finnish: 66 (0.2%)
Nigerian: 62 (0.2%)
Austrian: 60 (0.2%)
Afghan: 56 (0.2%)
Welsh: 50 (0.2%)
Serbian: 29 (0.1%)
Canadian: 21 (0.08%)
Eastern European: 20 (0.07%)
Romanian: 19 (0.07%)
Lebanese: 18 (0.07%)
Syrian: 16 (0.06%)
Latvian: 15 (0.06%)
Swiss: 15 (0.06%)
Portuguese: 14 (0.05%)
Trinidadian and Tobagonian: 13 (0.05%)
Turkish: 11 (0.04%)
Barbadian: 9 (0.03%)
Ghanaian: 6 (0.02%)
Most common places of birth for foreign-born residents (%): India Richland:
16.0% (898)Washington:
8.9% (101,353)
Mexico Richland:
12.0% (674)Washington:
21.1% (241,655)
China, excluding Hong Kong and Taiwan Richland:
6.8% (381)Washington:
7.4% (84,470)
Korea Richland:
6.7% (375)Washington:
4.3% (48,886)
Canada Richland:
4.8% (267)Washington:
4.1% (47,238)
Vietnam Richland:
4.2% (235)Washington:
5.4% (62,003)
Philippines Richland:
3.4% (190)Washington:
6.3% (71,661)
Bangladesh Richland:
3.0% (170)Washington:
0.1% (1,536)
Iraq Richland:
2.6% (144)Washington:
0.5% (6,259)
Bulgaria Richland:
2.4% (136)Washington:
0.2% (2,858)
Ghana Richland:
2.2% (126)Washington:
0.1% (1,702)
Poland Richland:
1.9% (105)Washington:
0.4% (4,963)
Bosnia and Herzegovina Richland:
1.7% (95)Washington:
0.3% (3,825)
Russia Richland:
1.6% (92)Washington:
1.9% (21,540)
Germany Richland:
1.6% (92)Washington:
1.6% (17,761)
England Richland:
1.6% (91)Washington:
0.8% (9,457)
Place of birth for U.S.-born residents:
This state: 32,260Other state: 23,698Northeast: 2,038Midwest: 4,770South: 4,031West: 12,844 84.4% of Richland residents lived in the same house 1 years ago.
Out of people who lived in different houses, 34.0% lived in this county.
Out of people who lived in different counties, 47.4% lived in Washington.
Richland:
84.4%State average:
85.2%
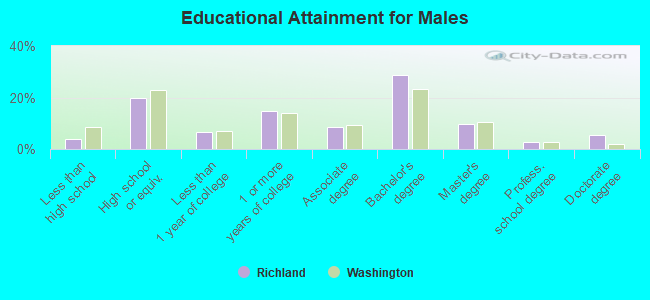
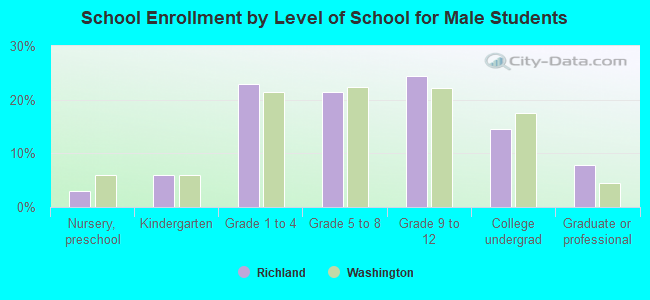
Education attainment for males 25 years and older:
No schooling: 118Nursery to 4th grade: 115th and 6th grade: 457th and 8th grade: 809th grade: 2410th grade: 29811th grade: 12412th grade, no diploma: 105High school graduate (or equivalency): 3,992Less than 1 year of college: 1,308Some college more than 1 year, no degree: 2,958Associate degree: 1,754Bachelor's degree: 5,856Master's degree: 1,948Professional school degree: 525Doctorate degree: 1,134
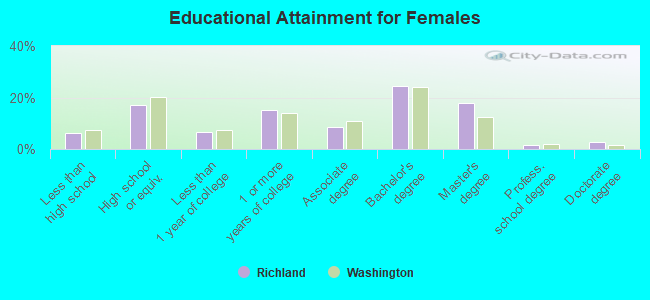
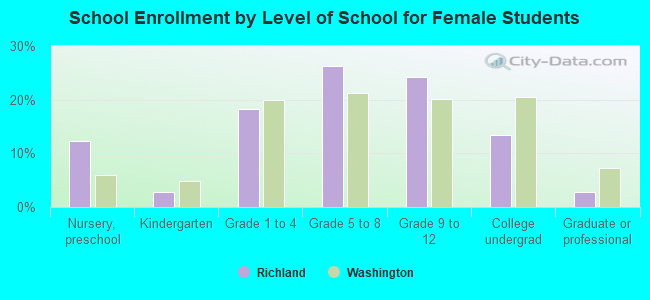
Education attainment for females 25 years and older:
No schooling: 351Nursery to 4th grade: 255th and 6th grade: 757th and 8th grade: 1579th grade: 4910th grade: 4311th grade: 15612th grade, no diploma: 466High school graduate (or equivalency): 3,584Less than 1 year of college: 1,389Some college more than 1 year, no degree: 3,175Associate degree: 1,818Bachelor's degree: 5,155Master's degree: 3,756Professional school degree: 291Doctorate degree: 542
Housing units in structures:
One, detached: 16,540One, attached: 1,427Two: 1,2433 or 4: 7345 to 9: 1,63410 to 19: 95020 to 49: 1,03250 or more: 2,172Mobile homes: 665Boats, RVs, vans, etc.: 50Median worth of mobile homes: $45,836
Housing units lacking complete plumbing facilities in 2022: 0.1%Housing units lacking complete kitchen facilities in 2022: 1.3%House/condo owner moved in on average 11 years ago
Renter moved in on average 3 years ago
Private vs. public school enrollment:
Students in private schools in grades 1 to 8 (elementary and middle school): 975 Here:
13.8%Washington:
12.4%
Students in private schools in grades 9 to 12 (high school): 140 Students in private undergraduate colleges: 327 Here:
14.8%Washington:
16.5%