Salem, IL (Illinois) Houses and Residents
| Salem: | $100,282 |
| Illinois: | $251,600 |
Mean price in 2022:
Detached houses: $105,718
Here: $105,718 State: $310,164 In 2-unit structures: $123,227
Here: $123,227 State: $299,638 Mobile homes: $108,110
Here: $108,110 State: $78,855
Total population: 7,334 (All urban)
Houses: 3,291 (2,984 occupied: 1,837 owner occupied, 1,185 renter occupied)
| % of renters here: | 39% |
| State: | 33% |
Housing density: 539 houses/condos per square mile
Median price asked for vacant for-sale houses and condos in 2022 in this county: $63,940.
Median contract rent in 2022: $538 (lower quartile is $343, upper quartile is $732)
Median rent asked for vacant for-rent units in 2022: $435
Median gross rent in Salem, IL in 2022: $723
Housing units in Salem with a mortgage: 1,046 (109 second mortgage, 0 home equity loan, 104 both second mortgage and home equity loan)
Houses without a mortgage: 0
Median household income for houses/condos with a mortgage: $66,502
Median household income for apartments without a mortgage: $67,043
Median monthly housing costs: $722
Compare current foreclosures in Salem, IL:
| Photo | Address | Area | Beds / Baths | Price | Details |
|---|---|---|---|---|---|

|
#1
E Bennett St
Salem, IL 62881
|
1,242 sq. feet
|
1 baths 2 beds |
show details | |

|
#2
S Franklin St
Salem, IL 62881
|
- sq. feet
|
- baths - beds |
$5,900
|
show details |

|
#3
Schroeder Dr
Salem, IL 62881
|
- sq. feet
|
- baths - beds |
show details | |

|
#4
Julia Dr
Salem, IL 62881
|
- sq. feet
|
- baths - beds |
show details | |

|
#5
N Jefferson St Apt 211
Salem, IL 62881
|
- sq. feet
|
- baths - beds |
show details | |

|
#6
Pine Tree Dr
Salem, IL 62881
|
- sq. feet
|
- baths - beds |
show details | |

|
#7
W Main St
Salem, IL 62881
|
- sq. feet
|
- baths - beds |
show details | |

|
#8
E William St
Salem, IL 62881
|
- sq. feet
|
- baths - beds |
show details | |

|
#9
Edgewood Rd
Salem, IL 62881
|
- sq. feet
|
- baths - beds |
show details | |

|
#10
Oglesby St
Salem, IL 62881
|
- sq. feet
|
- baths - beds |
show details |
| Photo | Address | Area | Beds / Baths | Price | Details |
|---|---|---|---|---|---|

|
#11
Duffy Pl
Salem, IL 62881
|
- sq. feet
|
- baths - beds |
show details | |

|
#12
Charleston Rd
Salem, IL 62881
|
- sq. feet
|
- baths - beds |
show details | |

|
#13
S Pruyn St
Salem, IL 62881
|
- sq. feet
|
- baths - beds |
show details | |

|
#14
S College St
Salem, IL 62881
|
- sq. feet
|
- baths - beds |
show details | |

|
#15
Westport Dr
Salem, IL 62881
|
- sq. feet
|
- baths - beds |
show details | |

|
#16
Bob White Ln
Salem, IL 62881
|
- sq. feet
|
- baths - beds |
show details | |

|
#17
County Farm Rd
Salem, IL 62881
|
- sq. feet
|
- baths - beds |
show details | |

|
#18
N Franklin St
Salem, IL 62881
|
- sq. feet
|
- baths - beds |
show details | |

|
#19
S Vincent St
Salem, IL 62881
|
- sq. feet
|
- baths - beds |
show details | |

|
#20
Cope Dr
Salem, IL 62881
|
- sq. feet
|
- baths - beds |
show details |
| Photo | Address | Area | Beds / Baths | Price | Details |
|---|---|---|---|---|---|

|
#21
Fielder Dr
Salem, IL 62881
|
- sq. feet
|
- baths - beds |
show details | |

|
#22
N Reel Ave
Salem, IL 62881
|
- sq. feet
|
- baths - beds |
show details | |

|
#23
Bee Branch Rd
Salem, IL 62881
|
- sq. feet
|
- baths - beds |
show details | |

|
#24
Mills Cart Rd
Salem, IL 62881
|
- sq. feet
|
- baths - beds |
show details | |

|
#25
Yards Rd
Salem, IL 62881
|
- sq. feet
|
- baths - beds |
show details | |

|
#26
N Shelby Ave
Salem, IL 62881
|
- sq. feet
|
- baths - beds |
show details | |

|
#27
W Warmouth St
Salem, IL 62881
|
- sq. feet
|
- baths - beds |
show details | |

|
#28
Shingle Oak Dr
Salem, IL 62881
|
- sq. feet
|
- baths - beds |
show details | |

|
#29
W Main St
Salem, IL 62881
|
- sq. feet
|
- baths - beds |
show details | |

|
Check over 1 million property listings on Foreclosure.com!
|
browse all offers | |||

Latest news about housing in Salem, IL collected exclusively by city-data.com from local newspapers, TV, and radio stations

 | curious about Springfield (never been there) (26 replies) |
| Peoria, Rockford, Springfield ranked by influence (7 replies) |
| Amazon looking for new headquarters...listen up because Chicago is a top contender. (349 replies) |
| Public Middle/High Schools in North/Northwest Suburbs (32 replies) |
| HELP! Schaumburg Home Pricing (0 replies) |
| Winnetka in $750K house, bad idea? (56 replies) |

Median year apartment built: 1973
Household type by relationship:
Households: 7,128- Male householders: 1,264 (403 living alone), Female householders: 1,665 (516 living alone)
1,095 spouses (1,084 opposite-sex spouses), 304 unmarried partners, (293 opposite-sex unmarried partners), 1,931 children (1,704 natural, 102 adopted, 124 stepchildren), 120 grandchildren, 106 brothers or sisters, 61 parents, 23 foster children, 166 other relatives, 168 non-relatives
- In group quarters: 219
Size of family households: 864 2-persons, 414 3-persons, 378 4-persons, 81 5-persons, 69 6-persons, 25 7-or-more-persons.
Size of nonfamily households: 969 1-person, 230 2-persons.
657 married couples with children.
772 single-parent households (276 men, 496 women).
98.8% of residents of Salem speak English at home.
0.3% of residents speak Spanish at home (43% speak English very well, 26% speak English well, 30% speak English not well).
0.1% of residents speak other Indo-European language at home (50% speak English very well, 50% speak English not well).
0.2% of residents speak Asian or Pacific Island language at home (100% speak English very well).
Foreign born population: 13 (0.2%)
(15.4% of them are naturalized citizens)
| Here: | 5.9 |
| State: | 6.4 |
| Here: | 4.1 |
| State: | 4.1 |

- Bedrooms in owner-occupied houses and condos in Salem, Illinois
- 3no bedroom
- 121 bedroom
- 4302 bedrooms
- 1,0553 bedrooms
- 2864 bedrooms
- 515+ bedrooms

- Bedrooms in renter-occupied apartments in Salem, Illinois
- 60no bedroom
- 2461 bedroom
- 5212 bedrooms
- 2583 bedrooms
- 964 bedrooms
- 45+ bedrooms

- Cars and other vehicles available in Salem in owner-occupied houses/condos
- 31no vehicle
- 4841 vehicle
- 9492 vehicles
- 2593 vehicles
- 744 vehicles
- 405+ vehicles

- Cars and other vehicles available in Salem in renter-occupied apartments
- 209no vehicle
- 5771 vehicle
- 3322 vehicles
- 533 vehicles
- 144 vehicles
- 15+ vehicles

- Rooms in owner-occupied houses in Salem, Illinois
- 01 room
- 02 rooms
- 123 rooms
- 1944 rooms
- 5245 rooms
- 4526 rooms
- 2947 rooms
- 1348 rooms
- 2279+ rooms

- Rooms in renter-occupied apartments in Salem, Illinois
- 601 room
- 672 rooms
- 2033 rooms
- 3734 rooms
- 2475 rooms
- 1026 rooms
- 917 rooms
- 368 rooms
- 79+ rooms


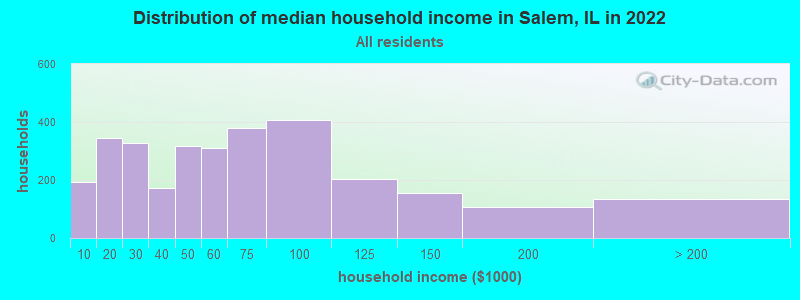
Salem, IL household income distribution

- 192Less than $10,000
- 345$10,000 to $19,999
- 328$20,000 to $29,999
- 171$30,000 to $39,999
- 316$40,000 to $49,999
- 309$50,000 to $59,999
- 381$60,000 to $74,999
- 407$75,000 to $99,999
- 205$100,000 to $124,999
- 154$125,000 to $149,999
- 106$150,000 to $199,999
- 134$200,000 or more
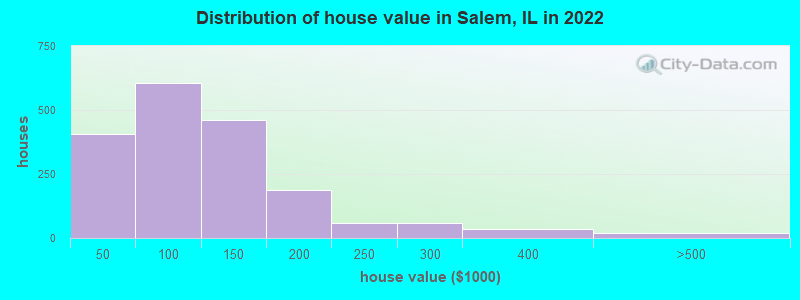
Home value of owner - occupied houses in 2022 in Salem, IL
-
- 75Less than $10,000
- 107$10,000 to $14,999
- 6$15,000 to $19,999
- 17$20,000 to $24,999
- 15$25,000 to $29,999
- 92$30,000 to $34,999
- 8$35,000 to $39,999
- 80$40,000 to $49,999
- 152$50,000 to $59,999
- 59$60,000 to $69,999
- 96$70,000 to $79,999
- 139$80,000 to $89,999
- 77$90,000 to $99,999
- 301$100,000 to $124,999
- 159$125,000 to $149,999
- 80$150,000 to $174,999
- 108$175,000 to $199,999
- 57$200,000 to $249,999
- 59$250,000 to $299,999
- 33$300,000 to $399,999
- 20$400,000 to $499,999
Rent paid by renters in 2022 in Salem, IL
-
- 28Less than $100
- 93$100 to $149
- 24$150 to $199
- 78$200 to $249
- 49$300 to $349
- 31$350 to $399
- 101$400 to $449
- 77$450 to $499
- 102$500 to $549
- 85$550 to $599
- 74$600 to $649
- 53$650 to $699
- 56$700 to $749
- 47$750 to $799
- 181$800 to $899
- 22$900 to $999
- 18$1,000 to $1,249
- 5$1,250 to $1,499
- 43No cash rent


Percentage of workers working in this county: 89.4%
Number of people working at home: 160 (4.7% of all workers)
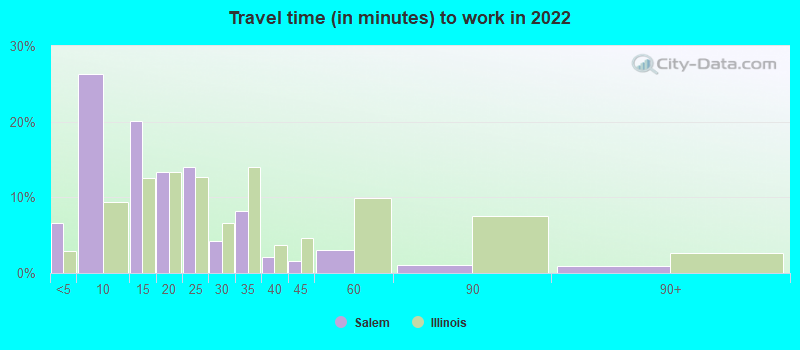
Travel time to work (commute)
- Less than 5 minutes: 329
- 5 to 9 minutes: 1,219
- 10 to 14 minutes: 629
- 15 to 19 minutes: 210
- 20 to 24 minutes: 380
- 25 to 29 minutes: 108
- 30 to 34 minutes: 185
- 35 to 39 minutes: 23
- 40 to 44 minutes: 9
- 45 to 59 minutes: 95
- 60 to 89 minutes: 10
- 90 or more minutes: 0
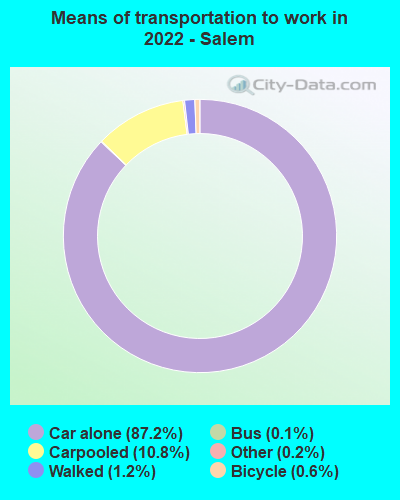
Means of transportation to work:
- Drove a car alone: 4,999 (82.3%)
- Carpooled: 657 (10.8%)
- Bus: 6 (0.1%)
- Taxi: 10 (0.2%)
- Bicycle: 35 (0.6%)
- Walked: 71 (1.2%)
- Worked at home: 160 (2.6%)

- Unemployment by race in 2022
- Unemployment rate for White non-Hispanic residents
- 3.2%Males
- 3.6%Females
- Unemployment rate for two or more race residents
- 6.2%Males

- Year of entry for the foreign-born population in Salem, Illinois
- 52010 or later
- 62000 to 2009
- 01990 to 1999
- 111980 to 1989
- 191970 to 1979
- 0Before 1970
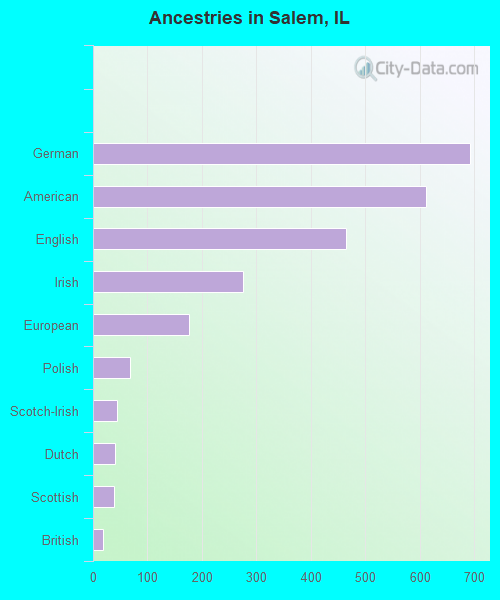
First ancestries reported:
- German: 693 (21.7%)
- American: 612 (19.2%)
- English: 465 (14.6%)
- Irish: 276 (8.6%)
- European: 176 (5.5%)
- Polish: 68 (2.1%)
- Scotch-Irish: 45 (1.4%)
- Dutch: 41 (1.3%)
- Scottish: 39 (1.2%)
- British: 19 (0.6%)
- Italian: 6 (0.2%)
- Norwegian: 5 (0.2%)
- Austrian: 4 (0.1%)
Most common places of birth for foreign-born residents (%):
| Salem: | 46.2% (6) |
| Illinois: | 34.7% (626,958) |
| Salem: | 30.8% (4) |
| Illinois: | 0.1% (1,142) |
| Salem: | 15.4% (2) |
| Illinois: | 0.5% (8,551) |
Place of birth for U.S.-born residents:
- This state: 5,817
- Other state: 1,223
- Northeast: 43
- Midwest: 692
- South: 371
- West: 111
84.2% of Salem residents lived in the same house 1 years ago.
Out of people who lived in different houses, 40.3% lived in this county.
Out of people who lived in different counties, 70.6% lived in Illinois.
| Salem: | 84.2% |
| State average: | 88.3% |
Education attainment for males 25 years and older:
- No schooling: 34
- Nursery to 4th grade: 0
- 5th and 6th grade: 0
- 7th and 8th grade: 20
- 9th grade: 7
- 10th grade: 36
- 11th grade: 27
- 12th grade, no diploma: 20
- High school graduate (or equivalency): 879
- Less than 1 year of college: 300
- Some college more than 1 year, no degree: 368
- Associate degree: 200
- Bachelor's degree: 292
- Master's degree: 42
- Professional school degree: 12
- Doctorate degree: 13

Education attainment for females 25 years and older:
- No schooling: 18
- Nursery to 4th grade: 0
- 5th and 6th grade: 7
- 7th and 8th grade: 60
- 9th grade: 10
- 10th grade: 50
- 11th grade: 49
- 12th grade, no diploma: 8
- High school graduate (or equivalency): 1,041
- Less than 1 year of college: 247
- Some college more than 1 year, no degree: 342
- Associate degree: 377
- Bachelor's degree: 255
- Master's degree: 88
- Professional school degree: 0
- Doctorate degree: 22


Housing units in structures:
- One, detached: 2,260
- Two: 189
- 3 or 4: 294
- 5 to 9: 53
- 10 to 19: 30
- 20 to 49: 62
- 50 or more: 60
- Mobile homes: 340
Median worth of mobile homes: $17,342
Housing units lacking complete kitchen facilities in 2022: 3.9%
House/condo owner moved in on average 10 years ago
Renter moved in on average 2 years ago

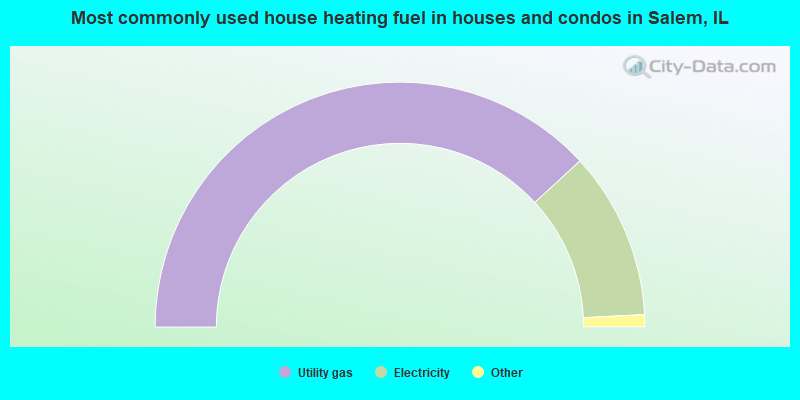
- 76.2%Utility gas
- 22.1%Electricity
- 0.9%Other fuel
- 0.4%Bottled, tank, or LP gas
- 0.3%Wood
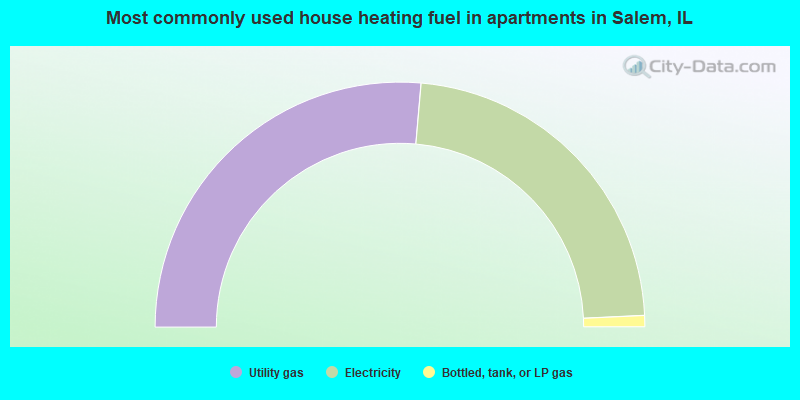
- 52.8%Utility gas
- 45.8%Electricity
- 1.5%Bottled, tank, or LP gas
Private vs. public school enrollment:
| Here: | 5.4% |
| Illinois: | 13.3% |
| Here: | 0.0% |
| Illinois: | 9.9% |
| Here: | 0.0% |
| Illinois: | 27.4% |


