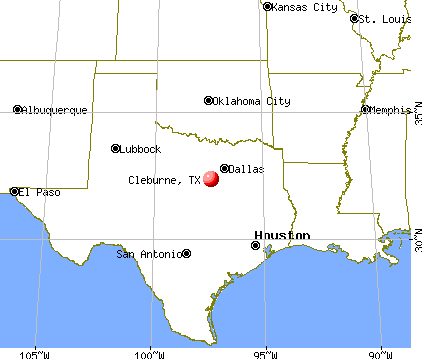
Cleburne, Texas

Cleburne: Photo of a building wall thats being painted in downtown Cleburne.
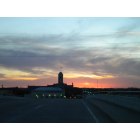
Cleburne: court house sunset
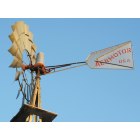
Cleburne: Aeromotor Windmill in roadside park on Highway 67 by Lake Pat Cleburne.

Cleburne: court house sunset

Cleburne: Frozen creek in Cleburne near Hulen Park.

Cleburne: The River that runs through town.
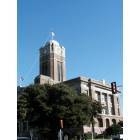
Cleburne: Johnson County Courthouse, Cleburne, Tx
- add
your
Submit your own pictures of this city and show them to the world
- OSM Map
- General Map
- Google Map
- MSN Map
Population change since 2000: +30.1%
 |
| Males: 17,520 | |
| Females: 16,306 |
| Median resident age: | 35.5 years |
| Texas median age: | 35.6 years |
Zip codes: 76033.
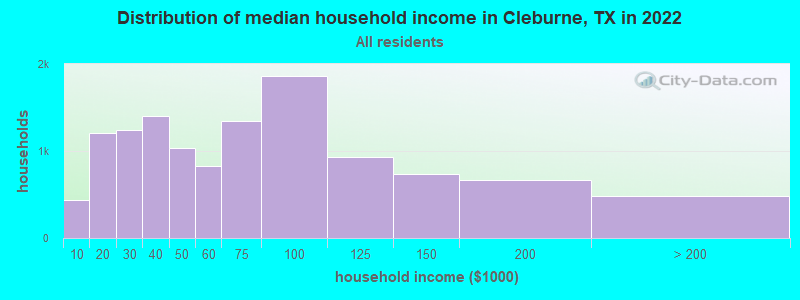
| Cleburne: | $60,345 |
| TX: | $72,284 |
Estimated per capita income in 2022: $27,819 (it was $16,762 in 2000)
Cleburne city income, earnings, and wages data
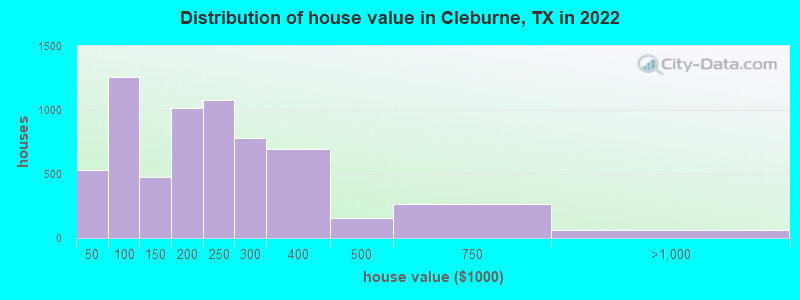
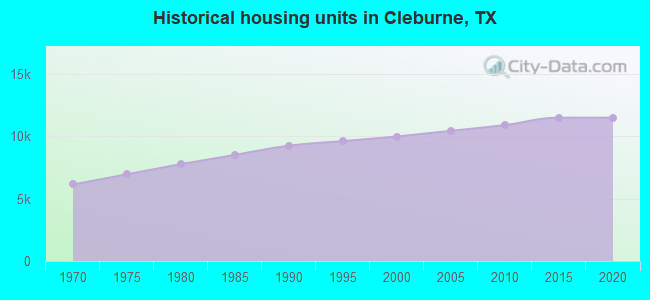
Estimated median house or condo value in 2022: $217,232 (it was $64,900 in 2000)
| Cleburne: | $217,232 |
| TX: | $275,400 |
Mean prices in 2022: all housing units: $298,957; detached houses: $335,354; townhouses or other attached units: $375,347; in 2-unit structures: $249,037; in 3-to-4-unit structures: $156,555; in 5-or-more-unit structures: $279,141; mobile homes: $147,755; occupied boats, rvs, vans, etc.: $33,472
Median gross rent in 2022: $1,231.
(10.3% for White Non-Hispanic residents, 20.4% for Black residents, 19.8% for Hispanic or Latino residents, 29.3% for American Indian residents, 16.5% for other race residents, 2.3% for two or more races residents)
Detailed information about poverty and poor residents in Cleburne, TX

Compare current foreclosures in Cleburne, TX:
| Photo | Address | Area | Beds / Baths | Price | Details |
|---|---|---|---|---|---|

|
#1
Franklin St
Cleburne, TX 76033
|
1,295 sq. feet
|
1 baths 3 beds |
show details | |

|
#2
Shoreview Dr
Cleburne, TX 76033
|
2,882 sq. feet
|
3 baths 4 beds |
show details | |

|
#3
Spring Branch Dr
Cleburne, TX 76033
|
1,513 sq. feet
|
2 baths 3 beds |
show details | |

|
#4
Woodard Ave Apt 1414
Cleburne, TX 76033
|
- sq. feet
|
- baths - beds |
show details | |

|
#5
E Highway 67, Lot 27
Cleburne, TX 76031
|
7,634 sq. feet
|
- baths - beds |
show details | |

|
#6
Dixon St
Cleburne, TX 76033
|
- sq. feet
|
- baths - beds |
show details | |

|
#7
Briarwood Dr
Cleburne, TX 76033
|
1,615 sq. feet
|
- baths - beds |
show details | |

|
#8
Christine St
Cleburne, TX 76031
|
1,477 sq. feet
|
- baths - beds |
show details | |

|
#9
S Caddo St Apt B
Cleburne, TX 76031
|
- sq. feet
|
- baths - beds |
show details | |

|
#10
Miss Mary Rd
Cleburne, TX 76031
|
- sq. feet
|
- baths - beds |
show details |
| Photo | Address | Area | Beds / Baths | Price | Details |
|---|---|---|---|---|---|

|
#11
S Pendell Ave
Cleburne, TX 76033
|
1,132 sq. feet
|
- baths - beds |
show details | |

|
#12
Bellevue Dr
Cleburne, TX 76033
|
- sq. feet
|
- baths - beds |
show details | |

|
#13
County Road 414
Cleburne, TX 76031
|
- sq. feet
|
- baths - beds |
show details | |

|
#14
County Road 425a
Cleburne, TX 76031
|
2,432 sq. feet
|
- baths - beds |
show details | |

|
#15
Fm 1434
Cleburne, TX 76033
|
864 sq. feet
|
- baths - beds |
show details | |

|
#16
Downing Ln
Cleburne, TX 76031
|
3,661 sq. feet
|
- baths - beds |
show details | |

|
#17
County Road 415
Cleburne, TX 76031
|
- sq. feet
|
- baths - beds |
show details | |

|
#18
Ascot Dr
Cleburne, TX 76033
|
1,699 sq. feet
|
- baths - beds |
show details | |

|
#19
N Buffalo Ave
Cleburne, TX 76033
|
- sq. feet
|
- baths - beds |
show details | |

|
#20
N Buffalo Ave
Cleburne, TX 76033
|
- sq. feet
|
- baths - beds |
show details |
| Photo | Address | Area | Beds / Baths | Price | Details |
|---|---|---|---|---|---|

|
#21
County Road 1115
Cleburne, TX 76033
|
- sq. feet
|
- baths - beds |
show details | |

|
#22
Sausalito Trl
Cleburne, TX 76033
|
- sq. feet
|
- baths - beds |
show details | |

|
#23
Smooth Stone Dr
Cleburne, TX 76033
|
1,680 sq. feet
|
- baths - beds |
show details | |

|
#24
Sausalito Trl
Cleburne, TX 76033
|
- sq. feet
|
- baths - beds |
show details | |

|
#25
County Road 801c # 111
Cleburne, TX 76031
|
- sq. feet
|
- baths - beds |
show details | |

|
#26
County Road 426
Cleburne, TX 76031
|
- sq. feet
|
- baths - beds |
show details | |

|
#27
N Caddo St, Pmb 137
Cleburne, TX 76031
|
- sq. feet
|
- baths - beds |
show details | |

|
#28
Mimosa St
Cleburne, TX 76033
|
- sq. feet
|
- baths - beds |
show details | |

|
#29
County Road 415
Cleburne, TX 76031
|
2,794 sq. feet
|
- baths - beds |
show details | |

|
#30
N Nolan River Rd Apt A
Cleburne, TX 76033
|
- sq. feet
|
- baths - beds |
show details |
| Photo | Address | Area | Beds / Baths | Price | Details |
|---|---|---|---|---|---|

|
#31
Westcourt Dr
Cleburne, TX 76033
|
- sq. feet
|
- baths - beds |
show details | |

|
#32
Davis St
Cleburne, TX 76033
|
1,512 sq. feet
|
- baths - beds |
show details | |

|
#33
County Road 1104
Cleburne, TX 76031
|
- sq. feet
|
- baths - beds |
show details | |

|
#34
Mimosa St
Cleburne, TX 76033
|
1,580 sq. feet
|
- baths - beds |
show details | |

|
#35
Peighton Dr
Cleburne, TX 76033
|
- sq. feet
|
- baths - beds |
show details | |

|
#36
Fremont Trl
Cleburne, TX 76033
|
- sq. feet
|
- baths - beds |
show details | |

|
#37
County Road 417a
Cleburne, TX 76031
|
728 sq. feet
|
- baths - beds |
show details | |

|
#38
Nolan Ridge Dr
Cleburne, TX 76033
|
1,456 sq. feet
|
- baths - beds |
show details | |

|
#39
Dublin Dr
Cleburne, TX 76033
|
- sq. feet
|
- baths - beds |
show details | |

|
#40
E Fm 916
Cleburne, TX 76031
|
1,468 sq. feet
|
- baths - beds |
show details |
| Photo | Address | Area | Beds / Baths | Price | Details |
|---|---|---|---|---|---|

|
#41
N Anglin St
Cleburne, TX 76031
|
- sq. feet
|
- baths - beds |
show details | |

|
#42
Mansfield Rd
Cleburne, TX 76031
|
- sq. feet
|
- baths - beds |
show details | |

|
Check over 1 million property listings on Foreclosure.com!
|
browse all offers | |||


- 18,95255.6%White alone
- 11,04632.4%Hispanic
- 2,2486.6%Two or more races
- 1,9475.7%Black alone
- 2830.8%Asian alone
- 1080.3%American Indian alone
- 370.1%Other race alone
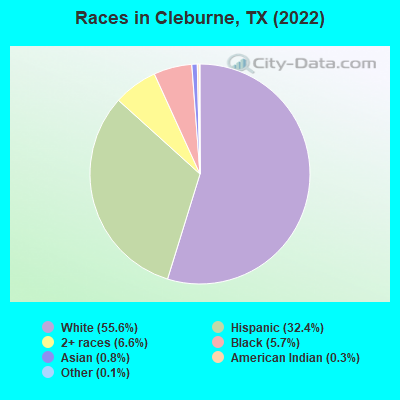
Races in Cleburne detailed stats: ancestries, foreign born residents, place of birth
According to our research of Texas and other state lists, there were 124 registered sex offenders living in Cleburne, Texas as of June 10, 2024.
The ratio of all residents to sex offenders in Cleburne is 248 to 1.
Type |
2009 |
2010 |
2011 |
2012 |
2013 |
2014 |
2015 |
2016 |
2017 |
2018 |
2019 |
2020 |
2021 |
2022 |
|---|---|---|---|---|---|---|---|---|---|---|---|---|---|---|
| Murders (per 100,000) | 0 (0.0) | 0 (0.0) | 0 (0.0) | 1 (3.3) | 0 (0.0) | 1 (3.4) | 0 (0.0) | 0 (0.0) | 0 (0.0) | 2 (6.6) | 0 (0.0) | 1 (3.2) | 0 (0.0) | 2 (6.1) |
| Rapes (per 100,000) | 45 (148.6) | 28 (95.4) | 39 (130.2) | 28 (92.9) | 20 (68.2) | 15 (50.4) | 22 (73.7) | 15 (49.9) | 25 (82.5) | 8 (26.4) | 26 (84.3) | 23 (73.0) | 32 (99.2) | 22 (67.2) |
| Robberies (per 100,000) | 24 (79.2) | 16 (54.5) | 19 (63.4) | 21 (69.7) | 11 (37.5) | 8 (26.9) | 11 (36.8) | 13 (43.2) | 6 (19.8) | 13 (42.9) | 8 (25.9) | 11 (34.9) | 7 (21.7) | 4 (12.2) |
| Assaults (per 100,000) | 129 (425.9) | 130 (443.1) | 102 (340.5) | 98 (325.3) | 60 (204.6) | 52 (174.9) | 68 (227.7) | 59 (196.2) | 38 (125.3) | 54 (178.1) | 68 (220.3) | 69 (219.1) | 113 (350.4) | 32 (97.8) |
| Burglaries (per 100,000) | 210 (693.4) | 245 (835.1) | 294 (981.5) | 267 (886.3) | 222 (757.0) | 173 (581.8) | 159 (532.4) | 157 (522.1) | 144 (474.9) | 80 (263.9) | 147 (476.3) | 87 (276.3) | 69 (214.0) | 61 (186.4) |
| Thefts (per 100,000) | 1,044 (3,447) | 1,035 (3,528) | 1,078 (3,599) | 1,005 (3,336) | 754 (2,571) | 774 (2,603) | 727 (2,434) | 582 (1,936) | 510 (1,682) | 432 (1,425) | 397 (1,286) | 374 (1,188) | 397 (1,231) | 265 (809.7) |
| Auto thefts (per 100,000) | 61 (201.4) | 58 (197.7) | 56 (187.0) | 58 (192.5) | 46 (156.9) | 56 (188.3) | 48 (160.7) | 43 (143.0) | 54 (178.1) | 32 (105.6) | 46 (149.1) | 63 (200.1) | 45 (139.5) | 19 (58.1) |
| Arson (per 100,000) | 4 (13.2) | 3 (10.2) | 1 (3.3) | 4 (13.3) | 0 (0.0) | 3 (10.1) | 2 (6.7) | 1 (3.3) | 1 (3.3) | 0 (0.0) | 0 (0.0) | 3 (9.5) | 4 (12.4) | 2 (6.1) |
| City-Data.com crime index | 430.3 | 396.7 | 418.9 | 377.8 | 275.1 | 250.1 | 263.0 | 217.5 | 211.7 | 166.7 | 216.0 | 202.0 | 231.4 | 139.3 |
The City-Data.com crime index weighs serious crimes and violent crimes more heavily. Higher means more crime, U.S. average is 246.1. It adjusts for the number of visitors and daily workers commuting into cities.

Crime rate in Cleburne detailed stats: murders, rapes, robberies, assaults, burglaries, thefts, arson
Full-time law enforcement employees in 2021, including police officers: 69 (52 officers - 45 male; 7 female).
| Officers per 1,000 residents here: | 1.61 |
| Texas average: | 2.07 |
 Recent articles from our blog. Our writers, many of them Ph.D. graduates or candidates, create easy-to-read articles on a wide variety of topics.

 | Houston CORE developments thread (750 replies) |
| People commuting from rural areas (49 replies) |
| Luby's is closing (40 replies) |
| Why are there so many blacks in west Houston? (73 replies) |
| where to eat (19 replies) |
| Rural cities near Dallas/Fort Worth (13 replies) |
Latest news from Cleburne, TX collected exclusively by city-data.com from local newspapers, TV, and radio stations
Ancestries: American (36.0%), English (6.0%), German (3.5%), Irish (2.2%), European (1.8%), Scottish (1.1%).
Current Local Time: CST time zone
Land area: 27.8 square miles.
Population density: 1,217 people per square mile (low).
1,954 residents are foreign born (4.9% Latin America).
| This city: | 5.7% |
| Texas: | 17.1% |
Median real estate property taxes paid for housing units with mortgages in 2022: $3,761 (1.6%)
Median real estate property taxes paid for housing units with no mortgage in 2022: $1,854 (0.9%)
Nearest city with pop. 50,000+: Fort Worth, TX  (27.0 miles , pop. 534,694).
Nearest city with pop. 1,000,000+: Dallas, TX (47.0 miles , pop. 1,188,580).
Nearest cities:
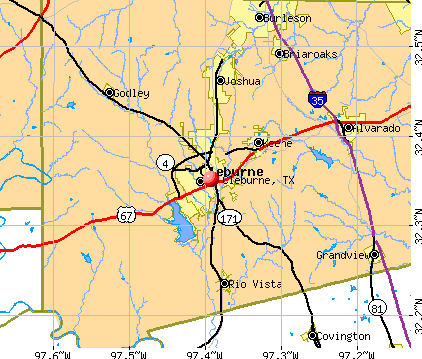
), ), ), ), Latitude: 32.35 N, Longitude: 97.39 W
Daytime population change due to commuting: +4,347 (+12.8%)
Workers who live and work in this city: 9,297 (61.2%)
Area codes: 817, 682

Cleburne, Texas accommodation & food services, waste management - Economy and Business Data
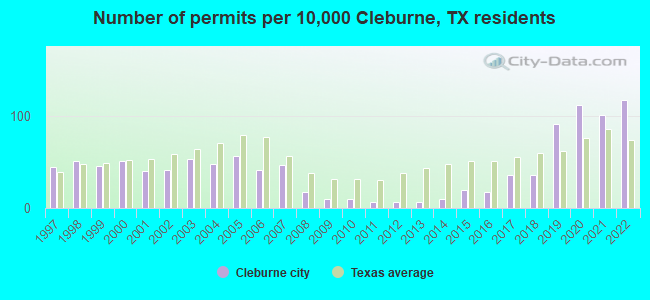
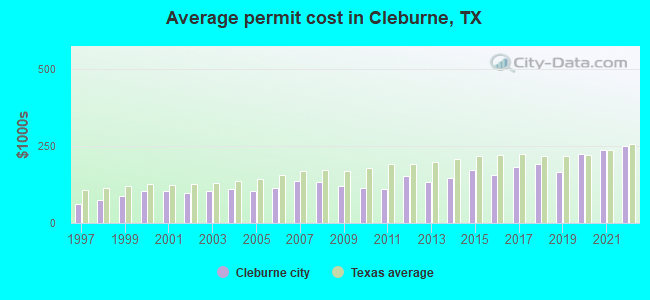
Single-family new house construction building permits:
- 2022: 307 buildings, average cost: $249,800
- 2021: 264 buildings, average cost: $235,500
- 2020: 290 buildings, average cost: $224,800
- 2019: 238 buildings, average cost: $166,200
- 2018: 93 buildings, average cost: $191,100
- 2017: 94 buildings, average cost: $182,600
- 2016: 43 buildings, average cost: $156,600
- 2015: 52 buildings, average cost: $172,500
- 2014: 25 buildings, average cost: $147,000
- 2013: 19 buildings, average cost: $134,600
- 2012: 17 buildings, average cost: $152,800
- 2011: 19 buildings, average cost: $109,700
- 2010: 25 buildings, average cost: $113,000
- 2009: 25 buildings, average cost: $122,100
- 2008: 43 buildings, average cost: $132,700
- 2007: 122 buildings, average cost: $137,000
- 2006: 107 buildings, average cost: $113,300
- 2005: 147 buildings, average cost: $103,500
- 2004: 124 buildings, average cost: $110,200
- 2003: 141 buildings, average cost: $104,400
- 2002: 108 buildings, average cost: $96,500
- 2001: 105 buildings, average cost: $104,500
- 2000: 133 buildings, average cost: $103,000
- 1999: 119 buildings, average cost: $87,700
- 1998: 132 buildings, average cost: $74,500
- 1997: 118 buildings, average cost: $63,300
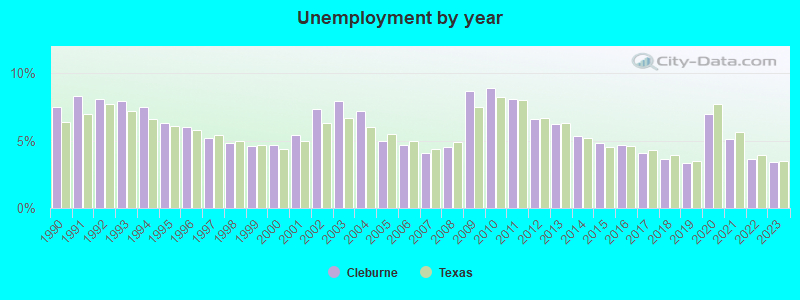
| Here: | 3.4% |
| Texas: | 3.5% |
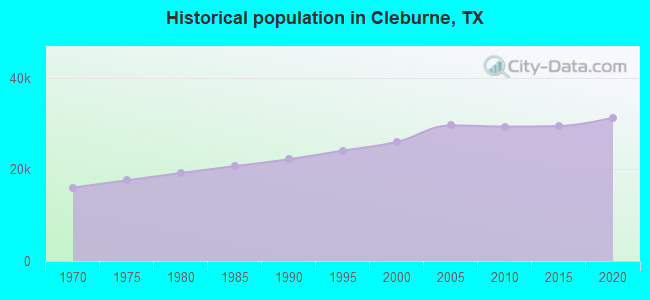
Population change in the 1990s: +3,209 (+14.1%).
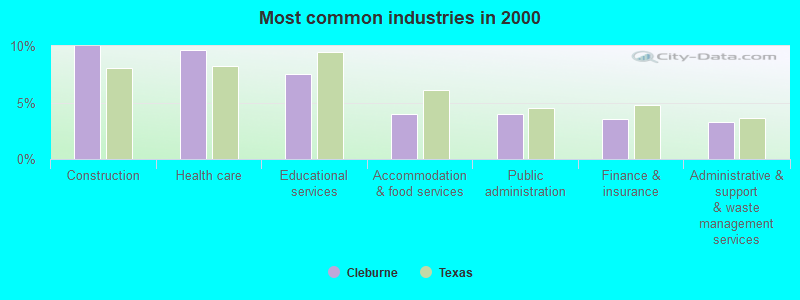
- Construction (10.0%)
- Health care (9.7%)
- Educational services (7.6%)
- Accommodation & food services (4.0%)
- Public administration (3.9%)
- Finance & insurance (3.5%)
- Administrative & support & waste management services (3.3%)
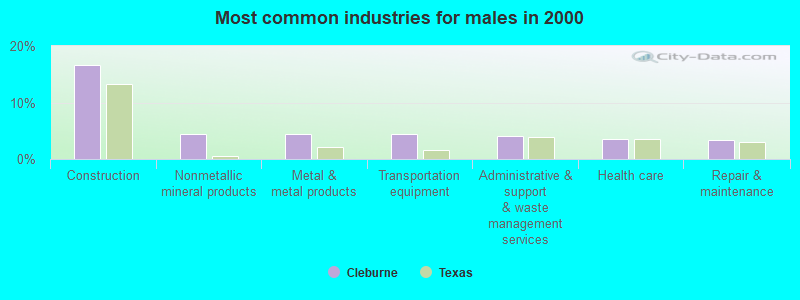
- Construction (16.7%)
- Nonmetallic mineral products (4.4%)
- Metal & metal products (4.4%)
- Transportation equipment (4.3%)
- Administrative & support & waste management services (4.1%)
- Health care (3.5%)
- Repair & maintenance (3.4%)
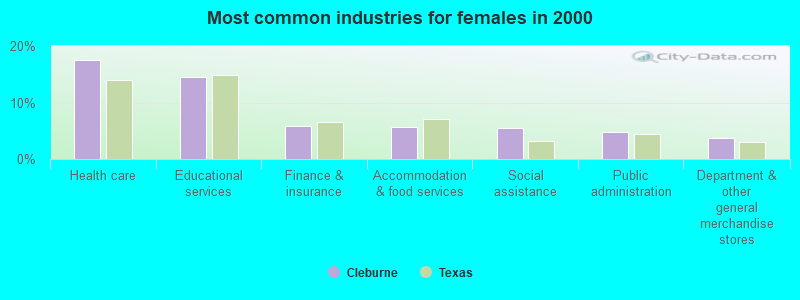
- Health care (17.4%)
- Educational services (14.5%)
- Finance & insurance (5.8%)
- Accommodation & food services (5.6%)
- Social assistance (5.5%)
- Public administration (4.7%)
- Department & other general merchandise stores (3.7%)
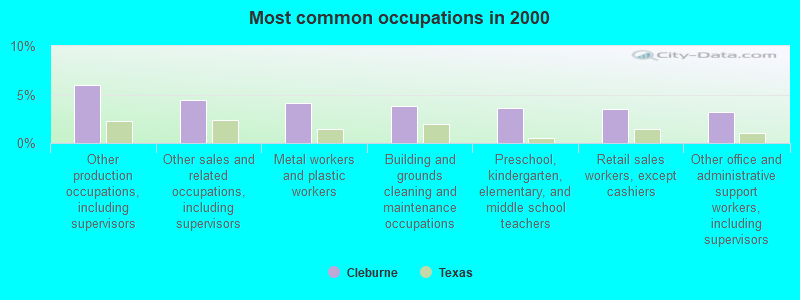
- Other production occupations, including supervisors (6.0%)
- Other sales and related occupations, including supervisors (4.4%)
- Metal workers and plastic workers (4.1%)
- Building and grounds cleaning and maintenance occupations (3.8%)
- Preschool, kindergarten, elementary, and middle school teachers (3.6%)
- Retail sales workers, except cashiers (3.5%)
- Other office and administrative support workers, including supervisors (3.1%)
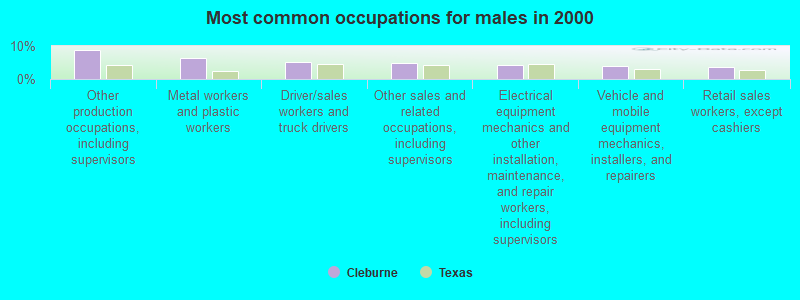
- Other production occupations, including supervisors (8.8%)
- Metal workers and plastic workers (6.4%)
- Driver/sales workers and truck drivers (5.1%)
- Other sales and related occupations, including supervisors (4.8%)
- Electrical equipment mechanics and other installation, maintenance, and repair workers, including supervisors (4.2%)
- Vehicle and mobile equipment mechanics, installers, and repairers (3.9%)
- Retail sales workers, except cashiers (3.7%)

- Preschool, kindergarten, elementary, and middle school teachers (7.2%)
- Other office and administrative support workers, including supervisors (6.3%)
- Secretaries and administrative assistants (5.0%)
- Building and grounds cleaning and maintenance occupations (4.4%)
- Information and record clerks, except customer service representatives (4.3%)
- Other sales and related occupations, including supervisors (3.9%)
- Registered nurses (3.8%)
Average climate in Cleburne, Texas
Based on data reported by over 4,000 weather stations


|
|


(lower is better)
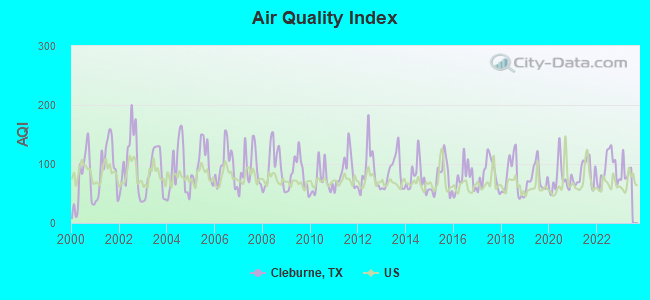
Air Quality Index (AQI) level in 2022 was 91.7. This is worse than average.
| City: | 91.7 |
| U.S.: | 72.6 |
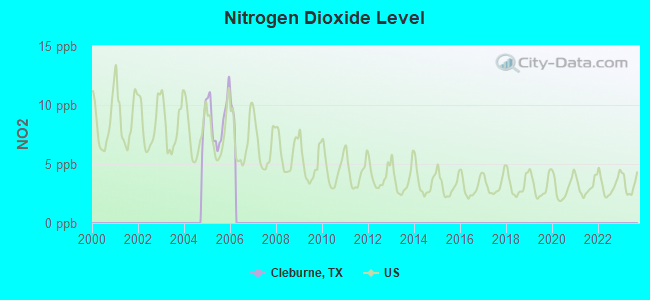
Nitrogen Dioxide (NO2) [ppb] level in 2005 was 8.79. This is significantly worse than average. Closest monitor was 22.1 miles away from the city center.
| City: | 8.79 |
| U.S.: | 5.11 |
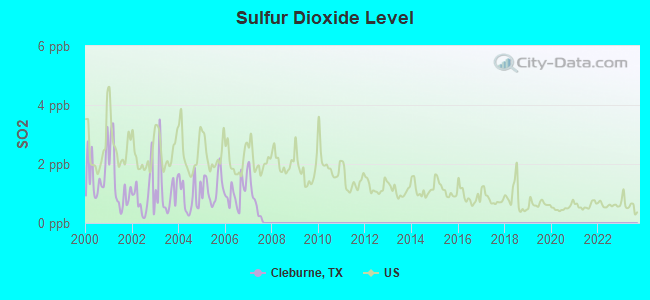
Sulfur Dioxide (SO2) [ppb] level in 2007 was 0.773. This is significantly better than average. Closest monitor was 22.1 miles away from the city center.
| City: | 0.773 |
| U.S.: | 1.515 |
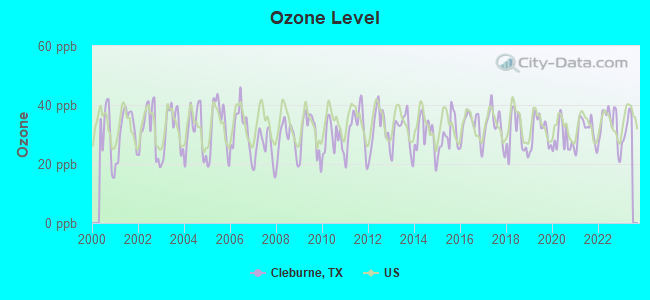
Ozone [ppb] level in 2022 was 33.4. This is about average. Closest monitor was 2.5 miles away from the city center.
| City: | 33.4 |
| U.S.: | 33.3 |
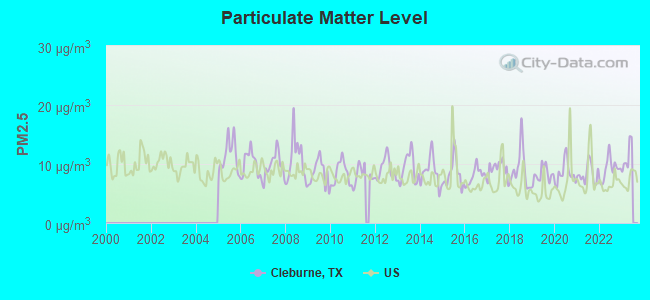
Particulate Matter (PM2.5) [µg/m3] level in 2022 was 9.17. This is about average. Closest monitor was 21.9 miles away from the city center.
| City: | 9.17 |
| U.S.: | 8.11 |
Tornado activity:
Cleburne-area historical tornado activity is above Texas state average. It is 139% greater than the overall U.S. average.
On 5/26/1976, a category F4 (max. wind speeds 207-260 mph) tornado 8.7 miles away from the Cleburne city center caused between $500,000 and $5,000,000 in damages.
On 11/24/1973, a category F3 (max. wind speeds 158-206 mph) tornado 0.4 miles away from the city center .
Earthquake activity:
Cleburne-area historical earthquake activity is significantly above Texas state average. It is 417% greater than the overall U.S. average.On 11/6/2011 at 03:53:10, a magnitude 5.7 (5.7 MW, Depth: 3.2 mi, Class: Moderate, Intensity: VI - VII) earthquake occurred 222.9 miles away from the city center
On 9/3/2016 at 12:02:44, a magnitude 5.8 (5.8 MW, Depth: 3.5 mi) earthquake occurred 283.0 miles away from the city center
On 6/16/1978 at 11:46:54, a magnitude 5.3 (4.4 MB, 4.6 UK, 5.3 ML) earthquake occurred 201.9 miles away from the city center
On 5/17/2012 at 08:12:00, a magnitude 4.8 (4.8 MW, Depth: 3.1 mi, Class: Light, Intensity: IV - V) earthquake occurred 179.5 miles away from Cleburne center
On 5/7/2015 at 22:58:05, a magnitude 4.0 (4.0 MW, Depth: 1.6 mi) earthquake occurred 19.3 miles away from Cleburne center
On 11/7/2016 at 01:44:24, a magnitude 5.0 (5.0 MW, Depth: 2.8 mi) earthquake occurred 254.0 miles away from Cleburne center
Magnitude types: body-wave magnitude (MB), local magnitude (ML), moment magnitude (MW)
Natural disasters:
The number of natural disasters in Johnson County (15) is near the US average (15).Major Disasters (Presidential) Declared: 6
Emergencies Declared: 6
Causes of natural disasters: Fires: 6, Storms: 4, Floods: 3, Hurricanes: 3, Tornadoes: 3, Wind: 1, Other: 2 (Note: some incidents may be assigned to more than one category).

Hospitals in Cleburne:
- COMMUNITY LIVING CONCEPTS COUNTRY MEADOW (2764 CO RD 310)
- COMMUNITY LIVING CONCEPTS FEATHERSTON (201 FEATHERSTON)
- COMMUNITY LIVING CONCEPTS ISLAND GROVE ROAD (1709 F M 2135)
- DALLAS HOSPICE INC (505 N RIDGEWAY DRIVE SUITE 173)
- QUAIL PARK (805 QUAIL PARK RUSH)
- ROLLING ACRES (ROUTE 4 BOX 169)
- SPRUCE HOUSE (802 BERKLEY)
- TEXAS HEALTH HARRIS METHODIST HOSPITAL CLEBURNE (Voluntary non-profit - Church, 201 WALLS DRIVE)
- TRINITY HOSPICE CASTLE PEAK LP (1705 NOLAN RIVER ROAD)
Nursing Homes in Cleburne:
- CLEBURNE REHABILITATION AND HEALTH CARE CENTER (1108 W KILPATRICK ST)
- COLONIAL MANOR NURSING CENTER (2035 N GRANBURY ST)
- GOLDEN AGE MANOR (1102 WILLIAMS)
- HERITAGE TRAILS NURSING AND REHABILITATION CENTER (301 LINCOLN PARK DR)
- RIDGEVIEW REHABILITATION AND SKILLED NURSING (206 WALLS DR)
Dialysis Facilities in Cleburne:
- CLEBURNE DIALYSIS CENTER (160 JACK BURTON RD)
- US RENAL CARE TARRANT DIALYSIS CLEBURNE (1206 N. HENDERSON)
Home Health Centers in Cleburne:
Airports and heliports located in Cleburne:
- Cleburne Regional Airport (CPT) (Runways: 1, Air Taxi Ops: 300, Itinerant Ops: 12,000, Local Ops: 21,000, Military Ops: 24)
- Blackwood Airpark Airport (TX46) (Runways: 1)
- Goatneck Airport (13TX) (Runways: 1)
- Texas Health Resources Cleburne Heliport (4TA9)
Colleges/universities with over 2000 students nearest to Cleburne:
- Texas Christian University (about 25 miles; Fort Worth, TX; Full-time enrollment: 9,131)
- Tarrant County College District (about 28 miles; Fort Worth, TX; FT enrollment: 33,775)
- Hill College (about 30 miles; Hillsboro, TX; FT enrollment: 2,968)
- The University of Texas at Arlington (about 31 miles; Arlington, TX; FT enrollment: 27,453)
- Weatherford College (about 36 miles; Weatherford, TX; FT enrollment: 4,080)
- Dallas Baptist University (about 36 miles; Dallas, TX; FT enrollment: 4,280)
- Mountain View College (about 39 miles; Dallas, TX; FT enrollment: 4,988)
Public high schools in Cleburne:
- CLEBURNE H S (Students: 1,666, Location: 1501 HARLIN DR, Grades: 9-12)
- LOWELL SMITH JR MIDDLE (Students: 861, Location: 1710 COUNTRY CLUB, Grades: 6-9)
- AD WHEAT MIDDLE (Students: 716, Location: 810 N COLONIAL, Grades: 6-9)
- JUVENILE JUSTICE ALTERNATIVE (Location: 1102 E KILPATRICK STE C, Grades: 11-12)
- TEAM SCH (Location: 1005 S ANGLIN, Grades: 9-12)
Private high school in Cleburne:
Public elementary/middle schools in Cleburne:
- SANTA FE EL (Students: 1,383, Location: 1601 E HENDERSON, Grades: PK-5)
- IRVING EL (Students: 524, Location: 345 HIX RD, Grades: PK-5)
- ADAMS EL (Students: 518, Location: 1492 IS GROVE RD, Grades: KG-5)
- COOKE EL (Students: 507, Location: 902 PHILLIPS ST, Grades: KG-5)
- GERARD EL (Students: 496, Location: 1212 HYDE PARK, Grades: PK-5)
- MARTI EL (Students: 438, Location: 2020 W KILPATRICK, Grades: KG-5)
- COLEMAN EL (Location: 920 W WESTHILL DR, Grades: PK-5)
Private elementary/middle school in Cleburne:
Points of interest:
Notable locations in Cleburne: Pat Cleburne Municipal Golf Course (A), Johnson County Courthouse (B), Layland Museum Complex (C), Cleburne Fire Department and Ambulance Station 1 (D), Cleburne Fire Department and Ambulance Station 2 (E), Cleburne Fire Department and Ambulance Station 3 (F), CareFlite - Johnson County Station 1 (G), Cleburne Carnegie Library (H). Display/hide their locations on the map
Churches in Cleburne include: Saint Mark Church (A), Victory Church (B), Westside Church (C), College Heights Church (D), Calvary Chapel Church (E), Seventh Day Adventist Church (F), United Presbyterian Church (G), First United Pentecostal Church (H), Calvary Pentecostal Church (I). Display/hide their locations on the map
Cemeteries: Greenacres Memorial Park (1), Cleburne Memorial Park (2), Oak Cemetery (3), Old Lane Prairie Cemetery (4), Lightfoot Cemetery (5), Rose Hill Cemetery (6). Display/hide their locations on the map
Reservoir: Lake Pat Cleburne (A). Display/hide its location on the map
Streams, rivers, and creeks: West Buffalo Creek (A), Town Branch (B), Robinson Branch (C), East Buffalo Creek (D), Lockett Branch (E). Display/hide their locations on the map
Parks in Cleburne include: Carver Park (1), Yellow Jacket Stadium (2), Hulen Park (3), Buddy Stewart Park (4). Display/hide their locations on the map
Tourist attractions: Cleburne-City - Museum (201 North Caddo Street) (1), Chamber Of Commerce (Tourism Consultants; 1511 W Henderson St) (2), Amtech International (Amusement & Theme Parks; 3306 North Main Street) (3), Bowden Travel (Tours & Charters; 1643 West Henderson Street Suite A) (4). Display/hide their approximate locations on the map
Hotels: Best Western Smithfield Inn (1707 West Henderson) (1), American Inn (1836 North Main Street) (2), Comfort Inn (2117 N Main St) (3), Comfort Inn Cleburne (2117 North Main) (4). Display/hide their approximate locations on the map
Birthplace of: David McWilliams (American football) - Football player and coach, Jennifer Archer - Romantic fiction writer, John Steakley - Science fiction writer, Merrill Leroy Ellis - Electronic Music Composer & Professor, Robert Summers (artist) - Artist, Spike Owen - Baseball player, Johnny Carroll - Bandleader, Tommy Fine - Baseball player, Al Baird - Baseball player, Dave Owen - Baseball player.
Drinking water stations with addresses in Cleburne and their reported violations in the past:
CEDAR HILL SUBDIVISION (Population served: 30, Groundwater):Past monitoring violations:BRAZOS REGIONAL PUA SWATS (Population served: 0, Surface water):
- 2 routine major monitoring violations
Past monitoring violations:
- Monthly Turbidity Exceed (Enhanced SWTR) - In FEB-2012, Contaminant: IESWTR. Follow-up actions: St Compliance achieved (APR-01-2012), St Public Notif requested (MAY-25-2012), St Violation/Reminder Notice (MAY-25-2012), St Public Notif received (JUL-25-2012)
- Single Turbidity Exceed (Enhanced SWTR) - In FEB-2012, Contaminant: IESWTR. Follow-up actions: St Compliance achieved (APR-01-2012), St Public Notif requested (MAY-25-2012), St Violation/Reminder Notice (MAY-25-2012), St Public Notif received (JUL-25-2012)
| This city: | 2.7 people |
| Texas: | 2.8 people |
| This city: | 70.3% |
| Whole state: | 69.9% |
| This city: | 6.5% |
| Whole state: | 6.0% |
Likely homosexual households (counted as self-reported same-sex unmarried-partner households)
- Lesbian couples: 0.4% of all households
- Gay men: 0.2% of all households
People in group quarters in Cleburne in 2010:
- 478 people in local jails and other municipal confinement facilities
- 316 people in nursing facilities/skilled-nursing facilities
- 56 people in other noninstitutional facilities
- 25 people in group homes intended for adults
People in group quarters in Cleburne in 2000:
- 341 people in nursing homes
- 302 people in local jails and other confinement facilities (including police lockups)
- 56 people in homes for the mentally retarded
Banks with most branches in Cleburne (2011 data):
- First Financial Bank, National Association: Drive-In Branch, Cleburne Branch, at 403 North Main Street. Info updated 2006/11/03: Bank assets: $308.6 mil, Deposits: $278.3 mil, local headquarters, positive income, Commercial Lending Specialization, 7 total offices, Holding Company: First Financial Bankshares, Inc.
- Pinnacle Bank: Cleburne Branch at 224 W. Katherine P. Raines Drive, branch established on 2005/02/15; Cleburne Branch at 1403 West Henderson, branch established on 2000/05/17. Info updated 2009/03/03: Bank assets: $548.6 mil, Deposits: $460.0 mil, headquarters in Keene, TX, positive income, Commercial Lending Specialization, 13 total offices, Holding Company: Pinnacle Bancorp, Inc.
- Bank of America, National Association: Cleburne Branch at 1 North Main Street, branch established on 1934/01/20; Cleburne Motor Branch at 103 South Mill St, branch established on 1992/06/30. Info updated 2009/11/18: Bank assets: $1,451,969.3 mil, Deposits: $1,077,176.8 mil, headquarters in Charlotte, NC, positive income, 5782 total offices, Holding Company: Bank Of America Corporation
- Compass Bank: Cleburne Branch at 1671 W Henderson St, branch established on 1955/08/15. Info updated 2011/02/24: Bank assets: $63,107.0 mil, Deposits: $46,232.4 mil, headquarters in Birmingham, AL, negative income in the last year, Commercial Lending Specialization, 720 total offices, Holding Company: Banco Bilbao Vizcaya Argentaria, S.A.
- Woodforest National Bank: Cleburne Wal-Mart Branch at 1616 W. Henderson, branch established on 2001/02/19. Info updated 2011/05/10: Bank assets: $3,488.9 mil, Deposits: $3,097.6 mil, headquarters in Houston, TX, positive income, Commercial Lending Specialization, 766 total offices, Holding Company: Woodforest Financial Group Employee Stock Ownership Plan (With 401(K) Provisions)
- Community Bank: Cleburne Branch at 104 North Nolan River Road, branch established on 1999/06/07. Info updated 2010/05/18: Bank assets: $525.1 mil, Deposits: $473.0 mil, headquarters in Fort Worth, TX, positive income, Commercial Lending Specialization, 10 total offices, Holding Company: Community Bankers, Inc.
- Grandview Bank: Cleburne Branch at 303 Colonial Drive, branch established on 1999/08/23. Info updated 2007/01/10: Bank assets: $110.3 mil, Deposits: $99.2 mil, headquarters in Grandview, TX, positive income, Commercial Lending Specialization, 3 total offices, Holding Company: Afin, Ltd.
- Colonial Savings, F.A.: Cleburne Branch at 110 N Main St, branch established on 2000/12/11. Info updated 2011/07/21: Bank assets: $921.1 mil, Deposits: $580.8 mil, headquarters in Fort Worth, TX, positive income, Mortgage Lending Specialization, 8 total offices
- OmniAmerican Bank: Cleburne at 1204 W. Henderson Road, branch established on 2006/04/06. Info updated 2011/07/21: Bank assets: $1,336.0 mil, Deposits: $818.7 mil, headquarters in Fort Worth, TX, positive income, Mortgage Lending Specialization, 15 total offices
For population 15 years and over in Cleburne:
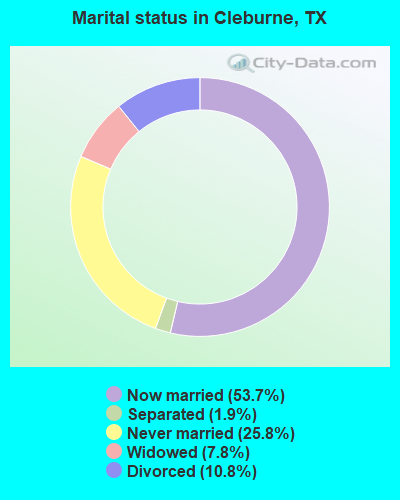
- Never married: 25.8%
- Now married: 53.7%
- Separated: 1.9%
- Widowed: 7.8%
- Divorced: 10.8%
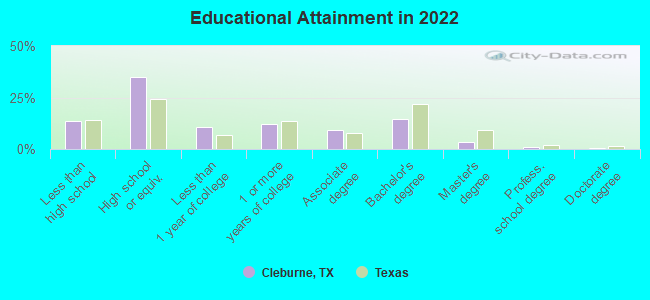
For population 25 years and over in Cleburne:
- High school or higher: 84.0%
- Bachelor's degree or higher: 16.6%
- Graduate or professional degree: 4.6%
- Unemployed: 5.4%
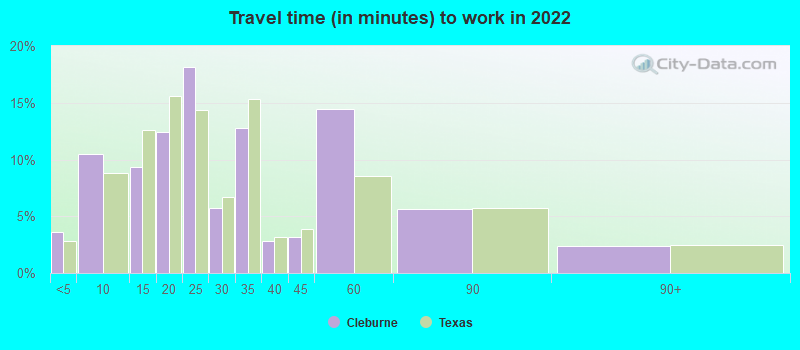
- Mean travel time to work (commute): 27.2 minutes
| Here: | 11.5 |
| Texas average: | 14.0 |
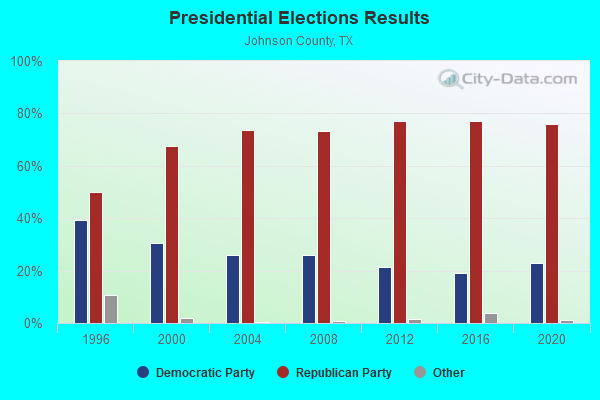
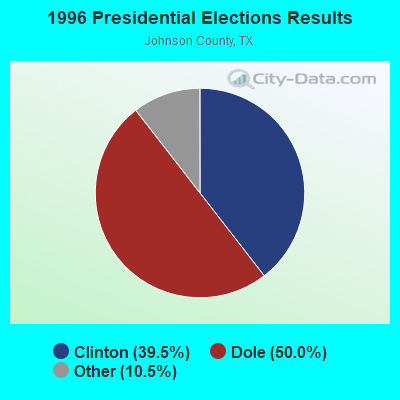
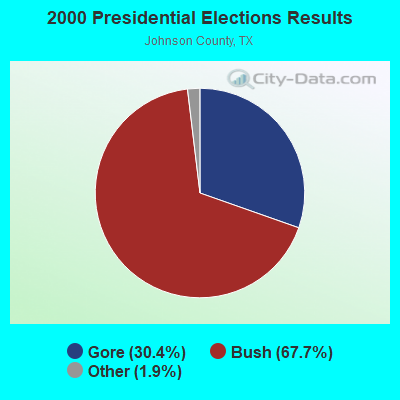

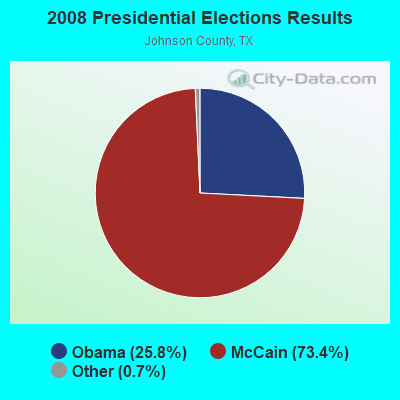
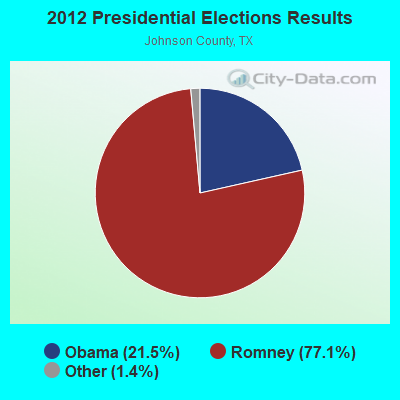
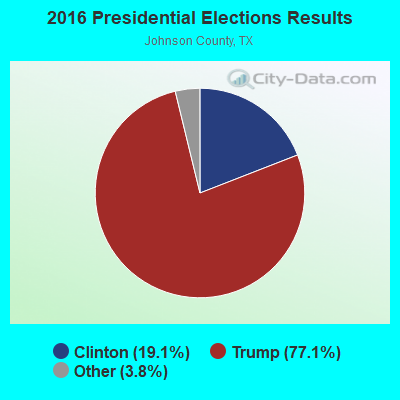

Graphs represent county-level data. Detailed 2008 Election Results
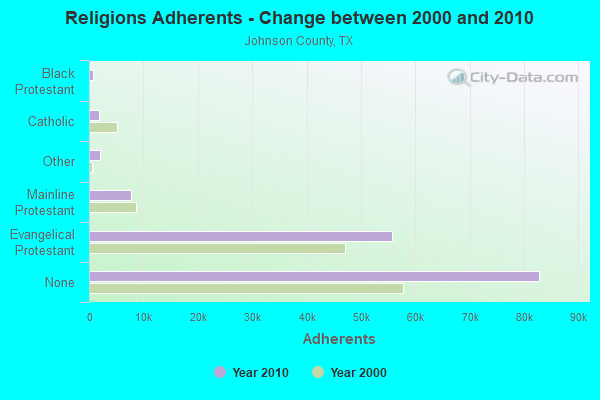
Religion statistics for Cleburne, TX (based on Johnson County data)
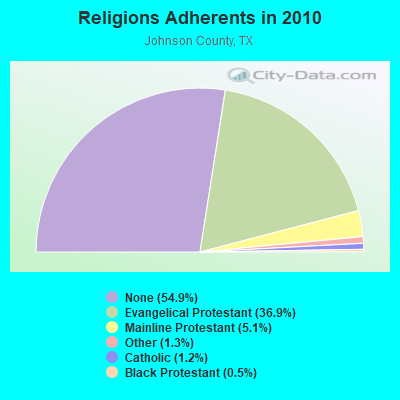
| Religion | Adherents | Congregations |
|---|---|---|
| Evangelical Protestant | 55,674 | 163 |
| Mainline Protestant | 7,711 | 18 |
| Other | 2,014 | 6 |
| Catholic | 1,878 | 1 |
| Black Protestant | 823 | 6 |
| None | 82,834 | - |
Food Environment Statistics:
| Johnson County: | 1.00 / 10,000 pop. |
| Texas: | 1.47 / 10,000 pop. |
| Johnson County: | 0.13 / 10,000 pop. |
| Texas: | 0.14 / 10,000 pop. |
| Johnson County: | 0.47 / 10,000 pop. |
| Texas: | 1.11 / 10,000 pop. |
| This county: | 3.68 / 10,000 pop. |
| State: | 3.95 / 10,000 pop. |
| Johnson County: | 3.82 / 10,000 pop. |
| State: | 6.13 / 10,000 pop. |
| Here: | 9.4% |
| State: | 8.9% |
| This county: | 28.7% |
| Texas: | 26.6% |
| Here: | 13.7% |
| Texas: | 15.7% |
Health and Nutrition:
| Here: | 47.4% |
| Texas: | 48.6% |
| Cleburne: | 43.8% |
| Texas: | 47.4% |
| Here: | 28.7 |
| Texas: | 28.5 |
| This city: | 22.0% |
| State: | 20.6% |
| Here: | 11.2% |
| Texas: | 10.3% |
| Here: | 6.8 |
| Texas: | 6.8 |
| Cleburne: | 32.9% |
| State: | 33.1% |
| Cleburne: | 54.1% |
| State: | 56.2% |
| This city: | 78.1% |
| Texas: | 80.7% |
More about Health and Nutrition of Cleburne, TX Residents
| Local government employment and payroll (March 2022) | |||||
| Function | Full-time employees | Monthly full-time payroll | Average yearly full-time wage | Part-time employees | Monthly part-time payroll |
|---|---|---|---|---|---|
| Firefighters | 63 | $449,833 | $85,682 | 0 | $0 |
| Police Protection - Officers | 51 | $340,977 | $80,230 | 0 | $0 |
| Parks and Recreation | 33 | $119,439 | $43,432 | 40 | $21,458 |
| Water Supply | 28 | $103,629 | $44,412 | 0 | $0 |
| Sewerage | 21 | $98,132 | $56,075 | 0 | $0 |
| Other Government Administration | 17 | $122,320 | $86,344 | 0 | $0 |
| Police - Other | 16 | $62,104 | $46,578 | 0 | $0 |
| Welfare | 14 | $48,295 | $41,396 | 6 | $12,009 |
| Streets and Highways | 14 | $60,291 | $51,678 | 0 | $0 |
| Other and Unallocable | 13 | $50,476 | $46,593 | 0 | $0 |
| Solid Waste Management | 12 | $49,488 | $49,488 | 0 | $0 |
| Financial Administration | 11 | $77,157 | $84,171 | 0 | $0 |
| Health | 6 | $22,899 | $45,798 | 0 | $0 |
| Housing and Community Development (Local) | 6 | $29,421 | $58,842 | 0 | $0 |
| Local Libraries | 6 | $24,423 | $48,846 | 2 | $3,058 |
| Judicial and Legal | 4 | $14,958 | $44,874 | 0 | $0 |
| Fire - Other | 3 | $12,264 | $49,056 | 0 | $0 |
| Airports | 3 | $13,228 | $52,912 | 1 | $1,850 |
| Gas Supply | 2 | $10,808 | $64,848 | 0 | $0 |
| Natural Resources | 1 | $3,134 | $37,608 | 0 | $0 |
| Totals for Government | 324 | $1,713,277 | $63,455 | 49 | $38,375 |
Cleburne government finances - Expenditure in 2017 (per resident):
- Construction - Parks and Recreation: $14,121,000 ($417.46)
Water Utilities: $2,729,000 ($80.68)
Regular Highways: $1,519,000 ($44.91)
Sewerage: $299,000 ($8.84)
Air Transportation: $184,000 ($5.44)
Central Staff Services: $137,000 ($4.05)
Libraries: $31,000 ($0.92)
- Current Operations - Police Protection: $7,403,000 ($218.86)
Local Fire Protection: $6,844,000 ($202.33)
Water Utilities: $5,247,000 ($155.12)
Central Staff Services: $4,164,000 ($123.10)
Parks and Recreation: $3,946,000 ($116.66)
Solid Waste Management: $3,153,000 ($93.21)
Sewerage: $2,814,000 ($83.19)
General - Other: $1,129,000 ($33.38)
Regular Highways: $1,065,000 ($31.48)
Air Transportation: $932,000 ($27.55)
Financial Administration: $704,000 ($20.81)
Protective Inspection and Regulation - Other: $667,000 ($19.72)
General Public Buildings: $516,000 ($15.25)
Libraries: $486,000 ($14.37)
Judicial and Legal Services: $456,000 ($13.48)
Health - Other: $371,000 ($10.97)
Miscellaneous Commercial Activities - Other: $273,000 ($8.07)
- Other Capital Outlay - Sewerage: $695,000 ($20.55)
General - Other: $498,000 ($14.72)
Solid Waste Management: $286,000 ($8.46)
Parks and Recreation: $277,000 ($8.19)
Police Protection: $196,000 ($5.79)
Water Utilities: $122,000 ($3.61)
Local Fire Protection: $94,000 ($2.78)
Regular Highways: $54,000 ($1.60)
General Public Building: $33,000 ($0.98)
Miscellaneous Commercial Activities - Other: $18,000 ($0.53)
Central Staff Services: $7,000 ($0.21)
Health - Other: $6,000 ($0.18)
- Total Salaries and Wages: $18,726,000 ($553.60)
- Water Utilities - Interest on Debt: $2,084,000 ($61.61)
Cleburne government finances - Revenue in 2017 (per resident):
- Charges - Sewerage: $8,335,000 ($246.41)
Solid Waste Management: $4,547,000 ($134.42)
Miscellaneous Commercial Activities: $1,812,000 ($53.57)
Other: $1,181,000 ($34.91)
Parks and Recreation: $1,137,000 ($33.61)
Air Transportation: $795,000 ($23.50)
- Federal Intergovernmental - Housing and Community Development: $1,246,000 ($36.84)
Public Welfare: $2,000 ($0.06)
- Local Intergovernmental - Transit Utilities: $282,000 ($8.34)
Public Welfare: $87,000 ($2.57)
Other: $25,000 ($0.74)
- Miscellaneous - Fines and Forfeits: $829,000 ($24.51)
Royalties: $375,000 ($11.09)
Interest Earnings: $348,000 ($10.29)
Donations From Private Sources: $191,000 ($5.65)
Sale of Property: $1,000 ($0.03)
- Revenue - Water Utilities: $13,659,000 ($403.80)
Transit Utilities: $90,000 ($2.66)
- State Intergovernmental - Transit Utilities: $706,000 ($20.87)
Public Welfare: $137,000 ($4.05)
General Local Government Support: $45,000 ($1.33)
Other: $42,000 ($1.24)
- Tax - Property: $15,538,000 ($459.35)
General Sales and Gross Receipts: $9,224,000 ($272.69)
Public Utilities Sales: $3,289,000 ($97.23)
Occupation and Business License - Other: $1,067,000 ($31.54)
Other Selective Sales: $420,000 ($12.42)
Cleburne government finances - Debt in 2017 (per resident):
- Long Term Debt - Outstanding Unspecified Public Purpose: $132,851,000 ($3927.48)
Beginning Outstanding - Unspecified Public Purpose: $106,499,000 ($3148.44)
Beginning Outstanding - Public Debt for Private Purpose: $36,575,000 ($1081.27)
Issue, Unspecified Public Purpose: $35,469,000 ($1048.57)
Outstanding Nonguaranteed - Industrial Revenue: $34,665,000 ($1024.80)
Retired Unspecified Public Purpose: $9,117,000 ($269.53)
Retired Nonguaranteed - Public Debt for Private Purpose: $1,910,000 ($56.47)
- Short Term Debt Outstanding - End of Fiscal Year: $5,238,000 ($154.85)
Beginning: $4,040,000 ($119.43)
Cleburne government finances - Cash and Securities in 2017 (per resident):
- Bond Funds - Cash and Securities: $15,474,000 ($457.46)
- Other Funds - Cash and Securities: $67,867,000 ($2006.36)
- Sinking Funds - Cash and Securities: $37,464,000 ($1107.55)
| Businesses in Cleburne, TX | ||||
| Name | Count | Name | Count | |
|---|---|---|---|---|
| AT&T | 1 | KFC | 1 | |
| Albertsons | 1 | Kroger | 1 | |
| Applebee's | 1 | La Quinta | 1 | |
| Arby's | 1 | Little Caesars Pizza | 1 | |
| AutoZone | 1 | Long John Silver's | 1 | |
| Best Western | 1 | Lowe's | 1 | |
| Blockbuster | 1 | MasterBrand Cabinets | 2 | |
| Burger King | 1 | McDonald's | 3 | |
| CVS | 1 | Motel 6 | 1 | |
| Church's Chicken | 1 | Nike | 5 | |
| Cinnabon | 1 | Payless | 1 | |
| Comfort Inn | 1 | Pizza Hut | 1 | |
| DHL | 1 | RadioShack | 1 | |
| Days Inn | 1 | SONIC Drive-In | 2 | |
| Discount Tire | 1 | Sears | 1 | |
| Domino's Pizza | 1 | Staples | 1 | |
| FedEx | 5 | Starbucks | 1 | |
| Ford | 1 | Subway | 1 | |
| GNC | 1 | T-Mobile | 2 | |
| GameStop | 1 | Taco Bell | 2 | |
| Goodwill | 1 | True Value | 1 | |
| H&R Block | 2 | U-Haul | 5 | |
| Hilton | 1 | UPS | 4 | |
| Holiday Inn | 1 | Walgreens | 1 | |
| Home Depot | 1 | Walmart | 1 | |
| Jack In The Box | 2 | Wendy's | 1 | |
Strongest AM radio stations in Cleburne:
- WBAP (820 AM; 50 kW; FORT WORTH, TX; Owner: WBAP-KSCS OPERATING, LTD.)
- KESS (1270 AM; 50 kW; FORT WORTH, TX; Owner: KESS-AM LICENSE CORP.)
- KAHZ (1360 AM; 50 kW; HURST, TX)
- KCLE (1140 AM; 1 kW; CLEBURNE, TX; Owner: DALLAS AM RADIO PARTNERS, L.P.)
- KZMP (1540 AM; 50 kW; UNIVERSITY PARK, TX; Owner: ENTRAVISION HOLDINGS, LLC)
- KRLD (1080 AM; 50 kW; DALLAS, TX; Owner: TEXAS INFINITY BROADCASTING L.P.)
- KSKY (660 AM; 20 kW; BALCH SPRINGS, TX; Owner: BISON MEDIA, INC.)
- KHVN (970 AM; 10 kW; FORT WORTH, TX; Owner: MORTENSON BROADCASTING COMPANY)
- KBIS (1150 AM; 25 kW; HIGHLAND PARK, TX; Owner: DALLAS AM RADIO PARTNERS, L.P.)
- KFXR (1190 AM; 50 kW; DALLAS, TX; Owner: CLEAR CHANNEL BROADCASTING LICENSES, INC.)
- KNAX (1630 AM; 10 kW; FT. WORTH, TX; Owner: MORTENSON BROADCASTING COMPANY)
- KLIF (570 AM; 5 kW; DALLAS, TX; Owner: KLIF LICO, INC.)
- KTCK (1310 AM; 9 kW; DALLAS, TX; Owner: KRBE LICO, INC.)
Strongest FM radio stations in Cleburne:
- KJCR (88.3 FM; KEENE, TX; Owner: SOUTHWESTERN ADVENTIST COLLEGE)
- KRBV (100.3 FM; DALLAS, TX; Owner: INFINITY BROADCASTING CORP. OF FORT WORTH)
- KLLI (105.3 FM; DALLAS, TX; Owner: INFINITY BROADCASTING CORPORATION OF DALLAS)
- KKDA-FM (104.5 FM; DALLAS, TX; Owner: SERVICE BROADCASTING I, LTD.)
- KZPS (92.5 FM; DALLAS, TX; Owner: AMFM TEXAS LICENSES LIMITED PARTNERSHIP)
- KHKS (106.1 FM; DENTON, TX; Owner: AMFM TEXAS LICENSES LIMITED PARTNERSHIP)
- KVIL-FM (103.7 FM; HIGHLAND PARK-DALLAS, TX; Owner: INFINITY BROADCASTING CORPORATION OF TEXAS)
- KOAI (107.5 FM; FORT WORTH, TX; Owner: INFINITY KOAI-FM, INC.)
- KEGL (97.1 FM; FORT WORTH, TX; Owner: CITICASTERS LICENSES, L.P.)
- KBFB (97.9 FM; DALLAS, TX; Owner: RADIO ONE LICENSES, LLC)
- KSCS (96.3 FM; FORT WORTH, TX; Owner: WBAP-KSCS OPERATING, LTD.)
- KLNO (94.1 FM; FORT WORTH, TX; Owner: HBC LICENSE CORPORATION)
- KCBI (90.9 FM; DALLAS, TX; Owner: CRISWELL CENTER FOR BIBLICAL STUDIES)
- KDGE (102.1 FM; FORT WORTH-DALLAS, TX; Owner: CAPSTAR TX LIMITED PARTNERSHIP)
- KDMX (102.9 FM; DALLAS, TX; Owner: CITICASTERS LICENSES, L.P.)
- KDXX (107.1 FM; BENBROOK, TX; Owner: KCYT-FM LICENSE CORP.)
- KERA (90.1 FM; DALLAS, TX; Owner: NORTH TEXAS PUBLIC BROADCASTING, INC.)
- KVTT (91.7 FM; DALLAS, TX; Owner: RESEARCH EDUCATIONAL FOUNDATION, INC)
- KLUV-FM (98.7 FM; DALLAS, TX; Owner: INFINITY BROADCASTING CORPORATION OF DALLAS)
- KTFW-FM (92.1 FM; GLEN ROSE, TX; Owner: M&M BROADCASTERS, LTD.)
TV broadcast stations around Cleburne:
- KFWD (Channel 52; FORT WORTH, TX; Owner: HIC BROADCAST, INC.)
- KTVT (Channel 11; FORT WORTH, TX; Owner: CBS STATIONS GROUP OF TEXAS L.P.)
- KXAS-TV (Channel 5; FORT WORTH, TX; Owner: STATION VENTURE OPERATIONS, LP)
- KDTN (Channel 2; DENTON, TX; Owner: NORTH TEXAS PUBLIC BROADCASTING, INC.)
- KDAF (Channel 33; DALLAS, TX; Owner: TRIBUNE TELEVISION COMPANY)
- KDFI (Channel 27; DALLAS, TX; Owner: NEW DMIC, INC.)
- KSTR-TV (Channel 49; IRVING, TX; Owner: TELEFUTURA DALLAS LLC)
- KPXD (Channel 68; ARLINGTON, TX; Owner: PAXSON DALLAS LICENSE, INC.)
- KUVN (Channel 23; GARLAND, TX; Owner: KUVN LICENSE PARTNERSHIP, L.P.)
- KMPX (Channel 29; DECATUR, TX; Owner: WORD OF GOD FELLOWSHIP, INC.)
- KTXA (Channel 21; FORT WORTH, TX; Owner: VIACOM TELEVISION STATIONS GROUP OF DALLAS/FORT WORTH L.P.)
- KGSW-LP (Channel 46; KEENE, TX; Owner: SOUTHWESTERN ADVENTIST UNIVERSITY)
- WFAA-TV (Channel 8; DALLAS, TX; Owner: WFAA-TV, L.P.)
- KDFW (Channel 4; DALLAS, TX; Owner: KDFW LICENSE, INC.)
- KERA-TV (Channel 13; DALLAS, TX; Owner: NORTH TEXAS PUBLIC BROADCASTING, INC.)
- KXTX-TV (Channel 39; DALLAS, TX; Owner: TELEMUNDO OF TEXAS PARTNERSHIP, LP)
- KDTX-TV (Channel 58; DALLAS, TX; Owner: TRINITY BROADCASTING OF TEXAS, INC.)
- K26HF (Channel 26; BRITTON, TX; Owner: MAKO COMMUNICATIONS, LLC)
- KHPK-LP (Channel 28; DE SOTO, TX; Owner: MAKO COMMUNICATIONS, LLC)
- KATA-LP (Channel 60; MESQUITE, TX; Owner: JANE McGINNIS)
- K25FW (Channel 25; CORSICANA, TX; Owner: VENTANA TELEVISION, INC.)
- KLDT (Channel 55; LAKE DALLAS, TX; Owner: JOHNSON BROADCASTING OF DALLAS, INC.)
- KVFW-LP (Channel 65; FORT WORTH, TX; Owner: GERALD BENAVIDES)
- KSEX-LP (Channel 57; DALLAS, TX; Owner: COMMERCIAL BROADCASTING CORP.)
- KUVN-CA (Channel 31; FORT WORTH, TX; Owner: KUVN LICENSE PARTNERSHIP, L.P.)
- National Bridge Inventory (NBI) Statistics
- 132Number of bridges
- 2,339ft / 713mTotal length
- $1,509,000Total costs
- 1,024,886Total average daily traffic
- 123,543Total average daily truck traffic
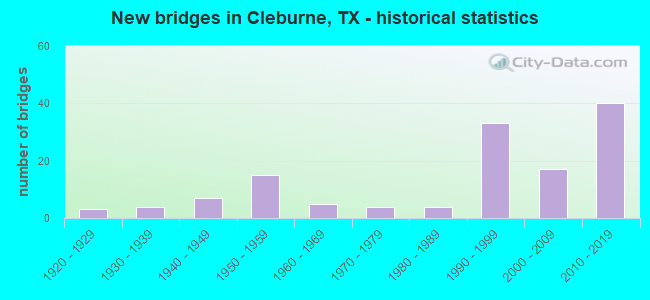
- New bridges - historical statistics
- 31920-1929
- 41930-1939
- 71940-1949
- 151950-1959
- 51960-1969
- 41970-1979
- 41980-1989
- 331990-1999
- 172000-2009
- 402010-2019
FCC Registered Antenna Towers: 272 (See the full list of FCC Registered Antenna Towers)
FCC Registered Commercial Land Mobile Towers: 2 (See the full list of FCC Registered Commercial Land Mobile Towers in Cleburne, TX)
FCC Registered Private Land Mobile Towers: 5 (See the full list of FCC Registered Private Land Mobile Towers)
FCC Registered Broadcast Land Mobile Towers: 38 (See the full list of FCC Registered Broadcast Land Mobile Towers)
FCC Registered Microwave Towers: 94 (See the full list of FCC Registered Microwave Towers in this town)
FCC Registered Paging Towers: 8 (See the full list of FCC Registered Paging Towers)
FCC Registered Maritime Coast & Aviation Ground Towers: 3 (See the full list of FCC Registered Maritime Coast & Aviation Ground Towers)
FCC Registered Amateur Radio Licenses: 372 (See the full list of FCC Registered Amateur Radio Licenses in Cleburne)
FAA Registered Aircraft Manufacturers and Dealers: 3 (See the full list of FAA Registered Manufacturers and Dealers in Cleburne)
FAA Registered Aircraft: 63 (See the full list of FAA Registered Aircraft)
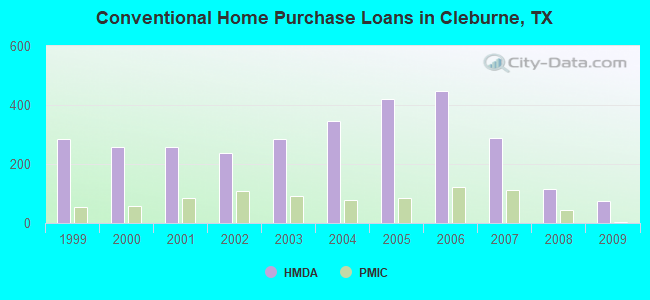
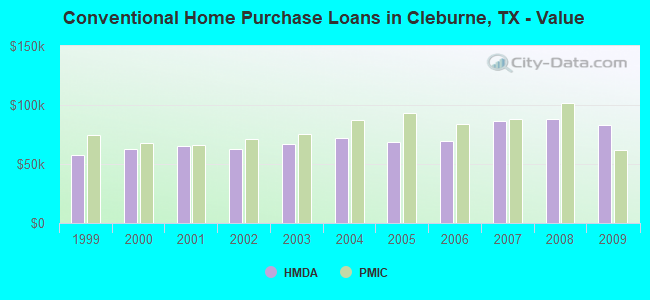
| Home Mortgage Disclosure Act Aggregated Statistics For Year 2009 (Based on 4 full and 3 partial tracts) | ||||||||||||||
| A) FHA, FSA/RHS & VA Home Purchase Loans | B) Conventional Home Purchase Loans | C) Refinancings | D) Home Improvement Loans | E) Loans on Dwellings For 5+ Families | F) Non-occupant Loans on < 5 Family Dwellings (A B C & D) | G) Loans On Manufactured Home Dwelling (A B C & D) | ||||||||
|---|---|---|---|---|---|---|---|---|---|---|---|---|---|---|
| Number | Average Value | Number | Average Value | Number | Average Value | Number | Average Value | Number | Average Value | Number | Average Value | Number | Average Value | |
| LOANS ORIGINATED | 98 | $102,760 | 74 | $82,674 | 158 | $107,047 | 43 | $21,568 | 1 | $6,086,160 | 55 | $52,545 | 2 | $76,470 |
| APPLICATIONS APPROVED, NOT ACCEPTED | 4 | $87,028 | 2 | $92,070 | 13 | $97,384 | 2 | $15,935 | 0 | $0 | 0 | $0 | 0 | $0 |
| APPLICATIONS DENIED | 27 | $93,369 | 18 | $138,859 | 72 | $92,921 | 35 | $25,366 | 0 | $0 | 11 | $43,316 | 2 | $52,805 |
| APPLICATIONS WITHDRAWN | 24 | $84,420 | 16 | $96,782 | 49 | $99,460 | 7 | $27,056 | 0 | $0 | 4 | $52,172 | 1 | $87,000 |
| FILES CLOSED FOR INCOMPLETENESS | 2 | $85,460 | 3 | $47,497 | 9 | $130,571 | 3 | $65,600 | 0 | $0 | 0 | $0 | 0 | $0 |
Detailed HMDA statistics for the following Tracts: 1303.01 , 1303.02, 1307.00, 1308.00, 1309.00, 1310.00, 1311.00
| Private Mortgage Insurance Companies Aggregated Statistics For Year 2009 (Based on 4 full and 3 partial tracts) | ||||||
| A) Conventional Home Purchase Loans | B) Refinancings | C) Non-occupant Loans on < 5 Family Dwellings (A & B) | ||||
|---|---|---|---|---|---|---|
| Number | Average Value | Number | Average Value | Number | Average Value | |
| LOANS ORIGINATED | 3 | $62,213 | 6 | $159,575 | 0 | $0 |
| APPLICATIONS APPROVED, NOT ACCEPTED | 1 | $91,130 | 1 | $79,500 | 0 | $0 |
| APPLICATIONS DENIED | 3 | $54,930 | 0 | $0 | 1 | $34,790 |
| APPLICATIONS WITHDRAWN | 1 | $65,000 | 1 | $122,000 | 0 | $0 |
| FILES CLOSED FOR INCOMPLETENESS | 2 | $211,500 | 0 | $0 | 0 | $0 |
Detailed PMIC statistics for the following Tracts: 1303.01 , 1303.02, 1307.00, 1308.00, 1309.00, 1310.00, 1311.00
2002 - 2018 National Fire Incident Reporting System (NFIRS) incidents
- Fire incident types reported to NFIRS in Cleburne, TX
- 2,61855.1%Outside Fires
- 1,30427.5%Structure Fires
- 56311.9%Mobile Property/Vehicle Fires
- 2645.6%Other
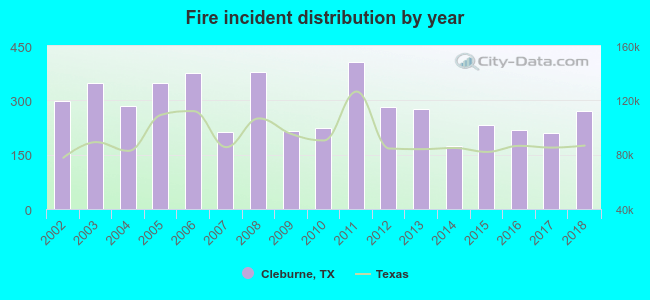 Based on the data from the years 2002 - 2018 the average number of fire incidents per year is 279. The highest number of fire incidents - 406 took place in 2011, and the least - 175 in 2014. The data has a decreasing trend.
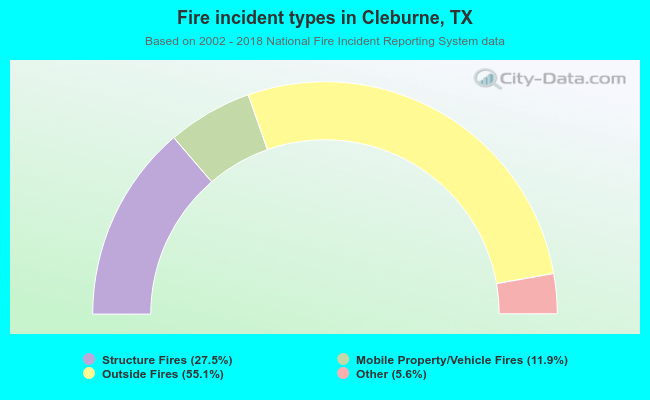 When looking into fire subcategories, the most reports belonged to: Outside Fires (55.1%), and Structure Fires (27.5%).
Fire-safe hotels and motels in Cleburne, Texas:
- Days Inn & Suites, 2005 N Main St, Cleburne, Texas 76033 , Phone: (817) 645-8953, Fax: (817) 645-8958
- Americas Best Value Inn, 101 N Ridgeway Dr, Cleburne, Texas 76033 , Phone: (817) 645-8836, Fax: (817) 645-4813
- Holiday Inn Express Hotel & Suites Cleburne, 1800 W Henderson, Cleburne, Texas 76033 , Phone: (800) 465-4329, Fax: (817) 357-8500
- La Quinta Inn & Suites, 107 E Kilpatrick Ave, Cleburne, Texas 76033 , Phone: (817) 641-4455, Fax: (817) 202-8617
- Liberty Hotel, 205 S Caddo St, Cleburne, Texas 76031 , Phone: (817) 645-5660, Fax: (817) 645-5655
- Hampton Inn And Suites Cleburne, 1996 W Henderson St, Cleburne, Texas 76033 , Phone: (817) 641-7770, Fax: (817) 641-7773
- Econo Lodge, 2110 Katherine P Raines, Cleburne, Texas 76033 , Phone: (817) 774-2452, Fax: (817) 774-2463
| Most common first names in Cleburne, TX among deceased individuals | ||
| Name | Count | Lived (average) |
|---|---|---|
| James | 232 | 74.4 years |
| John | 224 | 75.8 years |
| William | 212 | 76.7 years |
| Mary | 212 | 79.9 years |
| Robert | 158 | 72.5 years |
| George | 111 | 76.8 years |
| Willie | 82 | 78.5 years |
| Charles | 77 | 71.1 years |
| Ruby | 76 | 80.2 years |
| Thomas | 62 | 73.7 years |
| Most common last names in Cleburne, TX among deceased individuals | ||
| Last name | Count | Lived (average) |
|---|---|---|
| Smith | 116 | 76.2 years |
| Jones | 97 | 77.6 years |
| Johnson | 84 | 76.9 years |
| Williams | 81 | 73.5 years |
| Moore | 73 | 75.8 years |
| Davis | 65 | 76.6 years |
| Brown | 65 | 76.0 years |
| Walker | 53 | 77.2 years |
| White | 52 | 76.2 years |
| Miller | 47 | 77.7 years |
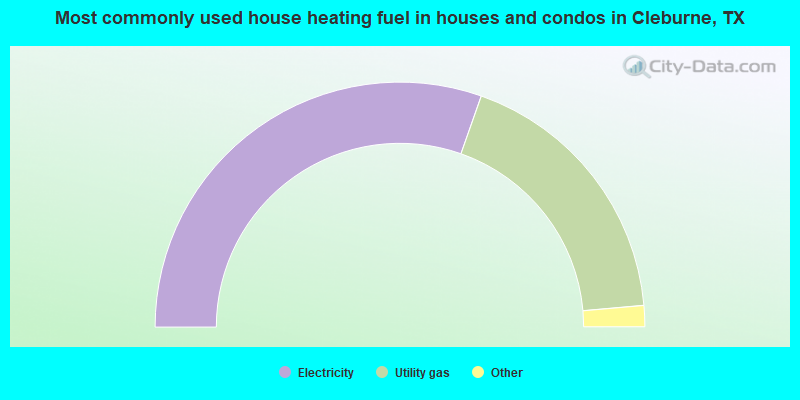
- 60.8%Electricity
- 36.4%Utility gas
- 1.1%Bottled, tank, or LP gas
- 0.7%No fuel used
- 0.6%Solar energy
- 0.3%Wood
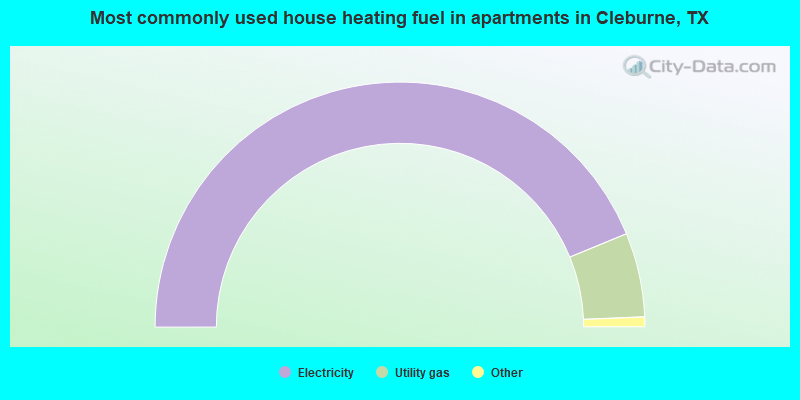
- 87.6%Electricity
- 11.1%Utility gas
- 1.1%No fuel used
- 0.2%Bottled, tank, or LP gas
Cleburne compared to Texas state average:
- Unemployed percentage below state average.
- Foreign-born population percentage below state average.
- Length of stay since moving in significantly above state average.
- Number of college students below state average.
Cleburne on our top lists:
- #88 on the list of "Top 101 cities with the most residents born in Oceania, n.e.c. (population 500+)"
- #22 on the list of "Top 101 counties with highest percentage of residents voting for Romney (Republican) in the 2012 Presidential Election (pop. 50,000+)"

|
|
Total of 48 patent applications in 2008-2024.