Flossmoor, Illinois Submit your own pictures of this village and show them to the world
OSM Map
General Map
Google Map
MSN Map
OSM Map
General Map
Google Map
MSN Map
OSM Map
General Map
Google Map
MSN Map
OSM Map
General Map
Google Map
MSN Map
Please wait while loading the map...
Population in 2022: 9,339 (100% urban, 0% rural). Population change since 2000: +0.4%Males: 4,398 Females: 4,941
March 2022 cost of living index in Flossmoor: 102.5 (near average, U.S. average is 100) Percentage of residents living in poverty in 2022: 3.7%for White Non-Hispanic residents , 1.8% for Black residents , 7.3% for Hispanic or Latino residents , 5.9% for two or more races residents )
Profiles of local businesses
Business Search - 14 Million verified businesses
Data:
Median household income ($)
Median household income (% change since 2000)
Household income diversity
Ratio of average income to average house value (%)
Ratio of average income to average rent
Median household income ($) - White
Median household income ($) - Black or African American
Median household income ($) - Asian
Median household income ($) - Hispanic or Latino
Median household income ($) - American Indian and Alaska Native
Median household income ($) - Multirace
Median household income ($) - Other Race
Median household income for houses/condos with a mortgage ($)
Median household income for apartments without a mortgage ($)
Races - White alone (%)
Races - White alone (% change since 2000)
Races - Black alone (%)
Races - Black alone (% change since 2000)
Races - American Indian alone (%)
Races - American Indian alone (% change since 2000)
Races - Asian alone (%)
Races - Asian alone (% change since 2000)
Races - Hispanic (%)
Races - Hispanic (% change since 2000)
Races - Native Hawaiian and Other Pacific Islander alone (%)
Races - Native Hawaiian and Other Pacific Islander alone (% change since 2000)
Races - Two or more races (%)
Races - Two or more races (% change since 2000)
Races - Other race alone (%)
Races - Other race alone (% change since 2000)
Racial diversity
Unemployment (%)
Unemployment (% change since 2000)
Unemployment (%) - White
Unemployment (%) - Black or African American
Unemployment (%) - Asian
Unemployment (%) - Hispanic or Latino
Unemployment (%) - American Indian and Alaska Native
Unemployment (%) - Multirace
Unemployment (%) - Other Race
Population density (people per square mile)
Population - Males (%)
Population - Females (%)
Population - Males (%) - White
Population - Males (%) - Black or African American
Population - Males (%) - Asian
Population - Males (%) - Hispanic or Latino
Population - Males (%) - American Indian and Alaska Native
Population - Males (%) - Multirace
Population - Males (%) - Other Race
Population - Females (%) - White
Population - Females (%) - Black or African American
Population - Females (%) - Asian
Population - Females (%) - Hispanic or Latino
Population - Females (%) - American Indian and Alaska Native
Population - Females (%) - Multirace
Population - Females (%) - Other Race
Coronavirus confirmed cases (Jun 10, 2024)
Deaths caused by coronavirus (Jun 10, 2024)
Coronavirus confirmed cases (per 100k population) (Jun 10, 2024)
Deaths caused by coronavirus (per 100k population) (Jun 10, 2024)
Daily increase in number of cases (Jun 10, 2024)
Weekly increase in number of cases (Jun 10, 2024)
Cases doubled (in days) (Jun 10, 2024)
Hospitalized patients (Apr 18, 2022)
Negative test results (Apr 18, 2022)
Total test results (Apr 18, 2022)
COVID Vaccine doses distributed (per 100k population) (Sep 19, 2023)
COVID Vaccine doses administered (per 100k population) (Sep 19, 2023)
COVID Vaccine doses distributed (Sep 19, 2023)
COVID Vaccine doses administered (Sep 19, 2023)
Likely homosexual households (%)
Likely homosexual households (% change since 2000)
Likely homosexual households - Lesbian couples (%)
Likely homosexual households - Lesbian couples (% change since 2000)
Likely homosexual households - Gay men (%)
Likely homosexual households - Gay men (% change since 2000)
Cost of living index
Median gross rent ($)
Median contract rent ($)
Median monthly housing costs ($)
Median house or condo value ($)
Median house or condo value ($ change since 2000)
Mean house or condo value by units in structure - 1, detached ($)
Mean house or condo value by units in structure - 1, attached ($)
Mean house or condo value by units in structure - 2 ($)
Mean house or condo value by units in structure by units in structure - 3 or 4 ($)
Mean house or condo value by units in structure - 5 or more ($)
Mean house or condo value by units in structure - Boat, RV, van, etc. ($)
Mean house or condo value by units in structure - Mobile home ($)
Median house or condo value ($) - White
Median house or condo value ($) - Black or African American
Median house or condo value ($) - Asian
Median house or condo value ($) - Hispanic or Latino
Median house or condo value ($) - American Indian and Alaska Native
Median house or condo value ($) - Multirace
Median house or condo value ($) - Other Race
Median resident age
Resident age diversity
Median resident age - Males
Median resident age - Females
Median resident age - White
Median resident age - Black or African American
Median resident age - Asian
Median resident age - Hispanic or Latino
Median resident age - American Indian and Alaska Native
Median resident age - Multirace
Median resident age - Other Race
Median resident age - Males - White
Median resident age - Males - Black or African American
Median resident age - Males - Asian
Median resident age - Males - Hispanic or Latino
Median resident age - Males - American Indian and Alaska Native
Median resident age - Males - Multirace
Median resident age - Males - Other Race
Median resident age - Females - White
Median resident age - Females - Black or African American
Median resident age - Females - Asian
Median resident age - Females - Hispanic or Latino
Median resident age - Females - American Indian and Alaska Native
Median resident age - Females - Multirace
Median resident age - Females - Other Race
Commute - mean travel time to work (minutes)
Travel time to work - Less than 5 minutes (%)
Travel time to work - Less than 5 minutes (% change since 2000)
Travel time to work - 5 to 9 minutes (%)
Travel time to work - 5 to 9 minutes (% change since 2000)
Travel time to work - 10 to 19 minutes (%)
Travel time to work - 10 to 19 minutes (% change since 2000)
Travel time to work - 20 to 29 minutes (%)
Travel time to work - 20 to 29 minutes (% change since 2000)
Travel time to work - 30 to 39 minutes (%)
Travel time to work - 30 to 39 minutes (% change since 2000)
Travel time to work - 40 to 59 minutes (%)
Travel time to work - 40 to 59 minutes (% change since 2000)
Travel time to work - 60 to 89 minutes (%)
Travel time to work - 60 to 89 minutes (% change since 2000)
Travel time to work - 90 or more minutes (%)
Travel time to work - 90 or more minutes (% change since 2000)
Marital status - Never married (%)
Marital status - Now married (%)
Marital status - Separated (%)
Marital status - Widowed (%)
Marital status - Divorced (%)
Median family income ($)
Median family income (% change since 2000)
Median non-family income ($)
Median non-family income (% change since 2000)
Median per capita income ($)
Median per capita income (% change since 2000)
Median family income ($) - White
Median family income ($) - Black or African American
Median family income ($) - Asian
Median family income ($) - Hispanic or Latino
Median family income ($) - American Indian and Alaska Native
Median family income ($) - Multirace
Median family income ($) - Other Race
Median year house/condo built
Median year apartment built
Year house built - Built 2005 or later (%)
Year house built - Built 2000 to 2004 (%)
Year house built - Built 1990 to 1999 (%)
Year house built - Built 1980 to 1989 (%)
Year house built - Built 1970 to 1979 (%)
Year house built - Built 1960 to 1969 (%)
Year house built - Built 1950 to 1959 (%)
Year house built - Built 1940 to 1949 (%)
Year house built - Built 1939 or earlier (%)
Average household size
Household density (households per square mile)
Average household size - White
Average household size - Black or African American
Average household size - Asian
Average household size - Hispanic or Latino
Average household size - American Indian and Alaska Native
Average household size - Multirace
Average household size - Other Race
Occupied housing units (%)
Vacant housing units (%)
Owner occupied housing units (%)
Renter occupied housing units (%)
Vacancy status - For rent (%)
Vacancy status - For sale only (%)
Vacancy status - Rented or sold, not occupied (%)
Vacancy status - For seasonal, recreational, or occasional use (%)
Vacancy status - For migrant workers (%)
Vacancy status - Other vacant (%)
Residents with income below the poverty level (%)
Residents with income below 50% of the poverty level (%)
Children below poverty level (%)
Poor families by family type - Married-couple family (%)
Poor families by family type - Male, no wife present (%)
Poor families by family type - Female, no husband present (%)
Poverty status for native-born residents (%)
Poverty status for foreign-born residents (%)
Poverty among high school graduates not in families (%)
Poverty among people who did not graduate high school not in families (%)
Residents with income below the poverty level (%) - White
Residents with income below the poverty level (%) - Black or African American
Residents with income below the poverty level (%) - Asian
Residents with income below the poverty level (%) - Hispanic or Latino
Residents with income below the poverty level (%) - American Indian and Alaska Native
Residents with income below the poverty level (%) - Multirace
Residents with income below the poverty level (%) - Other Race
Air pollution - Air Quality Index (AQI)
Air pollution - CO
Air pollution - NO2
Air pollution - SO2
Air pollution - Ozone
Air pollution - PM10
Air pollution - PM25
Air pollution - Pb
Crime - Murders per 100,000 population
Crime - Rapes per 100,000 population
Crime - Robberies per 100,000 population
Crime - Assaults per 100,000 population
Crime - Burglaries per 100,000 population
Crime - Thefts per 100,000 population
Crime - Auto thefts per 100,000 population
Crime - Arson per 100,000 population
Crime - City-data.com crime index
Crime - Violent crime index
Crime - Property crime index
Crime - Murders per 100,000 population (5 year average)
Crime - Rapes per 100,000 population (5 year average)
Crime - Robberies per 100,000 population (5 year average)
Crime - Assaults per 100,000 population (5 year average)
Crime - Burglaries per 100,000 population (5 year average)
Crime - Thefts per 100,000 population (5 year average)
Crime - Auto thefts per 100,000 population (5 year average)
Crime - Arson per 100,000 population (5 year average)
Crime - City-data.com crime index (5 year average)
Crime - Violent crime index (5 year average)
Crime - Property crime index (5 year average)
1996 Presidential Elections Results (%) - Democratic Party (Clinton)
1996 Presidential Elections Results (%) - Republican Party (Dole)
1996 Presidential Elections Results (%) - Other
2000 Presidential Elections Results (%) - Democratic Party (Gore)
2000 Presidential Elections Results (%) - Republican Party (Bush)
2000 Presidential Elections Results (%) - Other
2004 Presidential Elections Results (%) - Democratic Party (Kerry)
2004 Presidential Elections Results (%) - Republican Party (Bush)
2004 Presidential Elections Results (%) - Other
2008 Presidential Elections Results (%) - Democratic Party (Obama)
2008 Presidential Elections Results (%) - Republican Party (McCain)
2008 Presidential Elections Results (%) - Other
2012 Presidential Elections Results (%) - Democratic Party (Obama)
2012 Presidential Elections Results (%) - Republican Party (Romney)
2012 Presidential Elections Results (%) - Other
2016 Presidential Elections Results (%) - Democratic Party (Clinton)
2016 Presidential Elections Results (%) - Republican Party (Trump)
2016 Presidential Elections Results (%) - Other
2020 Presidential Elections Results (%) - Democratic Party (Biden)
2020 Presidential Elections Results (%) - Republican Party (Trump)
2020 Presidential Elections Results (%) - Other
Ancestries Reported - Arab (%)
Ancestries Reported - Czech (%)
Ancestries Reported - Danish (%)
Ancestries Reported - Dutch (%)
Ancestries Reported - English (%)
Ancestries Reported - French (%)
Ancestries Reported - French Canadian (%)
Ancestries Reported - German (%)
Ancestries Reported - Greek (%)
Ancestries Reported - Hungarian (%)
Ancestries Reported - Irish (%)
Ancestries Reported - Italian (%)
Ancestries Reported - Lithuanian (%)
Ancestries Reported - Norwegian (%)
Ancestries Reported - Polish (%)
Ancestries Reported - Portuguese (%)
Ancestries Reported - Russian (%)
Ancestries Reported - Scotch-Irish (%)
Ancestries Reported - Scottish (%)
Ancestries Reported - Slovak (%)
Ancestries Reported - Subsaharan African (%)
Ancestries Reported - Swedish (%)
Ancestries Reported - Swiss (%)
Ancestries Reported - Ukrainian (%)
Ancestries Reported - United States (%)
Ancestries Reported - Welsh (%)
Ancestries Reported - West Indian (%)
Ancestries Reported - Other (%)
Educational Attainment - No schooling completed (%)
Educational Attainment - Less than high school (%)
Educational Attainment - High school or equivalent (%)
Educational Attainment - Less than 1 year of college (%)
Educational Attainment - 1 or more years of college (%)
Educational Attainment - Associate degree (%)
Educational Attainment - Bachelor's degree (%)
Educational Attainment - Master's degree (%)
Educational Attainment - Professional school degree (%)
Educational Attainment - Doctorate degree (%)
School Enrollment - Nursery, preschool (%)
School Enrollment - Kindergarten (%)
School Enrollment - Grade 1 to 4 (%)
School Enrollment - Grade 5 to 8 (%)
School Enrollment - Grade 9 to 12 (%)
School Enrollment - College undergrad (%)
School Enrollment - Graduate or professional (%)
School Enrollment - Not enrolled in school (%)
School enrollment - Public schools (%)
School enrollment - Private schools (%)
School enrollment - Not enrolled (%)
Median number of rooms in houses and condos
Median number of rooms in apartments
Housing units lacking complete plumbing facilities (%)
Housing units lacking complete kitchen facilities (%)
Density of houses
Urban houses (%)
Rural houses (%)
Households with people 60 years and over (%)
Households with people 65 years and over (%)
Households with people 75 years and over (%)
Households with one or more nonrelatives (%)
Households with no nonrelatives (%)
Population in households (%)
Family households (%)
Nonfamily households (%)
Population in families (%)
Family households with own children (%)
Median number of bedrooms in owner occupied houses
Mean number of bedrooms in owner occupied houses
Median number of bedrooms in renter occupied houses
Mean number of bedrooms in renter occupied houses
Median number of vehichles in owner occupied houses
Mean number of vehichles in owner occupied houses
Median number of vehichles in renter occupied houses
Mean number of vehichles in renter occupied houses
Mortgage status - with mortgage (%)
Mortgage status - with second mortgage (%)
Mortgage status - with home equity loan (%)
Mortgage status - with both second mortgage and home equity loan (%)
Mortgage status - without a mortgage (%)
Average family size
Average family size - White
Average family size - Black or African American
Average family size - Asian
Average family size - Hispanic or Latino
Average family size - American Indian and Alaska Native
Average family size - Multirace
Average family size - Other Race
Geographical mobility - Same house 1 year ago (%)
Geographical mobility - Moved within same county (%)
Geographical mobility - Moved from different county within same state (%)
Geographical mobility - Moved from different state (%)
Geographical mobility - Moved from abroad (%)
Place of birth - Born in state of residence (%)
Place of birth - Born in other state (%)
Place of birth - Native, outside of US (%)
Place of birth - Foreign born (%)
Housing units in structures - 1, detached (%)
Housing units in structures - 1, attached (%)
Housing units in structures - 2 (%)
Housing units in structures - 3 or 4 (%)
Housing units in structures - 5 to 9 (%)
Housing units in structures - 10 to 19 (%)
Housing units in structures - 20 to 49 (%)
Housing units in structures - 50 or more (%)
Housing units in structures - Mobile home (%)
Housing units in structures - Boat, RV, van, etc. (%)
House/condo owner moved in on average (years ago)
Renter moved in on average (years ago)
Year householder moved into unit - Moved in 1999 to March 2000 (%)
Year householder moved into unit - Moved in 1995 to 1998 (%)
Year householder moved into unit - Moved in 1990 to 1994 (%)
Year householder moved into unit - Moved in 1980 to 1989 (%)
Year householder moved into unit - Moved in 1970 to 1979 (%)
Year householder moved into unit - Moved in 1969 or earlier (%)
Means of transportation to work - Drove car alone (%)
Means of transportation to work - Carpooled (%)
Means of transportation to work - Public transportation (%)
Means of transportation to work - Bus or trolley bus (%)
Means of transportation to work - Streetcar or trolley car (%)
Means of transportation to work - Subway or elevated (%)
Means of transportation to work - Railroad (%)
Means of transportation to work - Ferryboat (%)
Means of transportation to work - Taxicab (%)
Means of transportation to work - Motorcycle (%)
Means of transportation to work - Bicycle (%)
Means of transportation to work - Walked (%)
Means of transportation to work - Other means (%)
Working at home (%)
Industry diversity
Most Common Industries - Agriculture, forestry, fishing and hunting, and mining (%)
Most Common Industries - Agriculture, forestry, fishing and hunting (%)
Most Common Industries - Mining, quarrying, and oil and gas extraction (%)
Most Common Industries - Construction (%)
Most Common Industries - Manufacturing (%)
Most Common Industries - Wholesale trade (%)
Most Common Industries - Retail trade (%)
Most Common Industries - Transportation and warehousing, and utilities (%)
Most Common Industries - Transportation and warehousing (%)
Most Common Industries - Utilities (%)
Most Common Industries - Information (%)
Most Common Industries - Finance and insurance, and real estate and rental and leasing (%)
Most Common Industries - Finance and insurance (%)
Most Common Industries - Real estate and rental and leasing (%)
Most Common Industries - Professional, scientific, and management, and administrative and waste management services (%)
Most Common Industries - Professional, scientific, and technical services (%)
Most Common Industries - Management of companies and enterprises (%)
Most Common Industries - Administrative and support and waste management services (%)
Most Common Industries - Educational services, and health care and social assistance (%)
Most Common Industries - Educational services (%)
Most Common Industries - Health care and social assistance (%)
Most Common Industries - Arts, entertainment, and recreation, and accommodation and food services (%)
Most Common Industries - Arts, entertainment, and recreation (%)
Most Common Industries - Accommodation and food services (%)
Most Common Industries - Other services, except public administration (%)
Most Common Industries - Public administration (%)
Occupation diversity
Most Common Occupations - Management, business, science, and arts occupations (%)
Most Common Occupations - Management, business, and financial occupations (%)
Most Common Occupations - Management occupations (%)
Most Common Occupations - Business and financial operations occupations (%)
Most Common Occupations - Computer, engineering, and science occupations (%)
Most Common Occupations - Computer and mathematical occupations (%)
Most Common Occupations - Architecture and engineering occupations (%)
Most Common Occupations - Life, physical, and social science occupations (%)
Most Common Occupations - Education, legal, community service, arts, and media occupations (%)
Most Common Occupations - Community and social service occupations (%)
Most Common Occupations - Legal occupations (%)
Most Common Occupations - Education, training, and library occupations (%)
Most Common Occupations - Arts, design, entertainment, sports, and media occupations (%)
Most Common Occupations - Healthcare practitioners and technical occupations (%)
Most Common Occupations - Health diagnosing and treating practitioners and other technical occupations (%)
Most Common Occupations - Health technologists and technicians (%)
Most Common Occupations - Service occupations (%)
Most Common Occupations - Healthcare support occupations (%)
Most Common Occupations - Protective service occupations (%)
Most Common Occupations - Fire fighting and prevention, and other protective service workers including supervisors (%)
Most Common Occupations - Law enforcement workers including supervisors (%)
Most Common Occupations - Food preparation and serving related occupations (%)
Most Common Occupations - Building and grounds cleaning and maintenance occupations (%)
Most Common Occupations - Personal care and service occupations (%)
Most Common Occupations - Sales and office occupations (%)
Most Common Occupations - Sales and related occupations (%)
Most Common Occupations - Office and administrative support occupations (%)
Most Common Occupations - Natural resources, construction, and maintenance occupations (%)
Most Common Occupations - Farming, fishing, and forestry occupations (%)
Most Common Occupations - Construction and extraction occupations (%)
Most Common Occupations - Installation, maintenance, and repair occupations (%)
Most Common Occupations - Production, transportation, and material moving occupations (%)
Most Common Occupations - Production occupations (%)
Most Common Occupations - Transportation occupations (%)
Most Common Occupations - Material moving occupations (%)
People in Group quarters - Institutionalized population (%)
People in Group quarters - Correctional institutions (%)
People in Group quarters - Federal prisons and detention centers (%)
People in Group quarters - Halfway houses (%)
People in Group quarters - Local jails and other confinement facilities (including police lockups) (%)
People in Group quarters - Military disciplinary barracks (%)
People in Group quarters - State prisons (%)
People in Group quarters - Other types of correctional institutions (%)
People in Group quarters - Nursing homes (%)
People in Group quarters - Hospitals/wards, hospices, and schools for the handicapped (%)
People in Group quarters - Hospitals/wards and hospices for chronically ill (%)
People in Group quarters - Hospices or homes for chronically ill (%)
People in Group quarters - Military hospitals or wards for chronically ill (%)
People in Group quarters - Other hospitals or wards for chronically ill (%)
People in Group quarters - Hospitals or wards for drug/alcohol abuse (%)
People in Group quarters - Mental (Psychiatric) hospitals or wards (%)
People in Group quarters - Schools, hospitals, or wards for the mentally retarded (%)
People in Group quarters - Schools, hospitals, or wards for the physically handicapped (%)
People in Group quarters - Institutions for the deaf (%)
People in Group quarters - Institutions for the blind (%)
People in Group quarters - Orthopedic wards and institutions for the physically handicapped (%)
People in Group quarters - Wards in general hospitals for patients who have no usual home elsewhere (%)
People in Group quarters - Wards in military hospitals for patients who have no usual home elsewhere (%)
People in Group quarters - Juvenile institutions (%)
People in Group quarters - Long-term care (%)
People in Group quarters - Homes for abused, dependent, and neglected children (%)
People in Group quarters - Residential treatment centers for emotionally disturbed children (%)
People in Group quarters - Training schools for juvenile delinquents (%)
People in Group quarters - Short-term care, detention or diagnostic centers for delinquent children (%)
People in Group quarters - Type of juvenile institution unknown (%)
People in Group quarters - Noninstitutionalized population (%)
People in Group quarters - College dormitories (includes college quarters off campus) (%)
People in Group quarters - Military quarters (%)
People in Group quarters - On base (%)
People in Group quarters - Barracks, unaccompanied personnel housing (UPH), (Enlisted/Officer), ;and similar group living quarters for military personnel (%)
People in Group quarters - Transient quarters for temporary residents (%)
People in Group quarters - Military ships (%)
People in Group quarters - Group homes (%)
People in Group quarters - Homes or halfway houses for drug/alcohol abuse (%)
People in Group quarters - Homes for the mentally ill (%)
People in Group quarters - Homes for the mentally retarded (%)
People in Group quarters - Homes for the physically handicapped (%)
People in Group quarters - Other group homes (%)
People in Group quarters - Religious group quarters (%)
People in Group quarters - Dormitories (%)
People in Group quarters - Agriculture workers' dormitories on farms (%)
People in Group quarters - Job Corps and vocational training facilities (%)
People in Group quarters - Other workers' dormitories (%)
People in Group quarters - Crews of maritime vessels (%)
People in Group quarters - Other nonhousehold living situations (%)
People in Group quarters - Other noninstitutional group quarters (%)
Residents speaking English at home (%)
Residents speaking English at home - Born in the United States (%)
Residents speaking English at home - Native, born elsewhere (%)
Residents speaking English at home - Foreign born (%)
Residents speaking Spanish at home (%)
Residents speaking Spanish at home - Born in the United States (%)
Residents speaking Spanish at home - Native, born elsewhere (%)
Residents speaking Spanish at home - Foreign born (%)
Residents speaking other language at home (%)
Residents speaking other language at home - Born in the United States (%)
Residents speaking other language at home - Native, born elsewhere (%)
Residents speaking other language at home - Foreign born (%)
Class of Workers - Employee of private company (%)
Class of Workers - Self-employed in own incorporated business (%)
Class of Workers - Private not-for-profit wage and salary workers (%)
Class of Workers - Local government workers (%)
Class of Workers - State government workers (%)
Class of Workers - Federal government workers (%)
Class of Workers - Self-employed workers in own not incorporated business and Unpaid family workers (%)
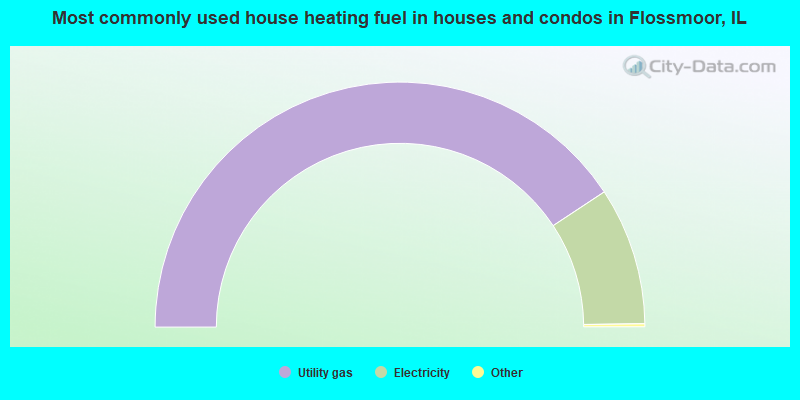
House heating fuel used in houses and condos - Utility gas (%)
House heating fuel used in houses and condos - Bottled, tank, or LP gas (%)
House heating fuel used in houses and condos - Electricity (%)
House heating fuel used in houses and condos - Fuel oil, kerosene, etc. (%)
House heating fuel used in houses and condos - Coal or coke (%)
House heating fuel used in houses and condos - Wood (%)
House heating fuel used in houses and condos - Solar energy (%)
House heating fuel used in houses and condos - Other fuel (%)
House heating fuel used in houses and condos - No fuel used (%)
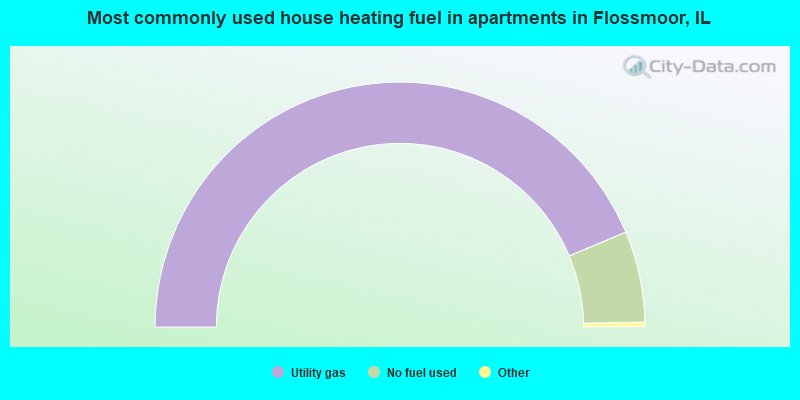
House heating fuel used in apartments - Utility gas (%)
House heating fuel used in apartments - Bottled, tank, or LP gas (%)
House heating fuel used in apartments - Electricity (%)
House heating fuel used in apartments - Fuel oil, kerosene, etc. (%)
House heating fuel used in apartments - Coal or coke (%)
House heating fuel used in apartments - Wood (%)
House heating fuel used in apartments - Solar energy (%)
House heating fuel used in apartments - Other fuel (%)
House heating fuel used in apartments - No fuel used (%)
Armed forces status - In Armed Forces (%)
Armed forces status - Civilian (%)
Armed forces status - Civilian - Veteran (%)
Armed forces status - Civilian - Nonveteran (%)
Fatal accidents locations in years 2005-2021
Fatal accidents locations in 2005
Fatal accidents locations in 2006
Fatal accidents locations in 2007
Fatal accidents locations in 2008
Fatal accidents locations in 2009
Fatal accidents locations in 2010
Fatal accidents locations in 2011
Fatal accidents locations in 2012
Fatal accidents locations in 2013
Fatal accidents locations in 2014
Fatal accidents locations in 2015
Fatal accidents locations in 2016
Fatal accidents locations in 2017
Fatal accidents locations in 2018
Fatal accidents locations in 2019
Fatal accidents locations in 2020
Fatal accidents locations in 2021
Alcohol use - People drinking some alcohol every month (%)
Alcohol use - People not drinking at all (%)
Alcohol use - Average days/month drinking alcohol
Alcohol use - Average drinks/week
Alcohol use - Average days/year people drink much
Audiometry - Average condition of hearing (%)
Audiometry - People that can hear a whisper from across a quiet room (%)
Audiometry - People that can hear normal voice from across a quiet room (%)
Audiometry - Ears ringing, roaring, buzzing (%)
Audiometry - Had a job exposure to loud noise (%)
Audiometry - Had off-work exposure to loud noise (%)
Blood Pressure & Cholesterol - Has high blood pressure (%)
Blood Pressure & Cholesterol - Checking blood pressure at home (%)
Blood Pressure & Cholesterol - Frequently checking blood cholesterol (%)
Blood Pressure & Cholesterol - Has high cholesterol level (%)
Consumer Behavior - Money monthly spent on food at supermarket/grocery store
Consumer Behavior - Money monthly spent on food at other stores
Consumer Behavior - Money monthly spent on eating out
Consumer Behavior - Money monthly spent on carryout/delivered foods
Consumer Behavior - Income spent on food at supermarket/grocery store (%)
Consumer Behavior - Income spent on food at other stores (%)
Consumer Behavior - Income spent on eating out (%)
Consumer Behavior - Income spent on carryout/delivered foods (%)
Current Health Status - General health condition (%)
Current Health Status - Blood donors (%)
Current Health Status - Has blood ever tested for HIV virus (%)
Current Health Status - Left-handed people (%)
Dermatology - People using sunscreen (%)
Diabetes - Diabetics (%)
Diabetes - Had a blood test for high blood sugar (%)
Diabetes - People taking insulin (%)
Diet Behavior & Nutrition - Diet health (%)
Diet Behavior & Nutrition - Milk product consumption (# of products/month)
Diet Behavior & Nutrition - Meals not home prepared (#/week)
Diet Behavior & Nutrition - Meals from fast food or pizza place (#/week)
Diet Behavior & Nutrition - Ready-to-eat foods (#/month)
Diet Behavior & Nutrition - Frozen meals/pizza (#/month)
Drug Use - People that ever used marijuana or hashish (%)
Drug Use - Ever used hard drugs (%)
Drug Use - Ever used any form of cocaine (%)
Drug Use - Ever used heroin (%)
Drug Use - Ever used methamphetamine (%)
Health Insurance - People covered by health insurance (%)
Kidney Conditions-Urology - Avg. # of times urinating at night
Medical Conditions - People with asthma (%)
Medical Conditions - People with anemia (%)
Medical Conditions - People with psoriasis (%)
Medical Conditions - People with overweight (%)
Medical Conditions - Elderly people having difficulties in thinking or remembering (%)
Medical Conditions - People who ever received blood transfusion (%)
Medical Conditions - People having trouble seeing even with glass/contacts (%)
Medical Conditions - People with arthritis (%)
Medical Conditions - People with gout (%)
Medical Conditions - People with congestive heart failure (%)
Medical Conditions - People with coronary heart disease (%)
Medical Conditions - People with angina pectoris (%)
Medical Conditions - People who ever had heart attack (%)
Medical Conditions - People who ever had stroke (%)
Medical Conditions - People with emphysema (%)
Medical Conditions - People with thyroid problem (%)
Medical Conditions - People with chronic bronchitis (%)
Medical Conditions - People with any liver condition (%)
Medical Conditions - People who ever had cancer or malignancy (%)
Mental Health - People who have little interest in doing things (%)
Mental Health - People feeling down, depressed, or hopeless (%)
Mental Health - People who have trouble sleeping or sleeping too much (%)
Mental Health - People feeling tired or having little energy (%)
Mental Health - People with poor appetite or overeating (%)
Mental Health - People feeling bad about themself (%)
Mental Health - People who have trouble concentrating on things (%)
Mental Health - People moving or speaking slowly or too fast (%)
Mental Health - People having thoughts they would be better off dead (%)
Oral Health - Average years since last visit a dentist
Oral Health - People embarrassed because of mouth (%)
Oral Health - People with gum disease (%)
Oral Health - General health of teeth and gums (%)
Oral Health - Average days a week using dental floss/device
Oral Health - Average days a week using mouthwash for dental problem
Oral Health - Average number of teeth
Pesticide Use - Households using pesticides to control insects (%)
Pesticide Use - Households using pesticides to kill weeds (%)
Physical Activity - People doing vigorous-intensity work activities (%)
Physical Activity - People doing moderate-intensity work activities (%)
Physical Activity - People walking or bicycling (%)
Physical Activity - People doing vigorous-intensity recreational activities (%)
Physical Activity - People doing moderate-intensity recreational activities (%)
Physical Activity - Average hours a day doing sedentary activities
Physical Activity - Average hours a day watching TV or videos
Physical Activity - Average hours a day using computer
Physical Functioning - People having limitations keeping them from working (%)
Physical Functioning - People limited in amount of work they can do (%)
Physical Functioning - People that need special equipment to walk (%)
Physical Functioning - People experiencing confusion/memory problems (%)
Physical Functioning - People requiring special healthcare equipment (%)
Prescription Medications - Average number of prescription medicines taking
Preventive Aspirin Use - Adults 40+ taking low-dose aspirin (%)
Reproductive Health - Vaginal deliveries (%)
Reproductive Health - Cesarean deliveries (%)
Reproductive Health - Deliveries resulted in a live birth (%)
Reproductive Health - Pregnancies resulted in a delivery (%)
Reproductive Health - Women breastfeeding newborns (%)
Reproductive Health - Women that had a hysterectomy (%)
Reproductive Health - Women that had both ovaries removed (%)
Reproductive Health - Women that have ever taken birth control pills (%)
Reproductive Health - Women taking birth control pills (%)
Reproductive Health - Women that have ever used Depo-Provera or injectables (%)
Reproductive Health - Women that have ever used female hormones (%)
Sexual Behavior - People 18+ that ever had sex (vaginal, anal, or oral) (%)
Sexual Behavior - Males 18+ that ever had vaginal sex with a woman (%)
Sexual Behavior - Males 18+ that ever performed oral sex on a woman (%)
Sexual Behavior - Males 18+ that ever had anal sex with a woman (%)
Sexual Behavior - Males 18+ that ever had any sex with a man (%)
Sexual Behavior - Females 18+ that ever had vaginal sex with a man (%)
Sexual Behavior - Females 18+ that ever performed oral sex on a man (%)
Sexual Behavior - Females 18+ that ever had anal sex with a man (%)
Sexual Behavior - Females 18+ that ever had any kind of sex with a woman (%)
Sexual Behavior - Average age people first had sex
Sexual Behavior - Average number of female sex partners in lifetime (males 18+)
Sexual Behavior - Average number of female vaginal sex partners in lifetime (males 18+)
Sexual Behavior - Average age people first performed oral sex on a woman (18+)
Sexual Behavior - Average number of woman performed oral sex on in lifetime (18+)
Sexual Behavior - Average number of male sex partners in lifetime (males 18+)
Sexual Behavior - Average number of male anal sex partners in lifetime (males 18+)
Sexual Behavior - Average age people first performed oral sex on a man (18+)
Sexual Behavior - Average number of male oral sex partners in lifetime (18+)
Sexual Behavior - People using protection when performing oral sex (%)
Sexual Behavior - Average number of times people have vaginal or anal sex a year
Sexual Behavior - People having sex without condom (%)
Sexual Behavior - Average number of male sex partners in lifetime (females 18+)
Sexual Behavior - Average number of male vaginal sex partners in lifetime (females 18+)
Sexual Behavior - Average number of female sex partners in lifetime (females 18+)
Sexual Behavior - Circumcised males 18+ (%)
Sleep Disorders - Average hours sleeping at night
Sleep Disorders - People that has trouble sleeping (%)
Smoking-Cigarette Use - People smoking cigarettes (%)
Taste & Smell - People 40+ having problems with smell (%)
Taste & Smell - People 40+ having problems with taste (%)
Taste & Smell - People 40+ that ever had wisdom teeth removed (%)
Taste & Smell - People 40+ that ever had tonsils teeth removed (%)
Taste & Smell - People 40+ that ever had a loss of consciousness because of a head injury (%)
Taste & Smell - People 40+ that ever had a broken nose or other serious injury to face or skull (%)
Taste & Smell - People 40+ that ever had two or more sinus infections (%)
Weight - Average height (inches)
Weight - Average weight (pounds)
Weight - Average BMI
Weight - People that are obese (%)
Weight - People that ever were obese (%)
Weight - People trying to lose weight (%)
According to our research of Illinois and other state lists, there were 2 registered sex offenders living in Flossmoor, Illinois as of June 10, 2024 . The ratio of all residents to sex offenders in Flossmoor is 4,586 to 1.The ratio of registered sex offenders to all residents in this city is much lower than the state average.
Officers per 1,000 residents here:
2.23Illinois average:
2.84
Latest news from Flossmoor, IL collected exclusively by city-data.com from local newspapers, TV, and radio stations
Ancestries: American (8.8%), African (6.0%), Turkish (3.5%), Italian (2.9%), Irish (2.4%), German (2.1%).
Current Local Time:
Incorporated on 08/19/1924
Land area: 3.55 square miles.
Population density: 2,628 people per square mile (average).
527 residents are foreign born (3.0% Asia , 1.1% Africa , 0.9% Europe ).
This village:
5.7%Illinois:
14.1%
Median real estate property taxes paid for housing units with mortgages in 2022: $9,512 (3.2%)Median real estate property taxes paid for housing units with no mortgage in 2022: $9,819 (3.2%)
Nearest city with pop. 50,000+: Orland Park, IL
Nearest city with pop. 200,000+: Chicago, IL
Nearest cities:
Latitude: 41.54 N, Longitude: 87.68 W
Daytime population change due to commuting: -1,493 (-16.2%)Workers who live and work in this village: 1,291 (29.8%)
Area code commonly used in this area: 708
Single-family new house construction building permits:
2022: 3 buildings , average cost: $487,6002020: 1 building , cost: $331,1002018: 2 buildings , average cost: $400,0002017: 1 building , cost: $250,0002016: 2 buildings , average cost: $105,0002013: 2 buildings , average cost: $362,5002008: 4 buildings , average cost: $600,0002007: 11 buildings , average cost: $552,9002006: 17 buildings , average cost: $474,3002005: 39 buildings , average cost: $415,1002004: 44 buildings , average cost: $373,8002003: 36 buildings , average cost: $252,1002002: 41 buildings , average cost: $184,7002001: 28 buildings , average cost: $238,8002000: 41 buildings , average cost: $266,0001999: 22 buildings , average cost: $276,5001998: 35 buildings , average cost: $190,7001997: 58 buildings , average cost: $180,700Unemployment in December 2023:
Population change in the 1990s: +457 (+5.2%).
Most common occupations in Flossmoor, IL (%)
Both Males Females
Other management occupations, except farmers and farm managers (7.2%)
Lawyers (5.7%)
Preschool, kindergarten, elementary, and middle school teachers (5.1%)
Sales representatives, services, wholesale and manufacturing (4.5%)
Other sales and related occupations, including supervisors (4.2%)
Computer specialists (3.9%)
Top executives (3.8%)
Lawyers (8.8%)
Other management occupations, except farmers and farm managers (8.6%)
Sales representatives, services, wholesale and manufacturing (6.4%)
Top executives (6.1%)
Computer specialists (5.0%)
Physicians and surgeons (4.8%)
Other financial specialists (3.5%)
Preschool, kindergarten, elementary, and middle school teachers (9.5%)
Secretaries and administrative assistants (7.4%)
Other management occupations, except farmers and farm managers (5.6%)
Other sales and related occupations, including supervisors (5.4%)
Registered nurses (5.0%)
Health technologists and technicians (4.2%)
Retail sales workers, except cashiers (4.1%)
Tornado activity:
Flossmoor-area historical tornado activity is near Illinois state average. It is 61% greater than the overall U.S. average.
On 8/28/1990, a category F5 (max. wind speeds 261-318 mph) tornado 21.5 miles away from the Flossmoor village center killed 29 people and injured 350 people and caused between $50,000 and $500,000 in damages.
On 4/21/1967, a category F4 (max. wind speeds 207-260 mph) tornado 11.6 miles away from the village center killed 33 people and injured 500 people and caused between $5,000,000 and $50,000,000 in damages.
Earthquake activity:
Flossmoor-area historical earthquake activity is significantly above Illinois state average. It is 46% greater than the overall U.S. average. On 4/18/2008 at 09:36:59, a magnitude 5.4 (5.1 MB, 4.8 MS, 5.4 MW, 5.2 MW, Class: Moderate, Intensity: VI - VII) earthquake occurred 214.0 miles away from the city center On 6/10/1987 at 23:48:54, a magnitude 5.1 (4.9 MB, 4.4 MS, 4.6 MS, 5.1 LG) earthquake occurred 188.5 miles away from the city center On 4/18/2008 at 09:36:59, a magnitude 5.2 (5.2 MW, Depth: 8.9 mi) earthquake occurred 214.0 miles away from Flossmoor center On 6/28/2004 at 06:10:52, a magnitude 4.2 (4.2 MW, Depth: 6.2 mi, Class: Light, Intensity: IV - V) earthquake occurred 63.2 miles away from Flossmoor center On 6/18/2002 at 17:37:15, a magnitude 5.0 (4.3 MB, 4.6 MW, 5.0 LG) earthquake occurred 245.9 miles away from Flossmoor center On 4/18/2008 at 15:14:16, a magnitude 4.8 (4.5 MB, 4.8 MW, 4.6 MW) earthquake occurred 212.2 miles away from the city center Magnitude types: regional Lg-wave magnitude (LG), body-wave magnitude (MB), surface-wave magnitude (MS), moment magnitude (MW) Natural disasters: The number of natural disasters in Cook County (20) is greater than the US average (15).Major Disasters (Presidential) Declared: 15Emergencies Declared: 4Floods: 13, Storms: 12, Tornadoes: 3, Snowstorms: 2, Winter Storms: 2, Blizzard: 1, Hurricane: 1, Snow: 1, Wind: 1, Other: 1 (Note: some incidents may be assigned to more than one category). Hospitals and medical centers in Flossmoor: FLOSSMOOR TERRACE (3951 WEST 190TH STREET) AWAKENED ALTERNATIVES INC. (3235 VOLLMER ROAD, STE 200)
HOME BOUND HEALTHCARE, INC (1615 VOLLMER ROAD)
KELLY HOME HEALTHCARE, INC (3235 VOLLMER ROAD SUITE 107)
TOTAL HEALTH HOME CARE SERVICES, INC (19150 S KEDZIE AVE, SUITE 202)
V N A HOME HEALTH OF ILLINOIS, LTD (19740 GOVERNORS HIGHWAY SUITE 120)
Amtrak stations near Flossmoor: 2 miles: HOMEWOOD (181 1ST ST. & PARK AVE.) Services: ticket office, enclosed waiting area, public restrooms, public payphones, paid short-term parking, paid long-term parking, public transit connection.
10 miles: DYER (SHEFFIELD RD.) Services: enclosed waiting area, public payphones, free short-term parking, free long-term parking.
14 miles: HAMMOND-WHITING (HAMMOND, 1135 CALUMET AVE.) Services: ticket office, partially wheelchair accessible, enclosed waiting area, public restrooms, public payphones, free short-term parking, free long-term parking, call for taxi service.
Colleges/universities with over 2000 students nearest to Flossmoor:
Prairie State College (about 3 miles; Chicago Heights, IL ; Full-time enrollment: 4,050)
South Suburban College (about 6 miles; South Holland, IL ; FT enrollment: 3,972)
Governors State University (about 7 miles; University Park, IL ; FT enrollment: 4,043)
Purdue University-Calumet Campus (about 12 miles; Hammond, IN ; FT enrollment: 7,343)
Saint Xavier University (about 12 miles; Chicago, IL ; FT enrollment: 3,576)
City Colleges of Chicago-Olive-Harvey College (about 13 miles; Chicago, IL ; FT enrollment: 4,110)
Chicago State University (about 13 miles; Chicago, IL ; FT enrollment: 4,352)
Public high school in Flossmoor:
Public elementary/middle schools in Flossmoor:
Private elementary/middle schools in Flossmoor: INFANT JESUS OF PRAGUE SCHOOL Students: 442, Location: 1101 DOUGLAS AVE, Grades: PK-8)
FLOSSMOOR MONTESSORI SCHOOL Students: 79, Location: 740 WESTERN AVE, Grades: PK-3)
See full list of schools located in Flossmoor Library in Flossmoor: FLOSSMOOR PUBLIC LIBRARY Operating income: $1,317,005; Location: 1000 STERLING AVENUE; 67,822 books ; 5,247 audio materials ; 2,200 video materials ; 3 local licensed databases ; 18 state licensed databases ; 2 other licensed databases ; 180 print serial subscriptions ; 3 electronic serial subscriptions )
Notable locations in Flossmoor: (A) , Flossmoor Fire Department (B) . Display/hide their locations on the map
Shopping Center: (1) . Display/hide its location on the map
Churches in Flossmoor include: (A) , Calvary Association Temple of God (B) , Infant Jesus of Prague Church (C) , Bethel Evangelical Lutheran Church (D) . Display/hide their locations on the map
Parks in Flossmoor include: (1) , Flossmoor Park (2) , Leavitt Avenue Park (3) , Highland Park (4) , Pheasant Trails Park (5) , Irons Oak Park (6) , Maynegaite Park (7) . Display/hide their locations on the map
Hotel:
Cook County has a predicted average indoor radon screening level between 2 and 4 pCi/L (pico curies per liter) - Moderate Potential Drinking water stations with addresses in Flossmoor and their reported violations in the past:
LAKEVIEW MOBILE HOME ESTATES (Serves MI, Population served: 50, Groundwater):
Past health violations:
MCL, Monthly (TCR) - In JUN-2012, Contaminant: Coliform. Follow-up actions: St Public Notif received (JUL-10-2012), St Violation/Reminder Notice (JUL-10-2012), St Public Notif issued (JUL-10-2012), St Compliance achieved (JUL-10-2012), St Tech Assistance Visit (3 times from JUL-10-2012 to AUG-13-2012)
Average household size: This village:
2.7 peopleIllinois:
2.6 people
Percentage of family households: This village:
77.5%Whole state:
65.8%
Percentage of households with unmarried partners: This village:
2.7%Whole state:
6.3%
Likely homosexual households (counted as self-reported same-sex unmarried-partner households)
Lesbian couples: 0.3% of all households Gay men: 0.3% of all households
People in group quarters in Flossmoor in 2010:
12 people in emergency and transitional shelters (with sleeping facilities) for people experiencing homelessness
4 people in group homes intended for adults
3 people in other noninstitutional facilities
Banks with branches in Flossmoor (2011 data):
BMO Harris Bank National Association: Flossmoor Branch at 2602 Flossmoor Road, branch established on 2003/09/30. Info updated 2011/07/14: Bank assets: $97,264.0 mil, Deposits: $75,624.6 mil, headquarters in Chicago, IL, positive income , 717 total offices , Holding Company: Bank Of Montreal
Great Lakes Bank, National Association: Flossmoor Drive-Up Facility at 19601 Governors Highway, branch established on 1979/12/17. Info updated 2007/12/05: Bank assets: $627.2 mil, Deposits: $501.8 mil, headquarters in Blue Island, IL, positive income , Commercial Lending Specialization, 8 total offices , Holding Company: Great Lakes Financial Resources, Inc. Employee Stock Ownership Plan
U.S. Bank National Association: Flossmoor Branch at 2743 Flossmoor Road, branch established on 1987/06/30. Info updated 2012/01/30: Bank assets: $330,470.8 mil, Deposits: $236,091.5 mil, headquarters in Cincinnati, OH, positive income , 3121 total offices , Holding Company: U.S. Bancorp
Citizens Financial Bank: Flossmoor Branch at 3301 Vollmer Road, branch established on 1911/01/01. Info updated 2011/07/21: Bank assets: $1,149.8 mil, Deposits: $986.7 mil, headquarters in Munster, IN, negative income in the last year , Commercial Lending Specialization, 22 total offices
For population 15 years and over in Flossmoor:
Never married: 28.1%Now married: 58.7%Separated: 1.6%Widowed: 4.6%Divorced: 7.0% For population 25 years and over in Flossmoor:
High school or higher: 98.5%Bachelor's degree or higher: 65.3%Graduate or professional degree: 36.8%Unemployed: 3.7%Mean travel time to work (commute): 27.2 minutes
Education Gini index (Inequality in education) Here:
9.6Illinois average:
12.5
Religion statistics for Flossmoor, IL (based on Cook County data)
Religion Adherents Congregations Catholic 1,947,223 376 Evangelical Protestant 432,975 1,484 Other 312,636 403 Mainline Protestant 202,114 630 Black Protestant 148,895 395 Orthodox 53,276 66 None 2,097,556 -
Source: Clifford Grammich, Kirk Hadaway, Richard Houseal, Dale E.Jones, Alexei Krindatch, Richie Stanley and Richard H.Taylor. 2012. 2010 U.S.Religion Census: Religious Congregations & Membership Study. Association of Statisticians of American Religious Bodies. Jones, Dale E., et al. 2002. Congregations and Membership in the United States 2000. Nashville, TN: Glenmary Research Center. Graphs represent county-level data
Food Environment Statistics: Number of grocery stores : 1,460This county :
2.77 / 10,000 pop.Illinois :
2.24 / 10,000 pop.
Number of supercenters and club stores : 23Cook County :
0.04 / 10,000 pop.Illinois :
0.08 / 10,000 pop.
Number of convenience stores (no gas) : 490This county :
0.93 / 10,000 pop.Illinois :
0.75 / 10,000 pop.
Number of convenience stores (with gas) : 806Cook County :
1.53 / 10,000 pop.State :
2.61 / 10,000 pop.
Number of full-service restaurants : 3,516Here :
6.67 / 10,000 pop.State :
6.86 / 10,000 pop.
Adult diabetes rate : This county :
8.4%State :
8.3%
Low-income preschool obesity rate : Health and Nutrition: Healthy diet rate : Flossmoor:
54.8%Illinois:
49.5%
Average overall health of teeth and gums : Flossmoor:
53.6%Illinois:
47.2%
Average BMI : Flossmoor:
28.7Illinois:
28.6
People feeling badly about themselves : Flossmoor:
17.3%State:
20.5%
People not drinking alcohol at all : Flossmoor:
10.2%Illinois:
10.8%
Average hours sleeping at night : This city:
6.8Illinois:
6.8
Overweight people : Flossmoor:
37.4%State:
33.4%
General health condition : Flossmoor:
59.8%Illinois:
56.4%
Average condition of hearing : This city:
80.4%Illinois:
79.9%
More about Health and Nutrition of Flossmoor, IL Residents
Local government employment and payroll (March 2022)
Function
Full-time employees
Monthly full-time payroll
Average yearly full-time wage
Part-time employees
Monthly part-time payroll
Police Protection - Officers
19 $175,239 $110,677 0 $0 Streets and Highways
11 $83,113 $90,669 0 $0 Financial Administration
6 $43,957 $87,914 0 $0 Other Government Administration
6 $52,495 $104,990 1 $338 Police - Other
5 $28,482 $68,357 14 $14,092 Firefighters
4 $46,758 $140,274 23 $34,921 Natural Resources
1 $7,213 $86,556 0 $0 Water Supply
1 $8,412 $100,944 0 $0 Fire - Other
1 $5,237 $62,844 0 $0
Totals for Government
54 $450,906 $100,201 38 $49,351
Flossmoor government finances - Expenditure in 2017 (per resident):
Construction - Water Utilities: $215,000 ($23.02)
Regular Highways: $53,000 ($5.68)Solid Waste Management: $20,000 ($2.14)Current Operations - Police Protection: $3,612,000 ($386.77)
Water Utilities: $2,831,000 ($303.14)Local Fire Protection: $1,897,000 ($203.13)General - Other: $1,536,000 ($164.47)Sewerage: $1,257,000 ($134.60)Regular Highways: $843,000 ($90.27)Central Staff Services: $669,000 ($71.64)Financial Administration: $589,000 ($63.07)Protective Inspection and Regulation - Other: $207,000 ($22.17)Parking Facilities: $122,000 ($13.06)Parks and Recreation: $51,000 ($5.46)General - Interest on Debt: $1,101,000 ($117.89)
Other Capital Outlay - Water Utilities: $1,936,000 ($207.30)
Sewerage: $338,000 ($36.19)Regular Highways: $108,000 ($11.56)Police Protection: $60,000 ($6.42)Local Fire Protection: $5,000 ($0.54)Central Staff Services: $3,000 ($0.32)Total Salaries and Wages: $5,355,000 ($573.40)
Flossmoor government finances - Revenue in 2017 (per resident):
Charges - Sewerage: $1,512,000 ($161.90)
Other: $522,000 ($55.89)Parking Facilities: $172,000 ($18.42)Federal Intergovernmental - Other: $2,000 ($0.21)
Local Intergovernmental - Other: $42,000 ($4.50)
Miscellaneous - General Revenue - Other: $548,000 ($58.68)
Fines and Forfeits: $205,000 ($21.95)Interest Earnings: $54,000 ($5.78)Revenue - Water Utilities: $2,896,000 ($310.10)
State Intergovernmental - General Local Government Support: $1,512,000 ($161.90)
Highways: $240,000 ($25.70)Tax - Property: $5,871,000 ($628.65)
Public Utilities Sales: $767,000 ($82.13)Other Selective Sales: $366,000 ($39.19)Other License: $363,000 ($38.87)
Flossmoor government finances - Debt in 2017 (per resident):
Long Term Debt - Beginning Outstanding - Unspecified Public Purpose: $27,523,000 ($2947.10)
Outstanding Unspecified Public Purpose: $25,753,000 ($2757.58)Retired Unspecified Public Purpose: $1,813,000 ($194.13)Issue, Unspecified Public Purpose: $43,000 ($4.60)
Flossmoor government finances - Cash and Securities in 2017 (per resident):
Other Funds - Cash and Securities: $10,780,000 ($1154.30)
3.53% of this county's 2021 resident taxpayers lived in other counties in 2020 ($82,405 average adjusted gross income )
Here:
3.53%Illinois average:
5.09%
0.01% of residents moved from foreign countries ($114 average AGI )Cook County:
0.01%Illinois average:
0.01%
Top counties from which taxpayers relocated into this county between 2020 and 2021:
5.44% of this county's 2020 resident taxpayers moved to other counties in 2021 ($120,340 average adjusted gross income )
Here:
5.44%Illinois average:
6.10%
0.01% of residents moved to foreign countries ($140 average AGI )Cook County:
0.01%Illinois average:
0.01%
Top counties to which taxpayers relocated from this county between 2020 and 2021:
Businesses in Flossmoor, IL
Name Count Name Count
CVS 1 Subway 1 FedEx 3 UPS 1 Jones New York 1
Strongest AM radio stations in Flossmoor:
WLS (890 AM; 50 kW; CHICAGO, IL; Owner: WLS, INC.)
WVIV (1200 AM; 20 kW; CHICAGO, IL; Owner: WLXX-AM LICENSE CORP.)
WYLL (1160 AM; 50 kW; CHICAGO, IL; Owner: SCA LICENSE CORPORATION)
WMVP (1000 AM; 50 kW; CHICAGO, IL; Owner: ABC, INC.)
WSCR (670 AM; 50 kW; CHICAGO, IL; Owner: INFINITY BROADCASTING OPERATIONS, INC.)
WNTD (950 AM; 5 kW; CHICAGO, IL; Owner: RADIO UNICA OF CHICAGO LICENSE CORP.)
WNWI (1080 AM; 3 kW; OAK LAWN, IL; Owner: BIRACH BROADCASTING CORPORATION)
WBBM (780 AM; 50 kW; CHICAGO, IL; Owner: INFINITY BROADCASTING OPERATIONS, INC.)
WGN (720 AM; 50 kW; CHICAGO, IL; Owner: WGN CONTINENTAL BROADCASTING CO.)
WIND (560 AM; 5 kW; CHICAGO, IL; Owner: TICHENOR LICENSE CORPORATION ("TLC"))
WBEE (1570 AM; 1 kW; HARVEY, IL)
WRDZ (1300 AM; 4 kW; LA GRANGE, IL; Owner: ABC, INC.)
WCGO (1600 AM; 1 kW; CHICAGO HEIGHTS, IL)
Strongest FM radio stations in Flossmoor:
WHFH (88.5 FM; FLOSSMOOR, IL; Owner: COMMUNITY HIGH SCHOOL DIST. #233)
WYCA (106.3 FM; LANSING, IL; Owner: DONTRON, INC.)
WCKG (105.9 FM; ELMWOOD PARK, IL; Owner: INFINITY HOLDINGS CORPORATION OF ORLANDO)
WLIT-FM (93.9 FM; CHICAGO, IL; Owner: AMFM RADIO LICENSES, L.L.C.)
WJMK (104.3 FM; CHICAGO, IL; Owner: INFINITY BROADCASTING CORP. OF ILLINOIS)
WNUA (95.5 FM; CHICAGO, IL; Owner: AMFM RADIO LICENSES, L.L.C.)
WTMX (101.9 FM; SKOKIE, IL; Owner: BONNEVILLE HOLDING COMPANY)
WBBM-FM (96.3 FM; CHICAGO, IL; Owner: INFINITY BROADCASTING OPERATIONS, INC.)
WKSC-FM (103.5 FM; CHICAGO, IL; Owner: AMFM RADIO LICENSES, L.L.C.)
WFMT (98.7 FM; CHICAGO, IL; Owner: WINDOW TO THE WORLD COMMUNICATIONS)
WZZN (94.7 FM; CHICAGO, IL; Owner: ABC CHICAGO FM RADIO,INC.)
WGCI-FM (107.5 FM; CHICAGO, IL; Owner: AMFM RADIO LICENSES, L.L.C.)
WPWX (92.3 FM; HAMMOND, IN; Owner: DONTRON, INC.)
WBMF (88.1 FM; CRETE, IL; Owner: AMERICAN FAMILY ASSOCIATION)
WBEZ (91.5 FM; CHICAGO, IL; Owner: THE WBEZ ALLIANCE, INC.)
WKQX (101.1 FM; CHICAGO, IL; Owner: EMMIS RADIO LICENSE CORPORATION)
WLUP-FM (97.9 FM; CHICAGO, IL; Owner: BONNEVILLE HOLDING COMPANY)
WNND (100.3 FM; CHICAGO, IL; Owner: BONNEVILLE HOLDING COMPANY)
WOJO (105.1 FM; EVANSTON, IL; Owner: TICHENOR LICENSE CORPORATION ("TLC"))
WUSN (99.5 FM; CHICAGO, IL; Owner: INFINITY BROADCASTING CORPORATION OF CHICAGO)
TV broadcast stations around Flossmoor:
WLS-TV (Channel 7; CHICAGO, IL; Owner: WLS TELEVISION, INC.)
WMAQ-TV (Channel 5; CHICAGO, IL; Owner: NBC SUBSIDIARY (WMAQ-TV), INC.)
WTTW (Channel 11; CHICAGO, IL; Owner: WINDOW TO THE WORLD COMMUNICATIONS, INC.)
WGN-TV (Channel 9; CHICAGO, IL; Owner: WGN CONTINENTAL BROADCASTING COMPANY)
WYIN (Channel 56; GARY, IN; Owner: NORTHWEST INDIANA PUBLIC BROADCASTING, INC.)
WGBO-TV (Channel 66; JOLIET, IL; Owner: WGBO LICENSE PARTNERSHIP, G.P.)
WBBM-TV (Channel 2; CHICAGO, IL; Owner: CBS BROADCASTING INC.)
WPWR-TV (Channel 50; GARY, IN; Owner: FOX TELEVISION STATIONS, INC.)
WXFT (Channel 60; AURORA, IL; Owner: TELEFUTURA CHICAGO LLC)
WCIU-TV (Channel 26; CHICAGO, IL; Owner: WCIU-TV LIMITED PARTNERSHIP)
WCPX (Channel 38; CHICAGO, IL; Owner: PAXSON CHICAGO LICENSE, INC.)
WFLD (Channel 32; CHICAGO, IL; Owner: FOX TELEVISION STATIONS, INC.)
W68DO (Channel 68; PALATINE, IL; Owner: TRINITY BROADCASTING NETWORK)
WFBT-CA (Channel 23; CHICAGO, IL; Owner: CHANNEL 23 LIMITED PARTNERSHIP)
WJYS (Channel 62; HAMMOND, IN; Owner: JOVON BROADCASTING CORPORATION)
W54AP (Channel 54; BLUE ISLAND, IL; Owner: CATHOLIC VIEWS BROADCASTS, INC.)
WSNS-TV (Channel 44; CHICAGO, IL; Owner: TELEMUNDO OF CHICAGO, INC.)
WOCH-LP (Channel 28; CHICAGO, IL; Owner: KM LPTV OF CHICAGO-28, L.L.C.)
WYCC (Channel 20; CHICAGO, IL; Owner: COLLEGE DIST. #508, COUNTY OF COOK)
WOCK-CA (Channel 13; CHICAGO, IL; Owner: KM LPTV OF CHICAGO-13, L.L.C.)
W34CK (Channel 34; ARLINGTON HEIGHTS, IL; Owner: FIRST UNITED, INC.)
National Bridge Inventory (NBI) Statistics 5 Number of bridges30ft / 9.2m Total length $452,000 Total costs53,575 Total average daily traffic1,899 Total average daily truck traffic
FCC Registered Antenna Towers: 4
Julie Kim, 1441 Western Ave. (Lat: 41.533361 Lon: -87.669167), Type: 35.3, Structure height: 17031 m, Overall height: 29.8 m, Registrant: American Towers LLC, Faa-Fcc@americantower.Com, , Wobur-n, Phone: (781) 926-4500 Bridget Carter, 1441 Western Ave. (Lat: 41.533361 Lon: -87.669167), Type: 35.3, Structure height: 17031 m, Overall height: 29.8 m, Registrant: American Towers LLC, Faa-Fcc@americantower.Com, , Wobur-n, Phone: (781) 926-4500 Courtney Schoonover, 1441 Western Ave. (Lat: 41.533361 Lon: -87.669167), Type: 35.3, Structure height: 17031 m, Overall height: 29.8 m, Registrant: American Towers LLC, Faa-Fcc@americantower.Com, , Wobur-n, Phone: (781) 926-4500 Courtney Schoonover, 1441 Western Ave. (Lat: 41.533361 Lon: -87.669167), Type: 35.3, Structure height: 17031 m, Overall height: 29.8 m, Registrant: American Towers LLC, Faa-Fcc@americantower.Com, , Wobur-n, Phone: (781) 926-4500 FCC Registered Commercial Land Mobile Towers: 1 (
See the full list of FCC Registered Commercial Land Mobile Towers in Flossmoor, IL )
FCC Registered Broadcast Land Mobile Towers: 9 (
See the full list of FCC Registered Broadcast Land Mobile Towers )
FCC Registered Microwave Towers: 5
IL-CHI5764, 2511 Wallace Drive (Lat: 41.546889 Lon: -87.677667), Type: Tank, Structure height: 36.6 m, Call Sign: WQLC212, Licensee ID: L01744207, Assigned Frequencies: 10775.0 MHz, 10975.0 MHz, 10895.0 MHz, 11095.0 MHz, Grant Date: 01/14/2020, Expiration Date: 11/30/2029, Cancellation Date: 04/05/2022, Certifier: Nadja S Sodos-Wallace, Registrant: Clearwire Spectrum Holdings Iii LLC IL-CHI5512, 1441 Western Avenue (Lat: 41.533333 Lon: -87.669111), Type: Pole, Structure height: 25.9 m, Overall height: 26.8 m, Call Sign: WQLC445, Assigned Frequencies: 10775.0 MHz, Grant Date: 12/02/2009, Expiration Date: 12/02/2019, Cancellation Date: 11/27/2019, Certifier: Nadja S Sodos-Wallace, Registrant: Sprint Corporation, 12502 Sunrise Valley Drive, M/S: Varesa, Reston, VA 20196, Phone: (800) 572-8256, Fax: (703) 433-4483, Email:
VOLLMER & DIXIE HWY, 1441 Western Ave (Lat: 41.533389 Lon: -87.669111), Type: Tower, Structure height: 45.1 m, Overall height: 48.2 m, Call Sign: WQPH920, Assigned Frequencies: 11135.0 MHz, Grant Date: 05/23/2012, Expiration Date: 05/23/2022, Cancellation Date: 08/03/2016, Certifier: Steven T Campbell, Registrant: Holland & Knight LLP, 800 17th Street, N.W., Suite #1100, Washington, DC 20006-3906, Phone: (202) 955-3000, Fax: (202) 955-5564, Email:
FLOOSMOOR PD, 2800 Floosmoor Rd (Lat: 41.542056 Lon: -87.685500), Type: Ltower, Structure height: 21.3 m, Call Sign: WQXE628, Licensee ID: L01349289, Assigned Frequencies: 10735.0 MHz, 10735.0 MHz, 10735.0 MHz, 10735.0 MHz, 10735.0 MHz, 10735.0 MHz, 10735.0 MHz, 10735.0 MHz, 10735.0 MHz, 10735.0 MHz... (+3 more), Grant Date: 02/12/2016, Expiration Date: 02/12/2026, Certifier: Jeanine Chiappano, Registrant: E-Com Dispatch Center, 1154 Ridge Road, Homewood, IL 60430, Phone: (708) 799-0482, Fax: (708) 799-4845, Email:
FLOSSMOOR WT, 1700 Central Park Drive (Lat: 41.532389 Lon: -87.704750), Type: Tank, Structure height: 39.6 m, Call Sign: WQXE630, Licensee ID: L01349289, Assigned Frequencies: 11345.0 MHz, 17920.0 MHz, Grant Date: 02/12/2016, Expiration Date: 02/12/2026, Certifier: Jeanine Chiappano, Registrant: E-Com Dispatch Center, 1154 Ridge Road, Homewood, IL 60430, Phone: (708) 799-0482, Fax: (708) 799-4845, Email:
FCC Registered Amateur Radio Licenses: 24 (
See the full list of FCC Registered Amateur Radio Licenses in Flossmoor )
FAA Registered Aircraft: 4
Aircraft: CIRRUS DESIGN CORP SF50 (Category: Land, Seats: 7, Weight: Up to 12,499 Pounds), Engine: WILLIAMS FJ33-5A (2000 Pounds of Thrust) (Turbo-fan)N-Number: 418RS, N418RS, N-418RS, Serial Number: 0064, Year manufactured: 2018, Airworthiness Date: 07/17/2018, Certificate Issue Date: 09/25/2018Registrant (Individual): Robert J Sugar, 1725 Lynwood Ct, Flossmoor, IL 60422Aircraft: BELLANCA 7ECA (Category: Land, Seats: 2, Weight: Up to 12,499 Pounds, Speed: 90 mph), Engine: LYCOMING 0-235 SERIES (115 HP) (Reciprocating)N-Number: 90915, N90915, N-90915, Serial Number: 894-73, Airworthiness Date: 12/05/1972, Certificate Issue Date: 02/28/2014Registrant (Corporation): Cnj Flying Inc, 1840 Cambridge Ave, Flossmoor, IL 60422Aircraft: CESSNA 210N (Category: Land, Seats: 6, Weight: Up to 12,499 Pounds), Engine: CONT MOTOR IO 520 SERIES (285 HP) (Reciprocating)N-Number: 6545N, N6545N, N-6545N, Serial Number: 21063101, Year manufactured: 1978, Airworthiness Date: 01/12/1979, Certificate Issue Date: 06/05/1991Registrant (Corporation): J K Aviation, 1840 Cambridge Ave, Flossmoor, IL 60422Deregistered: Cancel Date: 10/07/2020, Exported to: MexicoAircraft: CIRRUS DESIGN CORP SR22T (Category: Land, Seats: 5, Weight: Up to 12,499 Pounds), Engine: CONT MOTOR TSIO-550-K (315 HP) (Reciprocating)N-Number: 418RS, N418RS, N-418RS, Serial Number: 0551, Year manufactured: 2013, Airworthiness Date: 07/09/2013, Certificate Issue Date: 08/12/2013Registrant (Individual): Robert J Sugar, 1725 Lynnwood Ct, Flossmoor, IL 60422
Home Mortgage Disclosure Act Aggregated Statistics For Year 2009(Based on 3 partial tracts) A) FHA, FSA/RHS & VA B) Conventional C) Refinancings D) Home Improvement Loans F) Non-occupant Loans on Number Average Value Number Average Value Number Average Value Number Average Value Number Average Value
LOANS ORIGINATED 50 $191,827 33 $180,171 212 $206,311 4 $36,682 9 $123,286 APPLICATIONS APPROVED, NOT ACCEPTED 6 $209,105 3 $193,017 19 $222,047 2 $15,720 1 $57,090 APPLICATIONS DENIED 14 $231,429 13 $184,665 91 $223,919 5 $35,334 4 $233,140 APPLICATIONS WITHDRAWN 10 $196,143 5 $157,936 40 $208,130 0 $0 3 $211,600 FILES CLOSED FOR INCOMPLETENESS 4 $193,835 1 $116,660 20 $225,507 1 $8,920 1 $117,280
Aggregated Statistics For Year 2008(Based on 3 partial tracts) A) FHA, FSA/RHS & VA B) Conventional C) Refinancings D) Home Improvement Loans E) Loans on Dwellings For 5+ Families F) Non-occupant Loans on G) Loans On Manufactured Number Average Value Number Average Value Number Average Value Number Average Value Number Average Value Number Average Value Number Average Value
LOANS ORIGINATED 31 $196,341 66 $207,912 168 $210,625 11 $48,616 2 $1,541,090 13 $172,787 0 $0 APPLICATIONS APPROVED, NOT ACCEPTED 4 $209,795 8 $276,080 31 $218,800 4 $9,310 0 $0 5 $210,708 0 $0 APPLICATIONS DENIED 14 $194,528 33 $193,215 142 $220,651 24 $42,074 0 $0 12 $157,125 0 $0 APPLICATIONS WITHDRAWN 4 $190,825 10 $198,811 36 $255,630 2 $165,900 0 $0 5 $175,782 1 $389,330 FILES CLOSED FOR INCOMPLETENESS 1 $260,260 2 $328,705 21 $239,530 1 $92,870 0 $0 1 $104,740 0 $0
Aggregated Statistics For Year 2007(Based on 3 partial tracts) A) FHA, FSA/RHS & VA B) Conventional C) Refinancings D) Home Improvement Loans E) Loans on Dwellings For 5+ Families F) Non-occupant Loans on G) Loans On Manufactured Number Average Value Number Average Value Number Average Value Number Average Value Number Average Value Number Average Value Number Average Value
LOANS ORIGINATED 9 $222,646 169 $207,959 230 $200,568 40 $86,000 1 $1,103,580 20 $158,692 0 $0 APPLICATIONS APPROVED, NOT ACCEPTED 2 $152,120 31 $239,812 49 $220,369 8 $67,149 0 $0 4 $198,762 0 $0 APPLICATIONS DENIED 1 $275,460 93 $261,523 214 $227,119 37 $123,550 0 $0 19 $218,697 1 $29,140 APPLICATIONS WITHDRAWN 1 $106,270 24 $285,526 56 $225,003 2 $157,980 0 $0 6 $217,538 0 $0 FILES CLOSED FOR INCOMPLETENESS 1 $97,610 12 $291,212 33 $233,452 1 $42,440 0 $0 5 $136,500 0 $0
Aggregated Statistics For Year 2006(Based on 3 partial tracts) A) FHA, FSA/RHS & VA B) Conventional C) Refinancings D) Home Improvement Loans E) Loans on Dwellings For 5+ Families F) Non-occupant Loans on G) Loans On Manufactured Number Average Value Number Average Value Number Average Value Number Average Value Number Average Value Number Average Value Number Average Value
LOANS ORIGINATED 9 $168,969 306 $187,213 309 $213,993 47 $88,183 2 $2,288,740 29 $193,008 1 $11,140 APPLICATIONS APPROVED, NOT ACCEPTED 2 $204,435 52 $197,182 66 $217,530 9 $79,528 0 $0 9 $126,053 0 $0 APPLICATIONS DENIED 2 $128,815 137 $219,588 223 $210,758 41 $90,851 0 $0 21 $142,845 0 $0 APPLICATIONS WITHDRAWN 3 $194,200 72 $196,818 79 $237,996 6 $206,507 0 $0 8 $233,831 0 $0 FILES CLOSED FOR INCOMPLETENESS 0 $0 24 $186,072 44 $249,525 0 $0 0 $0 0 $0 0 $0
Aggregated Statistics For Year 2005(Based on 3 partial tracts) A) FHA, FSA/RHS & VA B) Conventional C) Refinancings D) Home Improvement Loans F) Non-occupant Loans on G) Loans On Manufactured Number Average Value Number Average Value Number Average Value Number Average Value Number Average Value Number Average Value
LOANS ORIGINATED 9 $185,470 353 $168,986 310 $201,625 41 $85,872 41 $143,498 1 $19,670 APPLICATIONS APPROVED, NOT ACCEPTED 2 $130,435 61 $162,558 59 $200,060 7 $131,727 7 $136,410 0 $0 APPLICATIONS DENIED 3 $181,007 108 $172,083 209 $214,257 33 $64,778 12 $200,890 0 $0 APPLICATIONS WITHDRAWN 1 $232,350 46 $205,783 94 $239,252 10 $160,077 7 $231,037 0 $0 FILES CLOSED FOR INCOMPLETENESS 1 $54,640 19 $173,005 42 $222,892 2 $74,350 1 $78,320 0 $0
Aggregated Statistics For Year 2004(Based on 3 partial tracts) A) FHA, FSA/RHS & VA B) Conventional C) Refinancings D) Home Improvement Loans F) Non-occupant Loans on G) Loans On Manufactured Number Average Value Number Average Value Number Average Value Number Average Value Number Average Value Number Average Value
LOANS ORIGINATED 15 $143,004 259 $173,894 353 $178,603 38 $70,569 24 $136,099 1 $77,240 APPLICATIONS APPROVED, NOT ACCEPTED 1 $185,740 47 $204,941 70 $180,196 6 $65,348 11 $175,275 0 $0 APPLICATIONS DENIED 1 $155,200 66 $209,818 182 $222,410 27 $91,914 11 $173,583 2 $130,900 APPLICATIONS WITHDRAWN 2 $84,355 50 $182,420 81 $189,317 4 $94,822 5 $131,954 0 $0 FILES CLOSED FOR INCOMPLETENESS 0 $0 13 $209,133 47 $191,187 2 $80,315 3 $86,740 0 $0
Aggregated Statistics For Year 2003(Based on 3 partial tracts) A) FHA, FSA/RHS & VA B) Conventional C) Refinancings D) Home Improvement Loans E) Loans on Dwellings For 5+ Families F) Non-occupant Loans on Number Average Value Number Average Value Number Average Value Number Average Value Number Average Value Number Average Value
LOANS ORIGINATED 13 $136,631 223 $183,677 748 $169,606 29 $37,251 1 $2,875,950 17 $133,075 APPLICATIONS APPROVED, NOT ACCEPTED 2 $145,120 38 $197,258 91 $164,950 5 $49,392 0 $0 6 $103,955 APPLICATIONS DENIED 4 $141,432 47 $188,696 207 $163,631 19 $37,119 0 $0 13 $109,768 APPLICATIONS WITHDRAWN 7 $146,619 30 $175,638 103 $164,716 5 $46,106 0 $0 3 $106,243 FILES CLOSED FOR INCOMPLETENESS 0 $0 10 $142,974 36 $151,830 2 $61,915 0 $0 1 $182,240
Aggregated Statistics For Year 2002(Based on 3 partial tracts) A) FHA, FSA/RHS & VA B) Conventional C) Refinancings D) Home Improvement Loans E) Loans on Dwellings For 5+ Families F) Non-occupant Loans on Number Average Value Number Average Value Number Average Value Number Average Value Number Average Value Number Average Value
LOANS ORIGINATED 26 $139,847 205 $174,414 507 $170,922 25 $31,941 0 $0 15 $153,233 APPLICATIONS APPROVED, NOT ACCEPTED 0 $0 26 $182,197 93 $167,552 5 $54,968 0 $0 6 $110,488 APPLICATIONS DENIED 4 $159,188 32 $176,398 137 $169,800 14 $28,805 1 $790,820 7 $130,749 APPLICATIONS WITHDRAWN 3 $158,480 18 $229,727 70 $171,126 6 $24,022 0 $0 3 $130,803 FILES CLOSED FOR INCOMPLETENESS 0 $0 12 $165,891 56 $152,596 2 $67,320 0 $0 1 $48,880
Aggregated Statistics For Year 2001(Based on 3 partial tracts) A) FHA, FSA/RHS & VA B) Conventional C) Refinancings D) Home Improvement Loans E) Loans on Dwellings For 5+ Families F) Non-occupant Loans on Number Average Value Number Average Value Number Average Value Number Average Value Number Average Value Number Average Value
LOANS ORIGINATED 34 $124,713 198 $159,368 367 $158,016 36 $47,087 1 $2,497,600 17 $141,246 APPLICATIONS APPROVED, NOT ACCEPTED 1 $200,960 25 $168,738 54 $144,502 9 $17,619 1 $90,840 2 $85,225 APPLICATIONS DENIED 3 $147,007 33 $150,335 160 $152,385 21 $21,876 0 $0 3 $118,343 APPLICATIONS WITHDRAWN 5 $133,548 27 $170,934 59 $143,192 4 $35,068 1 $2,149,420 2 $112,355 FILES CLOSED FOR INCOMPLETENESS 0 $0 10 $130,634 19 $164,591 2 $19,655 0 $0 1 $446,110
Aggregated Statistics For Year 2000(Based on 3 partial tracts) A) FHA, FSA/RHS & VA B) Conventional C) Refinancings D) Home Improvement Loans E) Loans on Dwellings For 5+ Families F) Non-occupant Loans on Number Average Value Number Average Value Number Average Value Number Average Value Number Average Value Number Average Value
LOANS ORIGINATED 30 $130,676 201 $153,175 120 $137,188 37 $39,441 1 $243,330 11 $93,615 APPLICATIONS APPROVED, NOT ACCEPTED 1 $228,320 20 $208,328 29 $152,952 11 $21,767 0 $0 2 $285,830 APPLICATIONS DENIED 4 $136,442 46 $179,861 115 $152,591 31 $26,586 0 $0 4 $75,785 APPLICATIONS WITHDRAWN 6 $141,115 20 $173,286 58 $150,288 7 $155,931 0 $0 0 $0 FILES CLOSED FOR INCOMPLETENESS 0 $0 10 $158,936 24 $180,388 1 $39,590 0 $0 0 $0
Aggregated Statistics For Year 1999(Based on 3 partial tracts) A) FHA, FSA/RHS & VA B) Conventional C) Refinancings D) Home Improvement Loans E) Loans on Dwellings For 5+ Families F) Non-occupant Loans on Number Average Value Number Average Value Number Average Value Number Average Value Number Average Value Number Average Value
LOANS ORIGINATED 46 $125,541 210 $156,617 263 $150,775 35 $42,577 0 $0 22 $124,508 APPLICATIONS APPROVED, NOT ACCEPTED 2 $177,080 33 $152,486 58 $157,013 5 $15,178 0 $0 2 $204,695 APPLICATIONS DENIED 5 $105,332 52 $144,149 133 $179,695 29 $39,687 1 $235,650 5 $90,724 APPLICATIONS WITHDRAWN 3 $108,467 26 $176,430 75 $147,878 3 $14,423 0 $0 3 $117,147 FILES CLOSED FOR INCOMPLETENESS 0 $0 11 $157,758 33 $154,613 0 $0 0 $0 0 $0
Detailed HMDA statistics for the following Tracts:
8288.01
, 8298.00 , 8299.02
Private Mortgage Insurance Companies Aggregated Statistics For Year 2009(Based on 3 partial tracts) A) Conventional B) Refinancings Number Average Value Number Average Value
LOANS ORIGINATED 7 $193,223 4 $239,242 APPLICATIONS APPROVED, NOT ACCEPTED 5 $286,786 3 $255,230 APPLICATIONS DENIED 2 $238,785 2 $191,135 APPLICATIONS WITHDRAWN 2 $355,390 3 $177,233 FILES CLOSED FOR INCOMPLETENESS 0 $0 0 $0
Aggregated Statistics For Year 2008(Based on 3 partial tracts) A) Conventional B) Refinancings C) Non-occupant Loans on Number Average Value Number Average Value Number Average Value
LOANS ORIGINATED 34 $208,878 17 $222,234 5 $190,132 APPLICATIONS APPROVED, NOT ACCEPTED 17 $196,081 8 $236,284 2 $163,830 APPLICATIONS DENIED 8 $245,559 1 $297,810 2 $215,755 APPLICATIONS WITHDRAWN 5 $153,832 1 $245,760 0 $0 FILES CLOSED FOR INCOMPLETENESS 1 $187,920 0 $0 1 $166,280
Aggregated Statistics For Year 2007(Based on 3 partial tracts) A) Conventional B) Refinancings C) Non-occupant Loans on Number Average Value Number Average Value Number Average Value
LOANS ORIGINATED 59 $205,061 32 $229,263 4 $154,320 APPLICATIONS APPROVED, NOT ACCEPTED 9 $207,344 8 $223,490 1 $190,670 APPLICATIONS DENIED 3 $290,000 0 $0 0 $0 APPLICATIONS WITHDRAWN 4 $210,318 2 $224,700 0 $0 FILES CLOSED FOR INCOMPLETENESS 0 $0 0 $0 0 $0
Aggregated Statistics For Year 2006(Based on 3 partial tracts) A) Conventional B) Refinancings C) Non-occupant Loans on Number Average Value Number Average Value Number Average Value
LOANS ORIGINATED 35 $185,951 20 $227,382 1 $163,760 APPLICATIONS APPROVED, NOT ACCEPTED 7 $180,601 2 $269,605 0 $0 APPLICATIONS DENIED 1 $74,270 0 $0 0 $0 APPLICATIONS WITHDRAWN 4 $184,760 2 $217,735 0 $0 FILES CLOSED FOR INCOMPLETENESS 0 $0 0 $0 0 $0
Aggregated Statistics For Year 2005(Based on 3 partial tracts) A) Conventional B) Refinancings C) Non-occupant Loans on Number Average Value Number Average Value Number Average Value
LOANS ORIGINATED 53 $167,885 24 $226,306 6 $117,027 APPLICATIONS APPROVED, NOT ACCEPTED 9 $201,729 5 $225,648 1 $70,280 APPLICATIONS DENIED 0 $0 0 $0 0 $0 APPLICATIONS WITHDRAWN 3 $223,507 5 $193,534 1 $193,040 FILES CLOSED FOR INCOMPLETENESS 0 $0 0 $0 0 $0
Aggregated Statistics For Year 2004(Based on 3 partial tracts) A) Conventional B) Refinancings C) Non-occupant Loans on Number Average Value Number Average Value Number Average Value
LOANS ORIGINATED 58 $185,352 18 $208,971 5 $100,774 APPLICATIONS APPROVED, NOT ACCEPTED 8 $151,220 6 $211,827 0 $0 APPLICATIONS DENIED 1 $573,240 0 $0 0 $0 APPLICATIONS WITHDRAWN 6 $187,278 3 $238,870 0 $0 FILES CLOSED FOR INCOMPLETENESS 0 $0 0 $0 0 $0
Aggregated Statistics For Year 2003(Based on 3 partial tracts) A) Conventional B) Refinancings C) Non-occupant Loans on Number Average Value Number Average Value Number Average Value
LOANS ORIGINATED 65 $177,479 79 $176,165 2 $83,265 APPLICATIONS APPROVED, NOT ACCEPTED 15 $199,186 21 $180,632 0 $0 APPLICATIONS DENIED 0 $0 1 $194,490 0 $0 APPLICATIONS WITHDRAWN 1 $136,850 5 $206,764 0 $0 FILES CLOSED FOR INCOMPLETENESS 0 $0 0 $0 0 $0
Aggregated Statistics For Year 2002(Based on 3 partial tracts) A) Conventional B) Refinancings C) Non-occupant Loans on Number Average Value Number Average Value Number Average Value
LOANS ORIGINATED 70 $174,184 49 $180,116 2 $83,195 APPLICATIONS APPROVED, NOT ACCEPTED 8 $166,014 11 $160,629 0 $0 APPLICATIONS DENIED 1 $207,760 0 $0 0 $0 APPLICATIONS WITHDRAWN 1 $175,800 6 $230,597 0 $0 FILES CLOSED FOR INCOMPLETENESS 0 $0 0 $0 0 $0
Aggregated Statistics For Year 2001(Based on 3 partial tracts) A) Conventional B) Refinancings C) Non-occupant Loans on Number Average Value Number Average Value Number Average Value
LOANS ORIGINATED 70 $156,202 41 $153,990 3 $91,743 APPLICATIONS APPROVED, NOT ACCEPTED 13 $149,138 10 $177,532 2 $140,225 APPLICATIONS DENIED 2 $163,035 1 $226,460 0 $0 APPLICATIONS WITHDRAWN 1 $227,470 0 $0 0 $0 FILES CLOSED FOR INCOMPLETENESS 0 $0 1 $100,790 0 $0
Aggregated Statistics For Year 2000(Based on 3 partial tracts) A) Conventional B) Refinancings C) Non-occupant Loans on Number Average Value Number Average Value Number Average Value
LOANS ORIGINATED 55 $170,822 12 $158,266 2 $124,785 APPLICATIONS APPROVED, NOT ACCEPTED 8 $169,752 4 $201,420 0 $0 APPLICATIONS DENIED 4 $169,650 2 $179,745 1 $26,520 APPLICATIONS WITHDRAWN 3 $230,690 0 $0 0 $0 FILES CLOSED FOR INCOMPLETENESS 1 $251,180 0 $0 0 $0
Aggregated Statistics For Year 1999(Based on 3 partial tracts) A) Conventional B) Refinancings C) Non-occupant Loans on Number Average Value Number Average Value Number Average Value
LOANS ORIGINATED 63 $139,769 23 $139,178 1 $166,080 APPLICATIONS APPROVED, NOT ACCEPTED 10 $156,247 4 $118,120 0 $0 APPLICATIONS DENIED 6 $160,712 2 $275,590 0 $0 APPLICATIONS WITHDRAWN 3 $168,290 1 $173,360 0 $0 FILES CLOSED FOR INCOMPLETENESS 2 $134,185 0 $0 0 $0
Detailed PMIC statistics for the following Tracts:
8288.01
, 8298.00 , 8299.02
Most common first names in Flossmoor, IL among deceased individuals Name Count Lived (average)
John 59 73.4 years Mary 54 82.1 years William 50 78.4 years Joseph 35 74.1 years Helen 31 79.3 years Robert 30 69.7 years Charles 29 74.8 years James 29 73.4 years George 29 78.5 years Dorothy 25 82.0 years
Most common last names in Flossmoor, IL among deceased individuals Last name Count Lived (average)
Smith 22 79.6 years Thompson 12 82.4 years Anderson 11 81.4 years Johnson 10 80.9 years Nelson 9 74.4 years Brown 8 82.1 years Williams 8 78.9 years Murphy 7 87.0 years Jones 7 76.6 years Miller 6 80.7 years
Flossmoor compared to Illinois state average:
Median household income above state average. Unemployed percentage significantly below state average. Black race population percentage significantly above state average. Hispanic race population percentage significantly below state average. Median age above state average. Foreign-born population percentage significantly below state average. Renting percentage significantly below state average. Length of stay since moving in significantly above state average. Number of rooms per house above state average. Percentage of population with a bachelor's degree or higher significantly above state average.
#22 on the list of "Top 101 cities with the most people taking railroad to work (population 5,000+)"
#32 on the list of "Top 101 cities with the largest positive percentage difference between never married females and males (15+ years) (with at least 1,000 females never married)"
#47 on the list of "Top 101 cities with largest percentage of females in occupations: management occupations (population 5,000+)"
#78 on the list of "Top 101 cities with largest percentage of males in occupations: community and social service occupations (population 5,000+)"
#95 on the list of "Top 101 cities with largest percentage of females in occupations: legal occupations (population 5,000+)"
#95 on the list of "Top 101 cities with the most residents born in Africa, n.e.c. (population 500+)"
#1 on the list of "Top 101 counties with the most Black Protestant congregations"
#1 on the list of "Top 101 counties with the most Catholic congregations"
#1 on the list of "Top 101 counties with the highest surface withdrawal of fresh water for public supply"
#2 on the list of "Top 101 counties with the most Black Protestant adherents"
#2 on the list of "Top 101 counties with the most Orthodox congregations (pop. 50,000+)"
Top Patent Applicants
Patrick J. Sweeney (30)
Elizabeth M. Andrews (8)
Mekell Jiles (6)
Harvey E. Schmidt (5)
David T. Tennant (3)
Kang Yong Yang (3)
Michael Kamradt (3)
James L. Orrington, Ii (3)
John Oliver (2)
Harvey Edward Schmidt (2)
Total of 99 patent applications in 2008-2024.
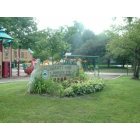

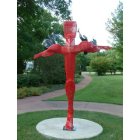
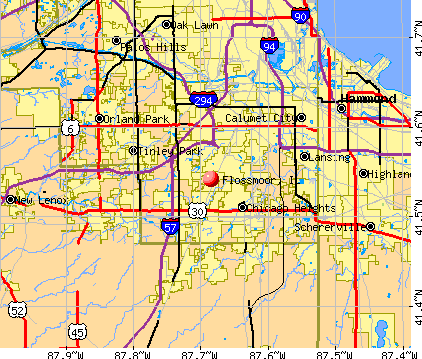


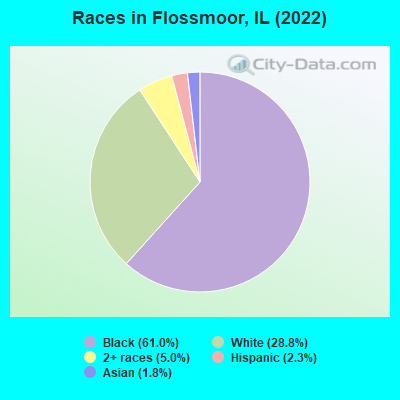
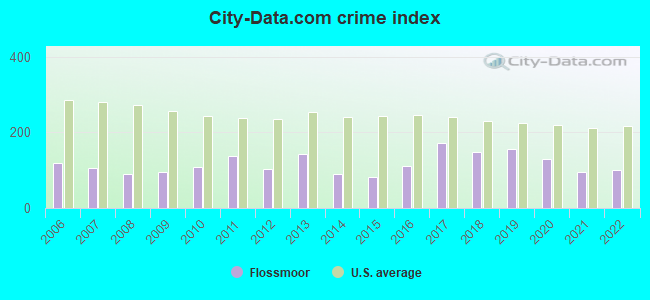
 Recent articles from our blog. Our writers, many of them Ph.D. graduates or candidates, create easy-to-read articles on a wide variety of topics.

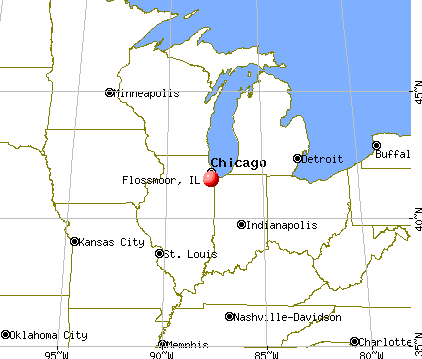
 (10.0 miles
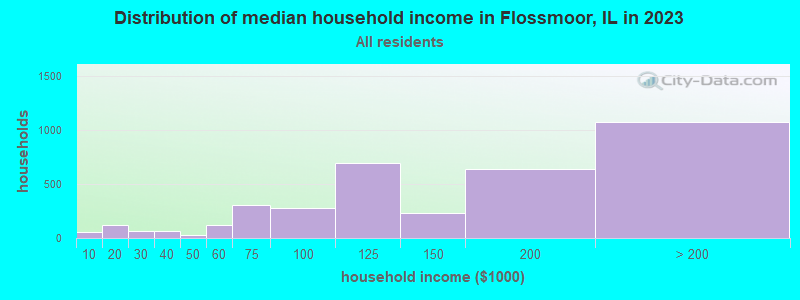
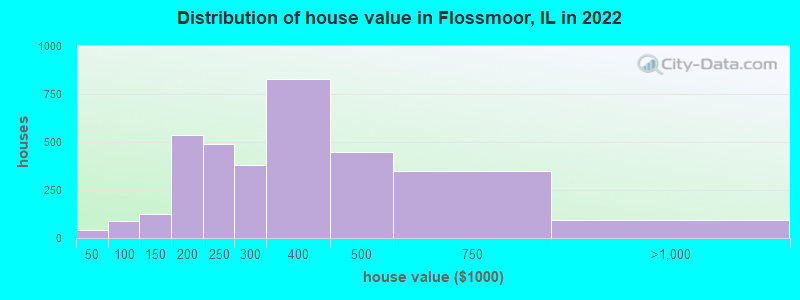

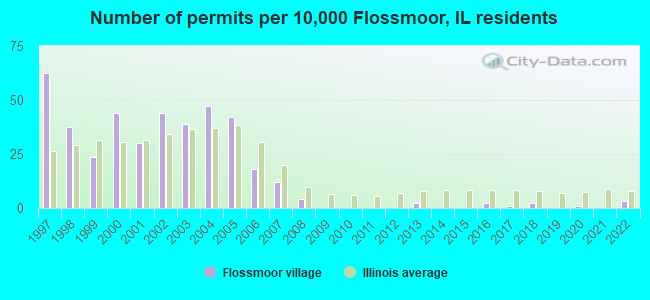
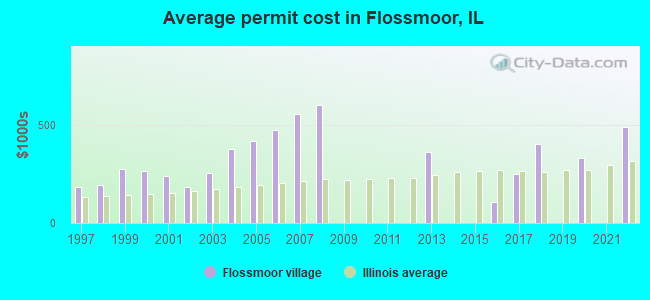
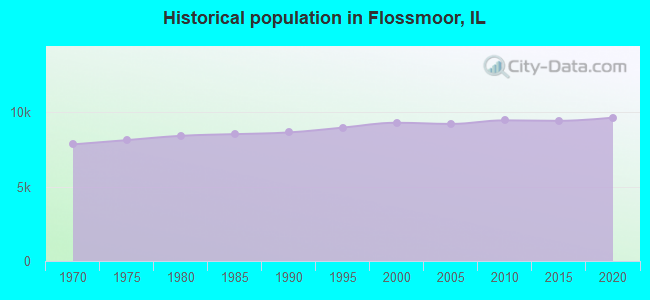
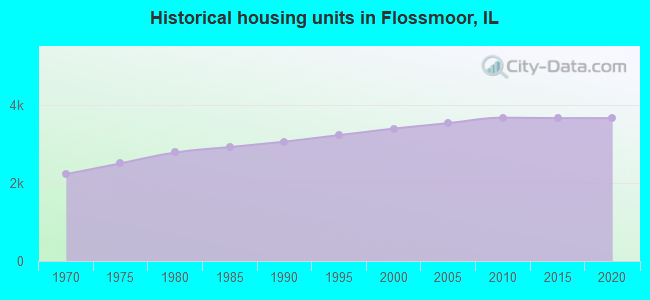
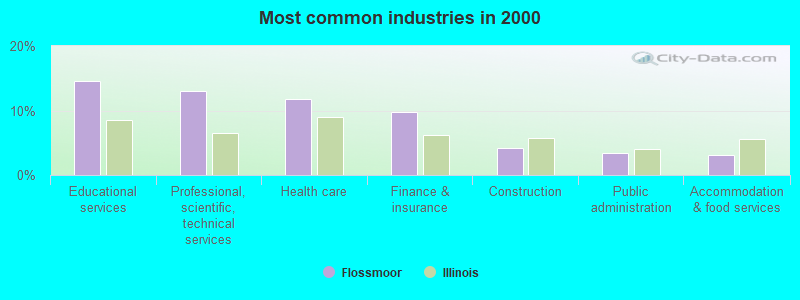
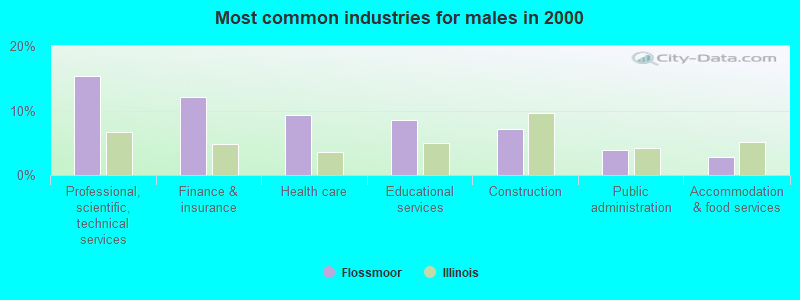
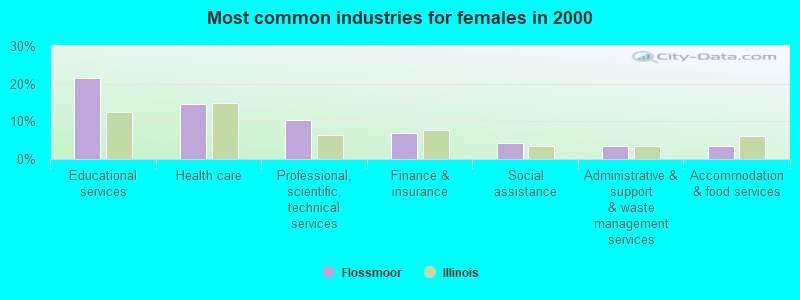
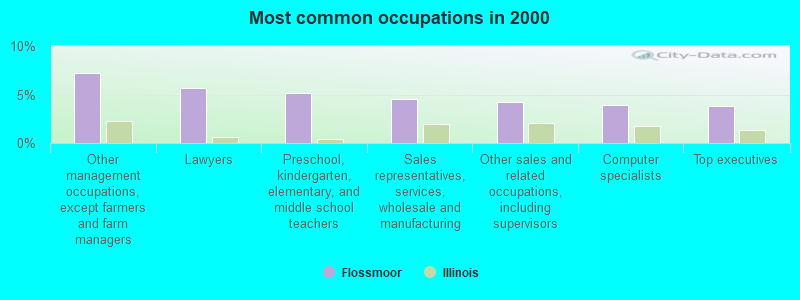
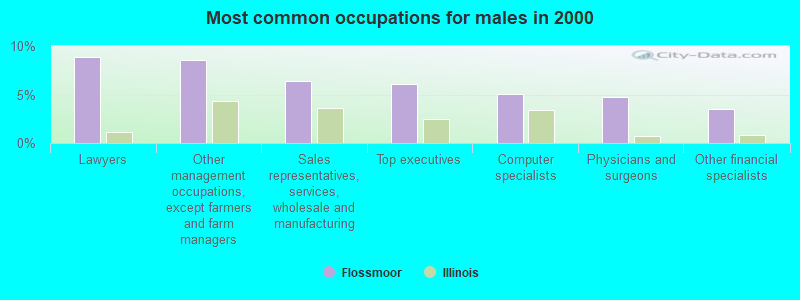
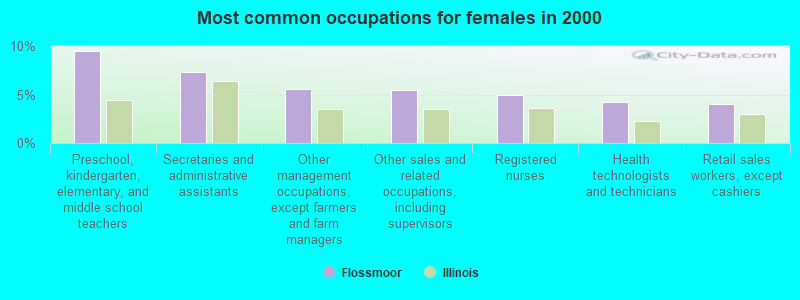


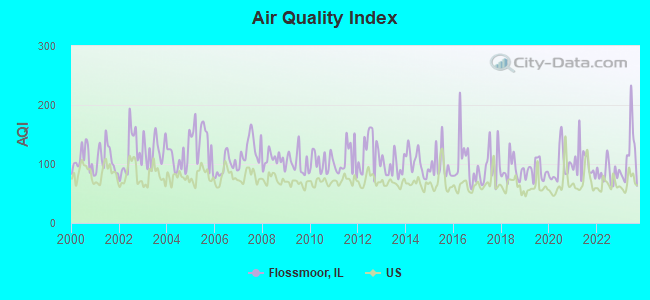
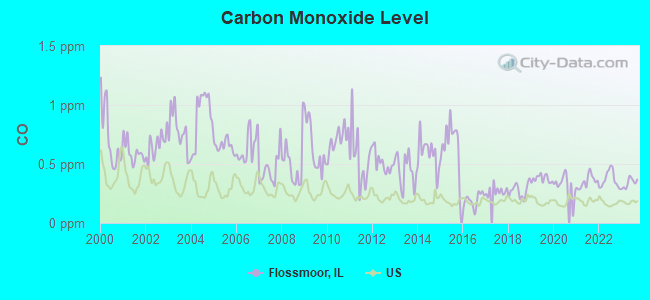
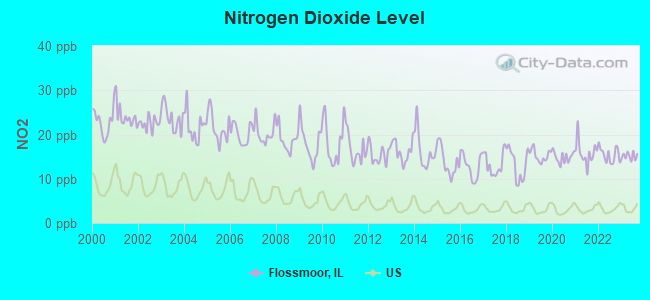
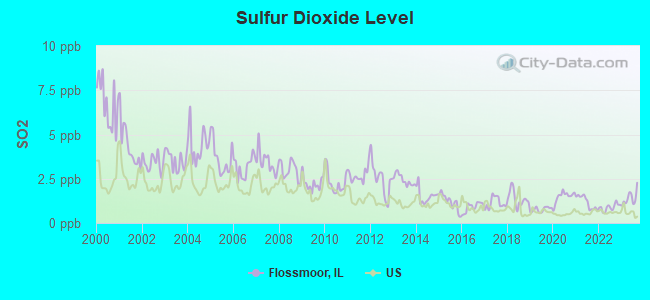
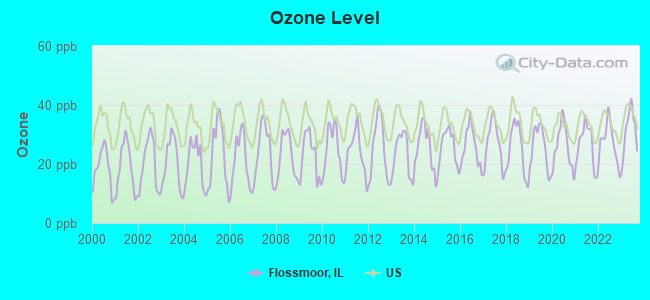
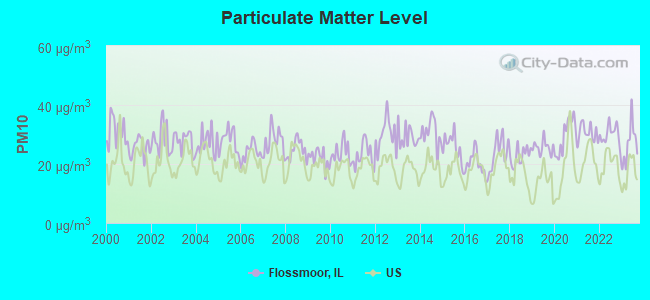
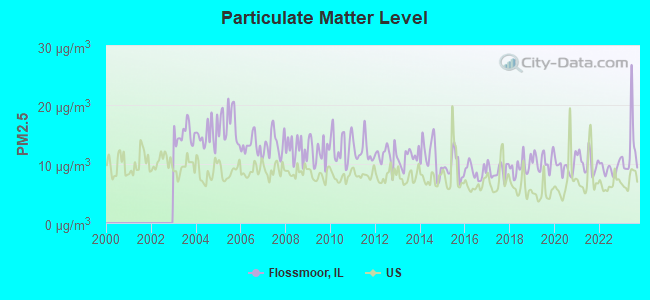
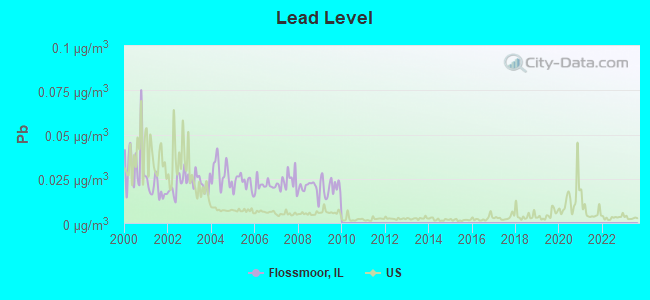
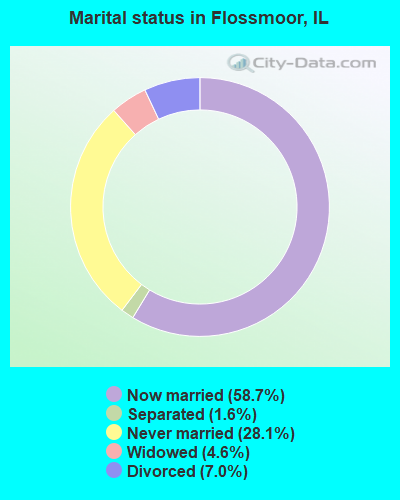
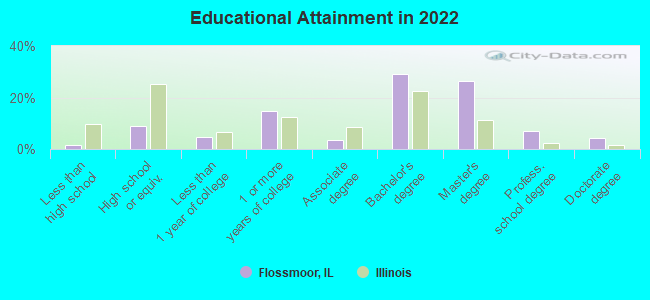
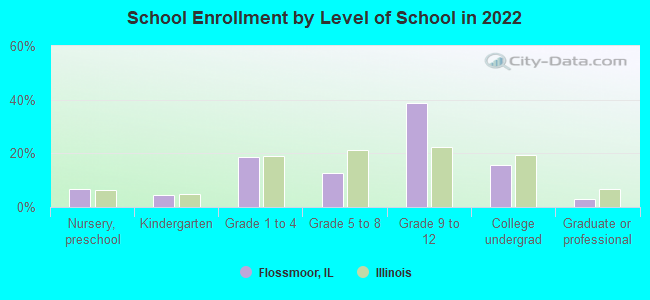
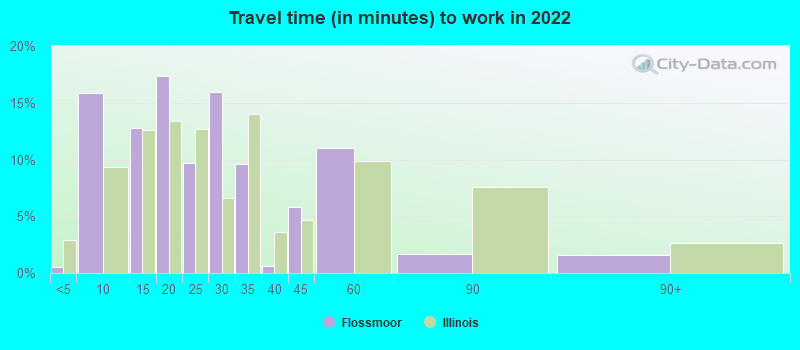
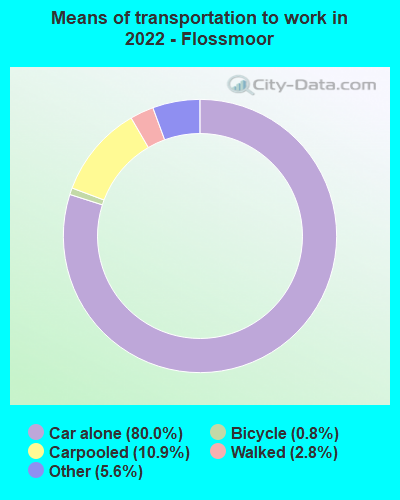


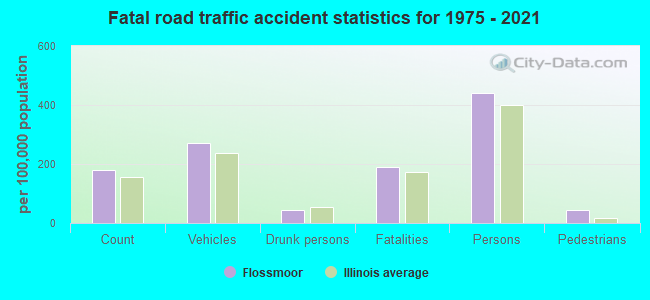
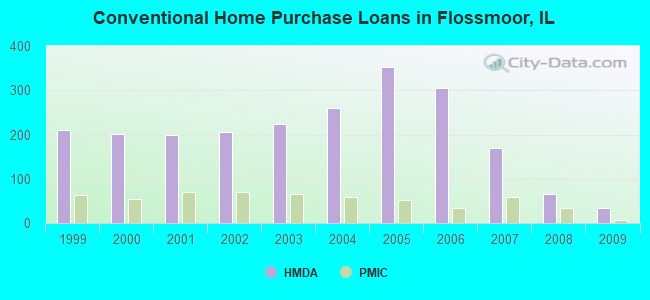
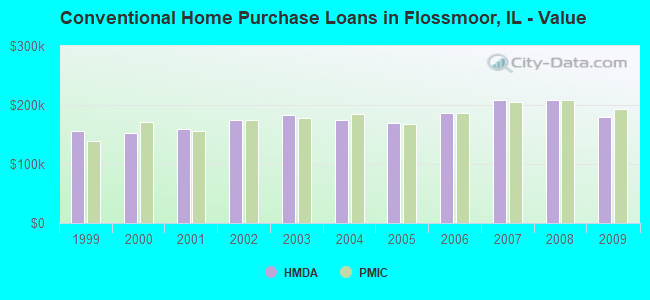
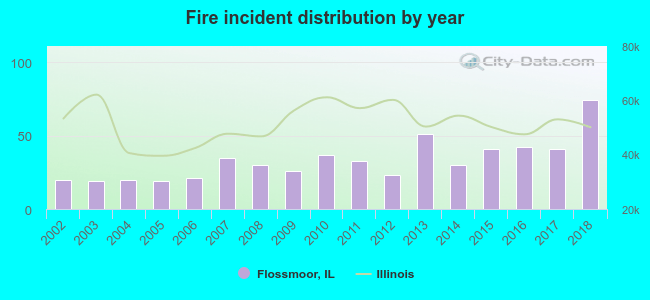 Based on the data from the years 2002 - 2018 the average number of fire incidents per year is 33. The highest number of reported fire incidents - 74 took place in 2018, and the least - 19 in 2003. The data has an increasing trend.
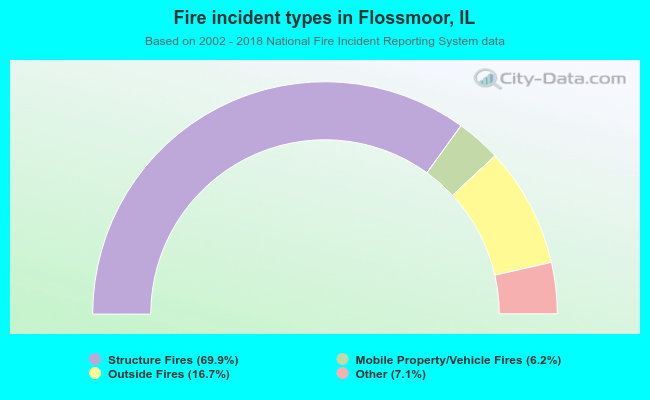 When looking into fire subcategories, the most reports belonged to: Structure Fires (69.9%), and Outside Fires (16.7%).