Hudsonville, Michigan Submit your own pictures of this city and show them to the world
OSM Map
General Map
Google Map
MSN Map
OSM Map
General Map
Google Map
MSN Map
OSM Map
General Map
Google Map
MSN Map
OSM Map
General Map
Google Map
MSN Map
Please wait while loading the map...
Population in 2022: 7,708 (100% urban, 0% rural). Population change since 2000: +7.7%Males: 3,876 Females: 3,832
March 2022 cost of living index in Hudsonville: 85.0 (less than average, U.S. average is 100) Percentage of residents living in poverty in 2022: 4.3%for White Non-Hispanic residents , 25.8% for Black residents , 2.8% for two or more races residents )
Profiles of local businesses
Business Search - 14 Million verified businesses
Data:
Median household income ($)
Median household income (% change since 2000)
Household income diversity
Ratio of average income to average house value (%)
Ratio of average income to average rent
Median household income ($) - White
Median household income ($) - Black or African American
Median household income ($) - Asian
Median household income ($) - Hispanic or Latino
Median household income ($) - American Indian and Alaska Native
Median household income ($) - Multirace
Median household income ($) - Other Race
Median household income for houses/condos with a mortgage ($)
Median household income for apartments without a mortgage ($)
Races - White alone (%)
Races - White alone (% change since 2000)
Races - Black alone (%)
Races - Black alone (% change since 2000)
Races - American Indian alone (%)
Races - American Indian alone (% change since 2000)
Races - Asian alone (%)
Races - Asian alone (% change since 2000)
Races - Hispanic (%)
Races - Hispanic (% change since 2000)
Races - Native Hawaiian and Other Pacific Islander alone (%)
Races - Native Hawaiian and Other Pacific Islander alone (% change since 2000)
Races - Two or more races (%)
Races - Two or more races (% change since 2000)
Races - Other race alone (%)
Races - Other race alone (% change since 2000)
Racial diversity
Unemployment (%)
Unemployment (% change since 2000)
Unemployment (%) - White
Unemployment (%) - Black or African American
Unemployment (%) - Asian
Unemployment (%) - Hispanic or Latino
Unemployment (%) - American Indian and Alaska Native
Unemployment (%) - Multirace
Unemployment (%) - Other Race
Population density (people per square mile)
Population - Males (%)
Population - Females (%)
Population - Males (%) - White
Population - Males (%) - Black or African American
Population - Males (%) - Asian
Population - Males (%) - Hispanic or Latino
Population - Males (%) - American Indian and Alaska Native
Population - Males (%) - Multirace
Population - Males (%) - Other Race
Population - Females (%) - White
Population - Females (%) - Black or African American
Population - Females (%) - Asian
Population - Females (%) - Hispanic or Latino
Population - Females (%) - American Indian and Alaska Native
Population - Females (%) - Multirace
Population - Females (%) - Other Race
Coronavirus confirmed cases (Jun 10, 2024)
Deaths caused by coronavirus (Jun 10, 2024)
Coronavirus confirmed cases (per 100k population) (Jun 10, 2024)
Deaths caused by coronavirus (per 100k population) (Jun 10, 2024)
Daily increase in number of cases (Jun 10, 2024)
Weekly increase in number of cases (Jun 10, 2024)
Cases doubled (in days) (Jun 10, 2024)
Hospitalized patients (Apr 18, 2022)
Negative test results (Apr 18, 2022)
Total test results (Apr 18, 2022)
COVID Vaccine doses distributed (per 100k population) (Sep 19, 2023)
COVID Vaccine doses administered (per 100k population) (Sep 19, 2023)
COVID Vaccine doses distributed (Sep 19, 2023)
COVID Vaccine doses administered (Sep 19, 2023)
Likely homosexual households (%)
Likely homosexual households (% change since 2000)
Likely homosexual households - Lesbian couples (%)
Likely homosexual households - Lesbian couples (% change since 2000)
Likely homosexual households - Gay men (%)
Likely homosexual households - Gay men (% change since 2000)
Cost of living index
Median gross rent ($)
Median contract rent ($)
Median monthly housing costs ($)
Median house or condo value ($)
Median house or condo value ($ change since 2000)
Mean house or condo value by units in structure - 1, detached ($)
Mean house or condo value by units in structure - 1, attached ($)
Mean house or condo value by units in structure - 2 ($)
Mean house or condo value by units in structure by units in structure - 3 or 4 ($)
Mean house or condo value by units in structure - 5 or more ($)
Mean house or condo value by units in structure - Boat, RV, van, etc. ($)
Mean house or condo value by units in structure - Mobile home ($)
Median house or condo value ($) - White
Median house or condo value ($) - Black or African American
Median house or condo value ($) - Asian
Median house or condo value ($) - Hispanic or Latino
Median house or condo value ($) - American Indian and Alaska Native
Median house or condo value ($) - Multirace
Median house or condo value ($) - Other Race
Median resident age
Resident age diversity
Median resident age - Males
Median resident age - Females
Median resident age - White
Median resident age - Black or African American
Median resident age - Asian
Median resident age - Hispanic or Latino
Median resident age - American Indian and Alaska Native
Median resident age - Multirace
Median resident age - Other Race
Median resident age - Males - White
Median resident age - Males - Black or African American
Median resident age - Males - Asian
Median resident age - Males - Hispanic or Latino
Median resident age - Males - American Indian and Alaska Native
Median resident age - Males - Multirace
Median resident age - Males - Other Race
Median resident age - Females - White
Median resident age - Females - Black or African American
Median resident age - Females - Asian
Median resident age - Females - Hispanic or Latino
Median resident age - Females - American Indian and Alaska Native
Median resident age - Females - Multirace
Median resident age - Females - Other Race
Commute - mean travel time to work (minutes)
Travel time to work - Less than 5 minutes (%)
Travel time to work - Less than 5 minutes (% change since 2000)
Travel time to work - 5 to 9 minutes (%)
Travel time to work - 5 to 9 minutes (% change since 2000)
Travel time to work - 10 to 19 minutes (%)
Travel time to work - 10 to 19 minutes (% change since 2000)
Travel time to work - 20 to 29 minutes (%)
Travel time to work - 20 to 29 minutes (% change since 2000)
Travel time to work - 30 to 39 minutes (%)
Travel time to work - 30 to 39 minutes (% change since 2000)
Travel time to work - 40 to 59 minutes (%)
Travel time to work - 40 to 59 minutes (% change since 2000)
Travel time to work - 60 to 89 minutes (%)
Travel time to work - 60 to 89 minutes (% change since 2000)
Travel time to work - 90 or more minutes (%)
Travel time to work - 90 or more minutes (% change since 2000)
Marital status - Never married (%)
Marital status - Now married (%)
Marital status - Separated (%)
Marital status - Widowed (%)
Marital status - Divorced (%)
Median family income ($)
Median family income (% change since 2000)
Median non-family income ($)
Median non-family income (% change since 2000)
Median per capita income ($)
Median per capita income (% change since 2000)
Median family income ($) - White
Median family income ($) - Black or African American
Median family income ($) - Asian
Median family income ($) - Hispanic or Latino
Median family income ($) - American Indian and Alaska Native
Median family income ($) - Multirace
Median family income ($) - Other Race
Median year house/condo built
Median year apartment built
Year house built - Built 2005 or later (%)
Year house built - Built 2000 to 2004 (%)
Year house built - Built 1990 to 1999 (%)
Year house built - Built 1980 to 1989 (%)
Year house built - Built 1970 to 1979 (%)
Year house built - Built 1960 to 1969 (%)
Year house built - Built 1950 to 1959 (%)
Year house built - Built 1940 to 1949 (%)
Year house built - Built 1939 or earlier (%)
Average household size
Household density (households per square mile)
Average household size - White
Average household size - Black or African American
Average household size - Asian
Average household size - Hispanic or Latino
Average household size - American Indian and Alaska Native
Average household size - Multirace
Average household size - Other Race
Occupied housing units (%)
Vacant housing units (%)
Owner occupied housing units (%)
Renter occupied housing units (%)
Vacancy status - For rent (%)
Vacancy status - For sale only (%)
Vacancy status - Rented or sold, not occupied (%)
Vacancy status - For seasonal, recreational, or occasional use (%)
Vacancy status - For migrant workers (%)
Vacancy status - Other vacant (%)
Residents with income below the poverty level (%)
Residents with income below 50% of the poverty level (%)
Children below poverty level (%)
Poor families by family type - Married-couple family (%)
Poor families by family type - Male, no wife present (%)
Poor families by family type - Female, no husband present (%)
Poverty status for native-born residents (%)
Poverty status for foreign-born residents (%)
Poverty among high school graduates not in families (%)
Poverty among people who did not graduate high school not in families (%)
Residents with income below the poverty level (%) - White
Residents with income below the poverty level (%) - Black or African American
Residents with income below the poverty level (%) - Asian
Residents with income below the poverty level (%) - Hispanic or Latino
Residents with income below the poverty level (%) - American Indian and Alaska Native
Residents with income below the poverty level (%) - Multirace
Residents with income below the poverty level (%) - Other Race
Air pollution - Air Quality Index (AQI)
Air pollution - CO
Air pollution - NO2
Air pollution - SO2
Air pollution - Ozone
Air pollution - PM10
Air pollution - PM25
Air pollution - Pb
Crime - Murders per 100,000 population
Crime - Rapes per 100,000 population
Crime - Robberies per 100,000 population
Crime - Assaults per 100,000 population
Crime - Burglaries per 100,000 population
Crime - Thefts per 100,000 population
Crime - Auto thefts per 100,000 population
Crime - Arson per 100,000 population
Crime - City-data.com crime index
Crime - Violent crime index
Crime - Property crime index
Crime - Murders per 100,000 population (5 year average)
Crime - Rapes per 100,000 population (5 year average)
Crime - Robberies per 100,000 population (5 year average)
Crime - Assaults per 100,000 population (5 year average)
Crime - Burglaries per 100,000 population (5 year average)
Crime - Thefts per 100,000 population (5 year average)
Crime - Auto thefts per 100,000 population (5 year average)
Crime - Arson per 100,000 population (5 year average)
Crime - City-data.com crime index (5 year average)
Crime - Violent crime index (5 year average)
Crime - Property crime index (5 year average)
1996 Presidential Elections Results (%) - Democratic Party (Clinton)
1996 Presidential Elections Results (%) - Republican Party (Dole)
1996 Presidential Elections Results (%) - Other
2000 Presidential Elections Results (%) - Democratic Party (Gore)
2000 Presidential Elections Results (%) - Republican Party (Bush)
2000 Presidential Elections Results (%) - Other
2004 Presidential Elections Results (%) - Democratic Party (Kerry)
2004 Presidential Elections Results (%) - Republican Party (Bush)
2004 Presidential Elections Results (%) - Other
2008 Presidential Elections Results (%) - Democratic Party (Obama)
2008 Presidential Elections Results (%) - Republican Party (McCain)
2008 Presidential Elections Results (%) - Other
2012 Presidential Elections Results (%) - Democratic Party (Obama)
2012 Presidential Elections Results (%) - Republican Party (Romney)
2012 Presidential Elections Results (%) - Other
2016 Presidential Elections Results (%) - Democratic Party (Clinton)
2016 Presidential Elections Results (%) - Republican Party (Trump)
2016 Presidential Elections Results (%) - Other
2020 Presidential Elections Results (%) - Democratic Party (Biden)
2020 Presidential Elections Results (%) - Republican Party (Trump)
2020 Presidential Elections Results (%) - Other
Ancestries Reported - Arab (%)
Ancestries Reported - Czech (%)
Ancestries Reported - Danish (%)
Ancestries Reported - Dutch (%)
Ancestries Reported - English (%)
Ancestries Reported - French (%)
Ancestries Reported - French Canadian (%)
Ancestries Reported - German (%)
Ancestries Reported - Greek (%)
Ancestries Reported - Hungarian (%)
Ancestries Reported - Irish (%)
Ancestries Reported - Italian (%)
Ancestries Reported - Lithuanian (%)
Ancestries Reported - Norwegian (%)
Ancestries Reported - Polish (%)
Ancestries Reported - Portuguese (%)
Ancestries Reported - Russian (%)
Ancestries Reported - Scotch-Irish (%)
Ancestries Reported - Scottish (%)
Ancestries Reported - Slovak (%)
Ancestries Reported - Subsaharan African (%)
Ancestries Reported - Swedish (%)
Ancestries Reported - Swiss (%)
Ancestries Reported - Ukrainian (%)
Ancestries Reported - United States (%)
Ancestries Reported - Welsh (%)
Ancestries Reported - West Indian (%)
Ancestries Reported - Other (%)
Educational Attainment - No schooling completed (%)
Educational Attainment - Less than high school (%)
Educational Attainment - High school or equivalent (%)
Educational Attainment - Less than 1 year of college (%)
Educational Attainment - 1 or more years of college (%)
Educational Attainment - Associate degree (%)
Educational Attainment - Bachelor's degree (%)
Educational Attainment - Master's degree (%)
Educational Attainment - Professional school degree (%)
Educational Attainment - Doctorate degree (%)
School Enrollment - Nursery, preschool (%)
School Enrollment - Kindergarten (%)
School Enrollment - Grade 1 to 4 (%)
School Enrollment - Grade 5 to 8 (%)
School Enrollment - Grade 9 to 12 (%)
School Enrollment - College undergrad (%)
School Enrollment - Graduate or professional (%)
School Enrollment - Not enrolled in school (%)
School enrollment - Public schools (%)
School enrollment - Private schools (%)
School enrollment - Not enrolled (%)
Median number of rooms in houses and condos
Median number of rooms in apartments
Housing units lacking complete plumbing facilities (%)
Housing units lacking complete kitchen facilities (%)
Density of houses
Urban houses (%)
Rural houses (%)
Households with people 60 years and over (%)
Households with people 65 years and over (%)
Households with people 75 years and over (%)
Households with one or more nonrelatives (%)
Households with no nonrelatives (%)
Population in households (%)
Family households (%)
Nonfamily households (%)
Population in families (%)
Family households with own children (%)
Median number of bedrooms in owner occupied houses
Mean number of bedrooms in owner occupied houses
Median number of bedrooms in renter occupied houses
Mean number of bedrooms in renter occupied houses
Median number of vehichles in owner occupied houses
Mean number of vehichles in owner occupied houses
Median number of vehichles in renter occupied houses
Mean number of vehichles in renter occupied houses
Mortgage status - with mortgage (%)
Mortgage status - with second mortgage (%)
Mortgage status - with home equity loan (%)
Mortgage status - with both second mortgage and home equity loan (%)
Mortgage status - without a mortgage (%)
Average family size
Average family size - White
Average family size - Black or African American
Average family size - Asian
Average family size - Hispanic or Latino
Average family size - American Indian and Alaska Native
Average family size - Multirace
Average family size - Other Race
Geographical mobility - Same house 1 year ago (%)
Geographical mobility - Moved within same county (%)
Geographical mobility - Moved from different county within same state (%)
Geographical mobility - Moved from different state (%)
Geographical mobility - Moved from abroad (%)
Place of birth - Born in state of residence (%)
Place of birth - Born in other state (%)
Place of birth - Native, outside of US (%)
Place of birth - Foreign born (%)
Housing units in structures - 1, detached (%)
Housing units in structures - 1, attached (%)
Housing units in structures - 2 (%)
Housing units in structures - 3 or 4 (%)
Housing units in structures - 5 to 9 (%)
Housing units in structures - 10 to 19 (%)
Housing units in structures - 20 to 49 (%)
Housing units in structures - 50 or more (%)
Housing units in structures - Mobile home (%)
Housing units in structures - Boat, RV, van, etc. (%)
House/condo owner moved in on average (years ago)
Renter moved in on average (years ago)
Year householder moved into unit - Moved in 1999 to March 2000 (%)
Year householder moved into unit - Moved in 1995 to 1998 (%)
Year householder moved into unit - Moved in 1990 to 1994 (%)
Year householder moved into unit - Moved in 1980 to 1989 (%)
Year householder moved into unit - Moved in 1970 to 1979 (%)
Year householder moved into unit - Moved in 1969 or earlier (%)
Means of transportation to work - Drove car alone (%)
Means of transportation to work - Carpooled (%)
Means of transportation to work - Public transportation (%)
Means of transportation to work - Bus or trolley bus (%)
Means of transportation to work - Streetcar or trolley car (%)
Means of transportation to work - Subway or elevated (%)
Means of transportation to work - Railroad (%)
Means of transportation to work - Ferryboat (%)
Means of transportation to work - Taxicab (%)
Means of transportation to work - Motorcycle (%)
Means of transportation to work - Bicycle (%)
Means of transportation to work - Walked (%)
Means of transportation to work - Other means (%)
Working at home (%)
Industry diversity
Most Common Industries - Agriculture, forestry, fishing and hunting, and mining (%)
Most Common Industries - Agriculture, forestry, fishing and hunting (%)
Most Common Industries - Mining, quarrying, and oil and gas extraction (%)
Most Common Industries - Construction (%)
Most Common Industries - Manufacturing (%)
Most Common Industries - Wholesale trade (%)
Most Common Industries - Retail trade (%)
Most Common Industries - Transportation and warehousing, and utilities (%)
Most Common Industries - Transportation and warehousing (%)
Most Common Industries - Utilities (%)
Most Common Industries - Information (%)
Most Common Industries - Finance and insurance, and real estate and rental and leasing (%)
Most Common Industries - Finance and insurance (%)
Most Common Industries - Real estate and rental and leasing (%)
Most Common Industries - Professional, scientific, and management, and administrative and waste management services (%)
Most Common Industries - Professional, scientific, and technical services (%)
Most Common Industries - Management of companies and enterprises (%)
Most Common Industries - Administrative and support and waste management services (%)
Most Common Industries - Educational services, and health care and social assistance (%)
Most Common Industries - Educational services (%)
Most Common Industries - Health care and social assistance (%)
Most Common Industries - Arts, entertainment, and recreation, and accommodation and food services (%)
Most Common Industries - Arts, entertainment, and recreation (%)
Most Common Industries - Accommodation and food services (%)
Most Common Industries - Other services, except public administration (%)
Most Common Industries - Public administration (%)
Occupation diversity
Most Common Occupations - Management, business, science, and arts occupations (%)
Most Common Occupations - Management, business, and financial occupations (%)
Most Common Occupations - Management occupations (%)
Most Common Occupations - Business and financial operations occupations (%)
Most Common Occupations - Computer, engineering, and science occupations (%)
Most Common Occupations - Computer and mathematical occupations (%)
Most Common Occupations - Architecture and engineering occupations (%)
Most Common Occupations - Life, physical, and social science occupations (%)
Most Common Occupations - Education, legal, community service, arts, and media occupations (%)
Most Common Occupations - Community and social service occupations (%)
Most Common Occupations - Legal occupations (%)
Most Common Occupations - Education, training, and library occupations (%)
Most Common Occupations - Arts, design, entertainment, sports, and media occupations (%)
Most Common Occupations - Healthcare practitioners and technical occupations (%)
Most Common Occupations - Health diagnosing and treating practitioners and other technical occupations (%)
Most Common Occupations - Health technologists and technicians (%)
Most Common Occupations - Service occupations (%)
Most Common Occupations - Healthcare support occupations (%)
Most Common Occupations - Protective service occupations (%)
Most Common Occupations - Fire fighting and prevention, and other protective service workers including supervisors (%)
Most Common Occupations - Law enforcement workers including supervisors (%)
Most Common Occupations - Food preparation and serving related occupations (%)
Most Common Occupations - Building and grounds cleaning and maintenance occupations (%)
Most Common Occupations - Personal care and service occupations (%)
Most Common Occupations - Sales and office occupations (%)
Most Common Occupations - Sales and related occupations (%)
Most Common Occupations - Office and administrative support occupations (%)
Most Common Occupations - Natural resources, construction, and maintenance occupations (%)
Most Common Occupations - Farming, fishing, and forestry occupations (%)
Most Common Occupations - Construction and extraction occupations (%)
Most Common Occupations - Installation, maintenance, and repair occupations (%)
Most Common Occupations - Production, transportation, and material moving occupations (%)
Most Common Occupations - Production occupations (%)
Most Common Occupations - Transportation occupations (%)
Most Common Occupations - Material moving occupations (%)
People in Group quarters - Institutionalized population (%)
People in Group quarters - Correctional institutions (%)
People in Group quarters - Federal prisons and detention centers (%)
People in Group quarters - Halfway houses (%)
People in Group quarters - Local jails and other confinement facilities (including police lockups) (%)
People in Group quarters - Military disciplinary barracks (%)
People in Group quarters - State prisons (%)
People in Group quarters - Other types of correctional institutions (%)
People in Group quarters - Nursing homes (%)
People in Group quarters - Hospitals/wards, hospices, and schools for the handicapped (%)
People in Group quarters - Hospitals/wards and hospices for chronically ill (%)
People in Group quarters - Hospices or homes for chronically ill (%)
People in Group quarters - Military hospitals or wards for chronically ill (%)
People in Group quarters - Other hospitals or wards for chronically ill (%)
People in Group quarters - Hospitals or wards for drug/alcohol abuse (%)
People in Group quarters - Mental (Psychiatric) hospitals or wards (%)
People in Group quarters - Schools, hospitals, or wards for the mentally retarded (%)
People in Group quarters - Schools, hospitals, or wards for the physically handicapped (%)
People in Group quarters - Institutions for the deaf (%)
People in Group quarters - Institutions for the blind (%)
People in Group quarters - Orthopedic wards and institutions for the physically handicapped (%)
People in Group quarters - Wards in general hospitals for patients who have no usual home elsewhere (%)
People in Group quarters - Wards in military hospitals for patients who have no usual home elsewhere (%)
People in Group quarters - Juvenile institutions (%)
People in Group quarters - Long-term care (%)
People in Group quarters - Homes for abused, dependent, and neglected children (%)
People in Group quarters - Residential treatment centers for emotionally disturbed children (%)
People in Group quarters - Training schools for juvenile delinquents (%)
People in Group quarters - Short-term care, detention or diagnostic centers for delinquent children (%)
People in Group quarters - Type of juvenile institution unknown (%)
People in Group quarters - Noninstitutionalized population (%)
People in Group quarters - College dormitories (includes college quarters off campus) (%)
People in Group quarters - Military quarters (%)
People in Group quarters - On base (%)
People in Group quarters - Barracks, unaccompanied personnel housing (UPH), (Enlisted/Officer), ;and similar group living quarters for military personnel (%)
People in Group quarters - Transient quarters for temporary residents (%)
People in Group quarters - Military ships (%)
People in Group quarters - Group homes (%)
People in Group quarters - Homes or halfway houses for drug/alcohol abuse (%)
People in Group quarters - Homes for the mentally ill (%)
People in Group quarters - Homes for the mentally retarded (%)
People in Group quarters - Homes for the physically handicapped (%)
People in Group quarters - Other group homes (%)
People in Group quarters - Religious group quarters (%)
People in Group quarters - Dormitories (%)
People in Group quarters - Agriculture workers' dormitories on farms (%)
People in Group quarters - Job Corps and vocational training facilities (%)
People in Group quarters - Other workers' dormitories (%)
People in Group quarters - Crews of maritime vessels (%)
People in Group quarters - Other nonhousehold living situations (%)
People in Group quarters - Other noninstitutional group quarters (%)
Residents speaking English at home (%)
Residents speaking English at home - Born in the United States (%)
Residents speaking English at home - Native, born elsewhere (%)
Residents speaking English at home - Foreign born (%)
Residents speaking Spanish at home (%)
Residents speaking Spanish at home - Born in the United States (%)
Residents speaking Spanish at home - Native, born elsewhere (%)
Residents speaking Spanish at home - Foreign born (%)
Residents speaking other language at home (%)
Residents speaking other language at home - Born in the United States (%)
Residents speaking other language at home - Native, born elsewhere (%)
Residents speaking other language at home - Foreign born (%)
Class of Workers - Employee of private company (%)
Class of Workers - Self-employed in own incorporated business (%)
Class of Workers - Private not-for-profit wage and salary workers (%)
Class of Workers - Local government workers (%)
Class of Workers - State government workers (%)
Class of Workers - Federal government workers (%)
Class of Workers - Self-employed workers in own not incorporated business and Unpaid family workers (%)
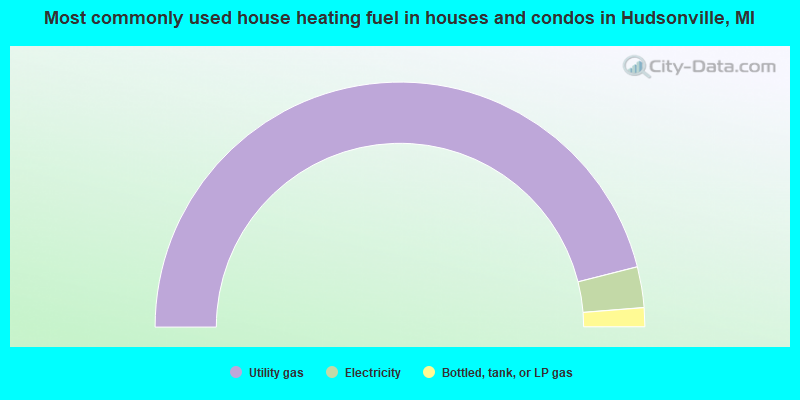
House heating fuel used in houses and condos - Utility gas (%)
House heating fuel used in houses and condos - Bottled, tank, or LP gas (%)
House heating fuel used in houses and condos - Electricity (%)
House heating fuel used in houses and condos - Fuel oil, kerosene, etc. (%)
House heating fuel used in houses and condos - Coal or coke (%)
House heating fuel used in houses and condos - Wood (%)
House heating fuel used in houses and condos - Solar energy (%)
House heating fuel used in houses and condos - Other fuel (%)
House heating fuel used in houses and condos - No fuel used (%)
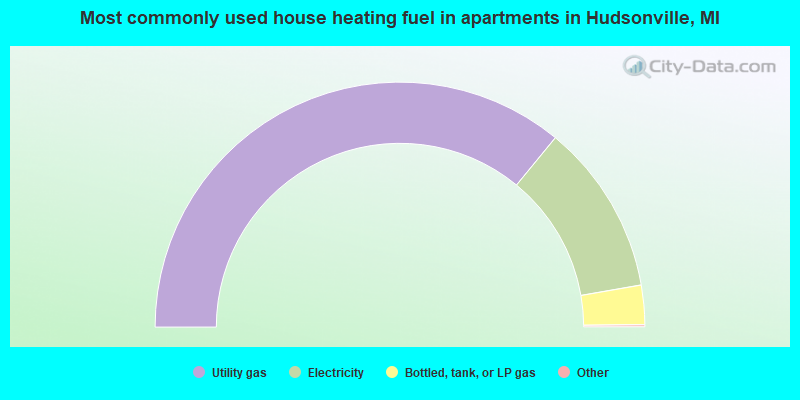
House heating fuel used in apartments - Utility gas (%)
House heating fuel used in apartments - Bottled, tank, or LP gas (%)
House heating fuel used in apartments - Electricity (%)
House heating fuel used in apartments - Fuel oil, kerosene, etc. (%)
House heating fuel used in apartments - Coal or coke (%)
House heating fuel used in apartments - Wood (%)
House heating fuel used in apartments - Solar energy (%)
House heating fuel used in apartments - Other fuel (%)
House heating fuel used in apartments - No fuel used (%)
Armed forces status - In Armed Forces (%)
Armed forces status - Civilian (%)
Armed forces status - Civilian - Veteran (%)
Armed forces status - Civilian - Nonveteran (%)
Fatal accidents locations in years 2005-2021
Fatal accidents locations in 2005
Fatal accidents locations in 2006
Fatal accidents locations in 2007
Fatal accidents locations in 2008
Fatal accidents locations in 2009
Fatal accidents locations in 2010
Fatal accidents locations in 2011
Fatal accidents locations in 2012
Fatal accidents locations in 2013
Fatal accidents locations in 2014
Fatal accidents locations in 2015
Fatal accidents locations in 2016
Fatal accidents locations in 2017
Fatal accidents locations in 2018
Fatal accidents locations in 2019
Fatal accidents locations in 2020
Fatal accidents locations in 2021
Alcohol use - People drinking some alcohol every month (%)
Alcohol use - People not drinking at all (%)
Alcohol use - Average days/month drinking alcohol
Alcohol use - Average drinks/week
Alcohol use - Average days/year people drink much
Audiometry - Average condition of hearing (%)
Audiometry - People that can hear a whisper from across a quiet room (%)
Audiometry - People that can hear normal voice from across a quiet room (%)
Audiometry - Ears ringing, roaring, buzzing (%)
Audiometry - Had a job exposure to loud noise (%)
Audiometry - Had off-work exposure to loud noise (%)
Blood Pressure & Cholesterol - Has high blood pressure (%)
Blood Pressure & Cholesterol - Checking blood pressure at home (%)
Blood Pressure & Cholesterol - Frequently checking blood cholesterol (%)
Blood Pressure & Cholesterol - Has high cholesterol level (%)
Consumer Behavior - Money monthly spent on food at supermarket/grocery store
Consumer Behavior - Money monthly spent on food at other stores
Consumer Behavior - Money monthly spent on eating out
Consumer Behavior - Money monthly spent on carryout/delivered foods
Consumer Behavior - Income spent on food at supermarket/grocery store (%)
Consumer Behavior - Income spent on food at other stores (%)
Consumer Behavior - Income spent on eating out (%)
Consumer Behavior - Income spent on carryout/delivered foods (%)
Current Health Status - General health condition (%)
Current Health Status - Blood donors (%)
Current Health Status - Has blood ever tested for HIV virus (%)
Current Health Status - Left-handed people (%)
Dermatology - People using sunscreen (%)
Diabetes - Diabetics (%)
Diabetes - Had a blood test for high blood sugar (%)
Diabetes - People taking insulin (%)
Diet Behavior & Nutrition - Diet health (%)
Diet Behavior & Nutrition - Milk product consumption (# of products/month)
Diet Behavior & Nutrition - Meals not home prepared (#/week)
Diet Behavior & Nutrition - Meals from fast food or pizza place (#/week)
Diet Behavior & Nutrition - Ready-to-eat foods (#/month)
Diet Behavior & Nutrition - Frozen meals/pizza (#/month)
Drug Use - People that ever used marijuana or hashish (%)
Drug Use - Ever used hard drugs (%)
Drug Use - Ever used any form of cocaine (%)
Drug Use - Ever used heroin (%)
Drug Use - Ever used methamphetamine (%)
Health Insurance - People covered by health insurance (%)
Kidney Conditions-Urology - Avg. # of times urinating at night
Medical Conditions - People with asthma (%)
Medical Conditions - People with anemia (%)
Medical Conditions - People with psoriasis (%)
Medical Conditions - People with overweight (%)
Medical Conditions - Elderly people having difficulties in thinking or remembering (%)
Medical Conditions - People who ever received blood transfusion (%)
Medical Conditions - People having trouble seeing even with glass/contacts (%)
Medical Conditions - People with arthritis (%)
Medical Conditions - People with gout (%)
Medical Conditions - People with congestive heart failure (%)
Medical Conditions - People with coronary heart disease (%)
Medical Conditions - People with angina pectoris (%)
Medical Conditions - People who ever had heart attack (%)
Medical Conditions - People who ever had stroke (%)
Medical Conditions - People with emphysema (%)
Medical Conditions - People with thyroid problem (%)
Medical Conditions - People with chronic bronchitis (%)
Medical Conditions - People with any liver condition (%)
Medical Conditions - People who ever had cancer or malignancy (%)
Mental Health - People who have little interest in doing things (%)
Mental Health - People feeling down, depressed, or hopeless (%)
Mental Health - People who have trouble sleeping or sleeping too much (%)
Mental Health - People feeling tired or having little energy (%)
Mental Health - People with poor appetite or overeating (%)
Mental Health - People feeling bad about themself (%)
Mental Health - People who have trouble concentrating on things (%)
Mental Health - People moving or speaking slowly or too fast (%)
Mental Health - People having thoughts they would be better off dead (%)
Oral Health - Average years since last visit a dentist
Oral Health - People embarrassed because of mouth (%)
Oral Health - People with gum disease (%)
Oral Health - General health of teeth and gums (%)
Oral Health - Average days a week using dental floss/device
Oral Health - Average days a week using mouthwash for dental problem
Oral Health - Average number of teeth
Pesticide Use - Households using pesticides to control insects (%)
Pesticide Use - Households using pesticides to kill weeds (%)
Physical Activity - People doing vigorous-intensity work activities (%)
Physical Activity - People doing moderate-intensity work activities (%)
Physical Activity - People walking or bicycling (%)
Physical Activity - People doing vigorous-intensity recreational activities (%)
Physical Activity - People doing moderate-intensity recreational activities (%)
Physical Activity - Average hours a day doing sedentary activities
Physical Activity - Average hours a day watching TV or videos
Physical Activity - Average hours a day using computer
Physical Functioning - People having limitations keeping them from working (%)
Physical Functioning - People limited in amount of work they can do (%)
Physical Functioning - People that need special equipment to walk (%)
Physical Functioning - People experiencing confusion/memory problems (%)
Physical Functioning - People requiring special healthcare equipment (%)
Prescription Medications - Average number of prescription medicines taking
Preventive Aspirin Use - Adults 40+ taking low-dose aspirin (%)
Reproductive Health - Vaginal deliveries (%)
Reproductive Health - Cesarean deliveries (%)
Reproductive Health - Deliveries resulted in a live birth (%)
Reproductive Health - Pregnancies resulted in a delivery (%)
Reproductive Health - Women breastfeeding newborns (%)
Reproductive Health - Women that had a hysterectomy (%)
Reproductive Health - Women that had both ovaries removed (%)
Reproductive Health - Women that have ever taken birth control pills (%)
Reproductive Health - Women taking birth control pills (%)
Reproductive Health - Women that have ever used Depo-Provera or injectables (%)
Reproductive Health - Women that have ever used female hormones (%)
Sexual Behavior - People 18+ that ever had sex (vaginal, anal, or oral) (%)
Sexual Behavior - Males 18+ that ever had vaginal sex with a woman (%)
Sexual Behavior - Males 18+ that ever performed oral sex on a woman (%)
Sexual Behavior - Males 18+ that ever had anal sex with a woman (%)
Sexual Behavior - Males 18+ that ever had any sex with a man (%)
Sexual Behavior - Females 18+ that ever had vaginal sex with a man (%)
Sexual Behavior - Females 18+ that ever performed oral sex on a man (%)
Sexual Behavior - Females 18+ that ever had anal sex with a man (%)
Sexual Behavior - Females 18+ that ever had any kind of sex with a woman (%)
Sexual Behavior - Average age people first had sex
Sexual Behavior - Average number of female sex partners in lifetime (males 18+)
Sexual Behavior - Average number of female vaginal sex partners in lifetime (males 18+)
Sexual Behavior - Average age people first performed oral sex on a woman (18+)
Sexual Behavior - Average number of woman performed oral sex on in lifetime (18+)
Sexual Behavior - Average number of male sex partners in lifetime (males 18+)
Sexual Behavior - Average number of male anal sex partners in lifetime (males 18+)
Sexual Behavior - Average age people first performed oral sex on a man (18+)
Sexual Behavior - Average number of male oral sex partners in lifetime (18+)
Sexual Behavior - People using protection when performing oral sex (%)
Sexual Behavior - Average number of times people have vaginal or anal sex a year
Sexual Behavior - People having sex without condom (%)
Sexual Behavior - Average number of male sex partners in lifetime (females 18+)
Sexual Behavior - Average number of male vaginal sex partners in lifetime (females 18+)
Sexual Behavior - Average number of female sex partners in lifetime (females 18+)
Sexual Behavior - Circumcised males 18+ (%)
Sleep Disorders - Average hours sleeping at night
Sleep Disorders - People that has trouble sleeping (%)
Smoking-Cigarette Use - People smoking cigarettes (%)
Taste & Smell - People 40+ having problems with smell (%)
Taste & Smell - People 40+ having problems with taste (%)
Taste & Smell - People 40+ that ever had wisdom teeth removed (%)
Taste & Smell - People 40+ that ever had tonsils teeth removed (%)
Taste & Smell - People 40+ that ever had a loss of consciousness because of a head injury (%)
Taste & Smell - People 40+ that ever had a broken nose or other serious injury to face or skull (%)
Taste & Smell - People 40+ that ever had two or more sinus infections (%)
Weight - Average height (inches)
Weight - Average weight (pounds)
Weight - Average BMI
Weight - People that are obese (%)
Weight - People that ever were obese (%)
Weight - People trying to lose weight (%)
Latest news from Hudsonville, MI collected exclusively by city-data.com from local newspapers, TV, and radio stations
Ancestries: Dutch (58.2%), German (5.6%), Italian (5.5%), American (5.4%), English (4.5%), Polish (2.3%).
Current Local Time:
Land area: 4.14 square miles.
Population density: 1,861 people per square mile (low).
239 residents are foreign born (1.5% Europe , 1.2% Asia , 0.4% Africa ).
This city:
3.1%Michigan:
6.9%
Median real estate property taxes paid for housing units with mortgages in 2022: $3,211 (1.1%)Median real estate property taxes paid for housing units with no mortgage in 2022: $2,584 (1.0%)
Nearest city with pop. 50,000+: Wyoming, MI
Nearest city with pop. 200,000+: Milwaukee, WI
Nearest city with pop. 1,000,000+: Chicago, IL
Nearest cities:
Latitude: 42.87 N, Longitude: 85.86 W
Daytime population change due to commuting: +1,960 (+25.3%)Workers who live and work in this city: 739 (20.0%)
Single-family new house construction building permits:
2022: 29 buildings , average cost: $235,9002021: 22 buildings , average cost: $278,5002020: 32 buildings , average cost: $234,0002019: 30 buildings , average cost: $234,0002018: 3 buildings , average cost: $289,0002017: 13 buildings , average cost: $242,9002016: 12 buildings , average cost: $242,9002015: 9 buildings , average cost: $232,4002013: 7 buildings , average cost: $114,0002012: 13 buildings , average cost: $139,2002011: 3 buildings , average cost: $171,8002010: 4 buildings , average cost: $171,8002009: 4 buildings , average cost: $171,8002008: 5 buildings , average cost: $199,6002007: 8 buildings , average cost: $80,1002006: 9 buildings , average cost: $202,5002005: 10 buildings , average cost: $160,5002004: 12 buildings , average cost: $153,5002003: 8 buildings , average cost: $143,5002002: 15 buildings , average cost: $138,4002001: 5 buildings , average cost: $123,8002000: 8 buildings , average cost: $142,5001999: 6 buildings , average cost: $179,7001998: 8 buildings , average cost: $155,3001997: 15 buildings , average cost: $124,300Unemployment in December 2023:
Population change in the 1990s: +931 (+14.9%).
Most common occupations in Hudsonville, MI (%)
Both Males Females
Other production occupations, including supervisors (6.8%)
Laborers and material movers, hand (5.3%)
Metal workers and plastic workers (4.4%)
Other office and administrative support workers, including supervisors (4.2%)
Preschool, kindergarten, elementary, and middle school teachers (3.8%)
Sales representatives, services, wholesale and manufacturing (3.5%)
Secretaries and administrative assistants (3.0%)
Other production occupations, including supervisors (7.8%)
Laborers and material movers, hand (7.5%)
Metal workers and plastic workers (4.6%)
Driver/sales workers and truck drivers (4.3%)
Preschool, kindergarten, elementary, and middle school teachers (3.8%)
Electrical equipment mechanics and other installation, maintenance, and repair workers, including supervisors (3.6%)
Sales representatives, services, wholesale and manufacturing (3.6%)
Secretaries and administrative assistants (6.6%)
Other office and administrative support workers, including supervisors (5.8%)
Other production occupations, including supervisors (5.6%)
Health technologists and technicians (4.7%)
Metal workers and plastic workers (4.0%)
Waiters and waitresses (4.0%)
Preschool, kindergarten, elementary, and middle school teachers (3.8%)
Tornado activity:
Hudsonville-area historical tornado activity is near Michigan state average. It is 2% smaller than the overall U.S. average.
On 4/3/1956, a category F5 (max. wind speeds 261-318 mph) tornado 22.6 miles away from the Hudsonville city center killed 18 people and injured 340 people and caused between $50,000 and $500,000 in damages.
On 4/11/1965, a category F4 (max. wind speeds 207-260 mph) tornado 11.1 miles away from the city center killed 5 people and injured 142 people and caused between $500,000 and $5,000,000 in damages.
Earthquake activity:
Hudsonville-area historical earthquake activity is significantly above Michigan state average. It is 22% smaller than the overall U.S. average. On 5/2/2015 at 16:23:07, a magnitude 4.2 (4.2 MW, Depth: 2.8 mi, Class: Light, Intensity: IV - V) earthquake occurred 48.8 miles away from the city center On 4/18/2008 at 09:36:59, a magnitude 5.4 (5.1 MB, 4.8 MS, 5.4 MW, 5.2 MW, Class: Moderate, Intensity: VI - VII) earthquake occurred 323.1 miles away from the city center On 1/31/1986 at 16:46:43, a magnitude 5.0 (5.0 MB) earthquake occurred 256.2 miles away from Hudsonville center On 9/25/1998 at 19:52:52, a magnitude 5.2 (4.8 MB, 4.3 MS, 5.2 LG, 4.5 MW, Depth: 3.1 mi) earthquake occurred 295.8 miles away from the city center On 7/12/1986 at 08:19:37, a magnitude 4.5 (4.5 MB) earthquake occurred 178.5 miles away from Hudsonville center On 6/10/1987 at 23:48:54, a magnitude 5.1 (4.9 MB, 4.4 MS, 4.6 MS, 5.1 LG) earthquake occurred 299.0 miles away from the city center Magnitude types: regional Lg-wave magnitude (LG), body-wave magnitude (MB), surface-wave magnitude (MS), moment magnitude (MW) Natural disasters: The number of natural disasters in Ottawa County (15) is near the US average (15).Major Disasters (Presidential) Declared: 9Emergencies Declared: 5Storms: 8, Floods: 7, Tornadoes: 4, Snowstorms: 2, Winds: 2, Winter Storms: 2, Blizzard: 1, Hurricane: 1, Other: 1 (Note: some incidents may be assigned to more than one category). Hospitals and medical centers in Hudsonville: LAURELS OF HUDSONVILLE (THE) (3650 VAN BUREN)
Other hospitals and medical centers near Hudsonville: SUNSET HOME SERVICES (Home Health Center, about 5 miles away; JENISON, MI)
BROOKCREST (Nursing Home, about 6 miles away; GRANDVILLE, MI)
COMMUNITY CARE GIVERS (Home Health Center, about 7 miles away; GRANDVILLE, MI)
CARE ONE HOME HEALTH SERVICES, INC (Home Health Center, about 7 miles away; WYOMING, MI)
SPECTRUM HEALTH ZEELAND COMMUNITY HOSPITAL (about 8 miles away; ZEELAND, MI)
ALLENDALE NURSING AND REHABILITATION COMMUNITY (Nursing Home, about 8 miles away; ALLENDALE, MI)
HERITAGE NURSING AND REHABILITATION COMMUNITY (Nursing Home, about 9 miles away; ZEELAND, MI)
Airports located in Hudsonville: Amtrak stations near Hudsonville: 12 miles: GRAND RAPIDS (MARKET & WEALTHY STS.) Services: enclosed waiting area, public restrooms, public payphones, free short-term parking, free long-term parking, call for taxi service, public transit connection.
14 miles: HOLLAND (171 LINCOLN AVE.) Services: enclosed waiting area, public payphones, vending machines, free short-term parking, free long-term parking, call for taxi service, intercity bus service.
Colleges/universities with over 2000 students nearest to Hudsonville:
Grand Valley State University (about 8 miles; Allendale, MI ; Full-time enrollment: 21,982)
Grand Rapids Community College (about 13 miles; Grand Rapids, MI ; FT enrollment: 11,296)
Hope College (about 14 miles; Holland, MI ; FT enrollment: 3,535)
Calvin College (about 15 miles; Grand Rapids, MI ; FT enrollment: 4,117)
Cornerstone University (about 16 miles; Grand Rapids, MI ; FT enrollment: 2,573)
Davenport University (about 17 miles; Grand Rapids, MI ; FT enrollment: 6,955)
Baker College of Muskegon (about 32 miles; Muskegon, MI ; FT enrollment: 3,293)
Public high schools in Hudsonville:
Private high schools in Hudsonville: UNITY CHRISTIAN HIGH SCHOOL Students: 725, Location: 3487 OAK ST, Grades: 9-12)
HERITAGE CHRISTIAN SCHOOL Students: 471, Location: 4900 40TH AVE, Grades: UG-9)
FREEDOM CHRISTIAN SCHOOLS Students: 267, Location: 6340 AUTUMN DR, Grades: KG-12)
Public elementary/middle schools in Hudsonville: BALDWIN STREET MIDDLE SCHOOL Students: 742, Location: 3835 BALDWIN ST, Grades: 6-8)GEORGETOWN ELEMENTARY SCHOOL Students: 525, Location: 3909 BALDWIN ST, Grades: PK-5)ALWARD ELEMENTARY SCHOOL Students: 464, Location: 3811 PORT SHELDON ST, Grades: PK-5)RILEY STREET MIDDLE SCHOOL Students: 458, Location: 2745 RILEY ST, Grades: 6-8)BAUER ELEMENTARY SCHOOL Students: 366, Location: 8136 48TH AVE, Grades: PK-5)PARK ELEMEMENTARY SCHOOL Students: 349, Location: 5525 PARK AVE, Grades: KG-5)FOREST GROVE ELEMENTARY SCHOOL Students: 241, Location: 1645 32ND AVE, Grades: PK-5)SOUTH ELEMENTARY SCHOOL Location: 2522 GREENLY ST, Grades: PK-5)
Private elementary/middle schools in Hudsonville: HUDSONVILLE CHRISTIAN SCHOOL Students: 841, Location: 3435 OAK ST, Grades: PK-8)
BEAVERDAM CHRISTIAN SCHOOL Students: 60, Location: 5181 64TH AVE, Grades: KG-8)
See full list of schools located in Hudsonville Library in Hudsonville: GARY BYKER MEMORIAL LIBRARY OF HUDSONVILLE Operating income: $327,471; Location: 3338 VAN BUREN STREET; 48,513 books ; 3,624 audio materials ; 4,466 video materials ; 101 print serial subscriptions )
Notable locations in Hudsonville: (A) , Summergreen Golf Course (B) , Hudsonville Fairgrounds (C) , Hudsonville Library (D) , Hudsonville Fire Department (E) , Hudsonville Police Department (F) . Display/hide their locations on the map
Churches in Hudsonville include: (A) , Messiah Christian Reformed Church (B) , Hillcrest Christian Reformed Church (C) , Immanuel Christian Reformed Church (D) , Trinity Protestant Reformed Church (E) , Harvest Baptist Church (F) , First Christian Reformed Church (G) , Grace Community Church (H) , Hudsonville Reformed Church (I) . Display/hide their locations on the map
Parks in Hudsonville include: (1) , Sunrise Park (2) , Hillside Park (3) , Hudsonville Nature Center (4) , Hughes Park (5) . Display/hide their locations on the map
Hotel:
Birthplace of: Kyle Clement - Football player.
Ottawa County has a predicted average indoor radon screening level less than 2 pCi/L (pico curies per liter) - Low Potential Drinking water stations with addresses in Hudsonville and their reported violations in the past:
JAMESTOWN CHRISTIAN REFORM CHU (Population served: 150, Groundwater):
Past monitoring violations:
One routine major monitoring violation
One regular monitoring violation
Population served: 100, Groundwater):
Past monitoring violations:
One routine major monitoring violation
One regular monitoring violation
Population served: 40, Groundwater):
Past monitoring violations:
One routine major monitoring violation
Population served: 30, Groundwater):
Past monitoring violations:
3 routine major monitoring violations
One regular monitoring violation
Address: 5009 40th Ave. Population served: 30, Groundwater):
Past monitoring violations:
One routine major monitoring violation
One regular monitoring violation
Drinking water stations with addresses in Hudsonville that have no violations reported:
NORTH BLENDON CHRISTIAN REFORMED CHURCH (Population served: 300, Primary Water Source Type: Groundwater)
NORTH BLENDON REFORMED CHURCH (Population served: 200, Primary Water Source Type: Groundwater)
Average household size: This city:
2.7 peopleMichigan:
2.5 people
Percentage of family households: This city:
73.6%Whole state:
66.0%
Percentage of households with unmarried partners: This city:
3.7%Whole state:
6.4%
Likely homosexual households (counted as self-reported same-sex unmarried-partner households)
Lesbian couples: 0.1% of all households Gay men: 0.2% of all households
110 people in nursing facilities/skilled-nursing facilities in 2010people in group homes intended for adults in 2010people in other noninstitutional group quarters in 2000
Banks with branches in Hudsonville (2011 data):
The Huntington National Bank: Hudsonville Branch, Hudsonville Branch, Hudsonville Branch. Info updated 2012/04/02: Bank assets: $54,183.4 mil, Deposits: $44,300.3 mil, headquarters in Columbus, OH, positive income , Commercial Lending Specialization, 878 total offices , Holding Company: Huntington Bancshares Incorporated
West Michigan Community Bank: Hudsonville Corporate Office at 5367 School Avenue, branch established on 2011/08/01; at 3467-3469 Kelly Street, branch established on 1976/07/21. Info updated 2011/07/12: Bank assets: $119.3 mil, Deposits: $103.3 mil, local headquarters , negative income in the last year , Commercial Lending Specialization, 6 total offices
Fifth Third Bank: Hudsonville Branch at 2855 Port Sheldon Street, branch established on 1993/07/21. Info updated 2009/10/05: Bank assets: $114,540.4 mil, Deposits: $89,689.1 mil, headquarters in Cincinnati, OH, positive income , Commercial Lending Specialization, 1378 total offices , Holding Company: Fifth Third Bancorp
Macatawa Bank: Hudsonville Branch at 3526 Chicago Drive, branch established on 2001/11/05. Info updated 2011/07/20: Bank assets: $1,506.0 mil, Deposits: $1,225.8 mil, headquarters in Holland, MI, positive income , Commercial Lending Specialization, 30 total offices , Holding Company: Macatawa Bank Corporation
Flagstar Bank, FSB: Hudsonville Branch at 4675 32nd Avenue, Suite 110, branch established on 1999/03/11. Info updated 2011/07/21: Bank assets: $13,623.5 mil, Deposits: $7,802.8 mil, headquarters in Troy, MI, negative income in the last year , Mortgage Lending Specialization, 135 total offices
Chemical Bank: Hudsonville Branch at 4595-32nd Avenue, branch established on 1991/06/03. Info updated 2010/07/30: Bank assets: $5,331.9 mil, Deposits: $4,367.1 mil, headquarters in Midland, MI, positive income , Commercial Lending Specialization, 146 total offices , Holding Company: Chemical Financial Corporation
For population 15 years and over in Hudsonville:
Never married: 23.1%Now married: 60.0%Separated: 0.4%Widowed: 5.5%Divorced: 11.1% For population 25 years and over in Hudsonville:
High school or higher: 96.1%Bachelor's degree or higher: 32.9%Graduate or professional degree: 10.4%Unemployed: 4.6%Mean travel time to work (commute): 18.9 minutes
Education Gini index (Inequality in education) Here:
8.9Michigan average:
11.0
Religion statistics for Hudsonville, MI (based on Ottawa County data)
Religion Adherents Congregations Evangelical Protestant 71,034 194 Mainline Protestant 41,597 64 Catholic 24,710 11 Other 1,845 12 None 124,615 -
Source: Clifford Grammich, Kirk Hadaway, Richard Houseal, Dale E.Jones, Alexei Krindatch, Richie Stanley and Richard H.Taylor. 2012. 2010 U.S.Religion Census: Religious Congregations & Membership Study. Association of Statisticians of American Religious Bodies. Jones, Dale E., et al. 2002. Congregations and Membership in the United States 2000. Nashville, TN: Glenmary Research Center. Graphs represent county-level data
Food Environment Statistics: Number of grocery stores : 35Ottawa County :
1.35 / 10,000 pop.Michigan :
2.34 / 10,000 pop.
Number of supercenters and club stores : 6Ottawa County :
0.23 / 10,000 pop.Michigan :
0.18 / 10,000 pop.
Number of convenience stores (no gas) : 16This county :
0.62 / 10,000 pop.Michigan :
1.52 / 10,000 pop.
Number of convenience stores (with gas) : 58Ottawa County :
2.24 / 10,000 pop.Michigan :
2.99 / 10,000 pop.
Number of full-service restaurants : 134Ottawa County :
5.18 / 10,000 pop.Michigan :
6.80 / 10,000 pop.
Adult diabetes rate : Ottawa County :
8.3%Michigan :
9.7%
Low-income preschool obesity rate : Ottawa County :
10.7%Michigan :
13.4%
Health and Nutrition:
Average overall health of teeth and gums : Average BMI : This city:
28.7Michigan:
28.7
People feeling badly about themselves : This city:
20.0%Michigan:
20.6%
People not drinking alcohol at all : Hudsonville:
9.7%Michigan:
10.4%
Average hours sleeping at night : General health condition : This city:
56.3%State:
57.0%
Average condition of hearing : Hudsonville:
78.0%Michigan:
79.6%
More about Health and Nutrition of Hudsonville, MI Residents
Local government employment and payroll (March 2022)
Function
Full-time employees
Monthly full-time payroll
Average yearly full-time wage
Part-time employees
Monthly part-time payroll
Streets and Highways
7 $36,265 $62,169 0 $0 Other Government Administration
5 $30,931 $74,234 0 $0 Financial Administration
3 $11,826 $47,304 0 $0 Parks and Recreation
2 $8,145 $48,870 1 $122 Other and Unallocable
2 $8,433 $50,598 5 $3,663 Water Supply
1 $6,342 $76,104 0 $0 Local Libraries
1 $6,096 $73,152 12 $12,847 Housing and Community Development (Local)
1 $5,350 $64,200 0 $0 Firefighters
0 $0 4 $2,779
Totals for Government
22 $113,387 $61,847 22 $19,410
Hudsonville government finances - Expenditure in 2021 (per resident):
Current Operations - Sewerage: $1,534,000 ($199.01)
Regular Highways: $1,530,000 ($198.50)General - Other: $1,212,000 ($157.24)Police Protection: $747,000 ($96.91)Central Staff Services: $637,000 ($82.64)Libraries: $459,000 ($59.55)Parks and Recreation: $387,000 ($50.21)Financial Administration: $284,000 ($36.84)General Public Buildings: $258,000 ($33.47)Local Fire Protection: $203,000 ($26.34)Judicial and Legal Services: $20,000 ($2.59)General - Interest on Debt: $176,000 ($22.83)
Other Capital Outlay - Regular Highways: $770,000 ($99.90)
Water Utilities: $336,000 ($43.59)Parks and Recreation: $131,000 ($17.00)Sewerage: $109,000 ($14.14)General - Other: $96,000 ($12.45)Libraries: $75,000 ($9.73)Total Salaries and Wages: $1,516,000 ($196.68)
Hudsonville government finances - Revenue in 2021 (per resident):
Charges - Sewerage: $1,442,000 ($187.08)
Other: $50,000 ($6.49)Parks and Recreation: $15,000 ($1.95)Federal Intergovernmental - Other: $32,000 ($4.15)
Local Intergovernmental - Other: $92,000 ($11.94)
Miscellaneous - Interest Earnings: $147,000 ($19.07)
General Revenue - Other: $140,000 ($18.16)Donations From Private Sources: $50,000 ($6.49)Rents: $50,000 ($6.49)Fines and Forfeits: $47,000 ($6.10)Revenue - Water Utilities: $1,064,000 ($138.04)
State Intergovernmental - Highways: $1,062,000 ($137.78)
General Local Government Support: $735,000 ($95.36)Other: $383,000 ($49.69)Tax - Property: $3,043,000 ($394.78)
Occupation and Business License - Other: $190,000 ($24.65)Other License: $76,000 ($9.86)Other Selective Sales: $2,000 ($0.26)
Hudsonville government finances - Debt in 2021 (per resident):
Long Term Debt - Beginning Outstanding - Unspecified Public Purpose: $4,475,000 ($580.57)
Outstanding Unspecified Public Purpose: $4,280,000 ($555.27)Retired Unspecified Public Purpose: $195,000 ($25.30)
Hudsonville government finances - Cash and Securities in 2021 (per resident):
Other Funds - Cash and Securities: $5,895,000 ($764.79)
Businesses in Hudsonville, MI
Name Count Name Count
Arby's 1 Little Caesars Pizza 1 Blockbuster 1 McDonald's 1 Burger King 1 Pizza Hut 1 Chevrolet 1 Quality 1 FedEx 2 Sprint Nextel 2 H&R Block 1 Subway 3 Jimmy John's 1 Super 8 1 Jones New York 1 U-Haul 2 Lane Furniture 1 UPS 4
Strongest AM radio stations in Hudsonville:
WOOD (1300 AM; 20 kW; GRAND RAPIDS, MI; Owner: CLEAR CHANNEL BROADCASTING LICENSES, INC.)
WMFN (640 AM; 1 kW; ZEELAND, MI; Owner: BIRACH BROADCASTING CORPORATION)
WPNW (1260 AM; 10 kW; ZEELAND, MI; Owner: LANSER BROADCASTING CORPORATION)
WGVU (1480 AM; 5 kW; KENTWOOD, MI; Owner: GRAND VALLEY STATE UNIVERSITY B OF C)
WJNZ (1140 AM; daytime; 5 kW; KENTWOOD, MI; Owner: GOODRICH RADIO, LLC)
WMJH (810 AM; daytime; 4 kW; ROCKFORD, MI)
WBBL (1340 AM; 1 kW; GRAND RAPIDS, MI; Owner: CITADEL BROADCASTING COMPANY)
WYGR (1530 AM; daytime; 0 kW; WYOMING, MI; Owner: WYGR BROADCASTING)
WOAP (1080 AM; 50 kW; OWOSSO, MI)
WFUR (1570 AM; 1 kW; GRAND RAPIDS, MI)
WTMJ (620 AM; 50 kW; MILWAUKEE, WI; Owner: JOURNAL BROADCAST CORPORATION)
WKZO (590 AM; 5 kW; KALAMAZOO, MI; Owner: FAIRFIELD BROADCASTING COMPANY)
WTKG (1230 AM; 1 kW; GRAND RAPIDS, MI; Owner: CLEAR CHANNEL BROADCASTING LICENSES, INC.)
Strongest FM radio stations in Hudsonville:
WVTI (96.1 FM; HOLLAND, MI; Owner: CLEAR CHANNEL BROADCASTING LICENSES, INC.)
WKLQ (94.5 FM; HOLLAND, MI; Owner: CITADEL BROADCASTING COMPANY)
WGNB (89.3 FM; ZEELAND, MI; Owner: THE MOODY BIBLE INSTITUTE OF CHICAGO)
WFUR-FM (102.9 FM; GRAND RAPIDS, MI; Owner: FURNITURE CITY BROADCASTING CORP.)
WGRD-FM (97.9 FM; GRAND RAPIDS, MI; Owner: REGENT BROADCASTING OF GRAND RAPIDS, INC.)
WCSG (91.3 FM; GRAND RAPIDS, MI; Owner: CORNERSTONE UNIVERSITY.)
WJQK (99.3 FM; ZEELAND, MI; Owner: BEACON BC/ING CO. OF WEST MICHIGAN)
WLHT-FM (95.7 FM; GRAND RAPIDS, MI; Owner: REGENT BROADCASTING OF GRAND RAPIDS, INC.)
WOOD-FM (105.7 FM; GRAND RAPIDS, MI; Owner: CLEAR CHANNEL BROADCASTING LICENSES, INC.)
WFGR (98.7 FM; GRAND RAPIDS, MI; Owner: REGENT BROADCASTING OF GRAND RAPIDS, INC.)
W214AY (90.7 FM; WALKER, MI; Owner: CALVARY CHAPEL OF TWIN FALLS, INC.)
WBCT (93.7 FM; GRAND RAPIDS, MI; Owner: CLEAR CHANNEL BROADCASTING LICENSES, INC.)
WBFX (101.3 FM; GRAND RAPIDS, MI; Owner: CLEAR CHANNEL BROADCASTING LICENSES, INC.)
WVGR (104.1 FM; GRAND RAPIDS, MI; Owner: REGENTS OF THE UNIVERSITY OF MICHIGAN)
WTRV (100.5 FM; WALKER, MI; Owner: REGENT BROADCASTING OF GRAND RAPIDS, INC.)
WBLU-FM (88.9 FM; GRAND RAPIDS, MI; Owner: BLUE LAKE FINE ARTS CAMP)
WZUU (92.3 FM; ALLEGAN, MI; Owner: FORUM COMMUNICATIONS, INC.)
WGVU-FM (88.5 FM; ALLENDALE, MI; Owner: BD OF CONTROL,GRAND VALLEY ST UNIV.)
WSNX-FM (104.5 FM; MUSKEGON, MI; Owner: CLEAR CHANNEL BROADCASTING LICENSES, INC.)
WLAV-FM (96.9 FM; GRAND RAPIDS, MI; Owner: CITADEL BROADCASTING COMPANY)
TV broadcast stations around Hudsonville:
WTLJ (Channel 54; MUSKEGON, MI; Owner: TCT OF MICHIGAN, INC.)
WGVU-TV (Channel 35; GRAND RAPIDS, MI; Owner: GRAND VALLEY STATE UNIVERSITY)
WUHQ-LP (Channel 29; GRAND RAPIDS, MI; Owner: P & P CABLE HOLDINGS, L.L.C.)
WWMT (Channel 3; KALAMAZOO, MI; Owner: FREEDOM BROADCASTING OF MICHIGAN, INC.)
WXMI (Channel 17; GRAND RAPIDS, MI; Owner: TRIBUNE TELEVISION HOLDINGS, INC.)
WOOD-TV (Channel 8; GRAND RAPIDS, MI; Owner: WOOD LICENSE COMPANY, LLC)
W44BQ (Channel 44; MOUNT PLEASANT, MI; Owner: NTN/SAGINAW, INC.)
WXSP-CA (Channel 15; GRAND RAPIDS, MI; Owner: WOOD LICENSE COMPANY, LLC)
WLLA (Channel 64; KALAMAZOO, MI; Owner: CHRISTIAN FAITH BROADCAST, INC.)
W48CL (Channel 48; GRAND RAPIDS, MI; Owner: THREE ANGELS BROADCASTING NETWORK)
WOTV (Channel 41; BATTLE CREEK, MI; Owner: WOOD LICENSE COMPANY, LLC)
WZZM-TV (Channel 13; GRAND RAPIDS, MI; Owner: COMBINED COMMUNICATIONS CORP. OF OKLAHOMA, INC.)
WOGC-CA (Channel 25; GRAND RAPIDS, MI; Owner: WOOD LICENSE COMPANY, LLC)
WZPX (Channel 43; BATTLE CREEK, MI; Owner: PAXSON BATTLE CREEK LICENSE, INC.)
WOHO-CA (Channel 33; HOLLAND, MI; Owner: WOOD LICENSE COMPANY, LLC)
WOLP-CA (Channel 27; GRAND RAPIDS, MI; Owner: WOOD LICENSE COMPANY, LLC)
WOMS-CA (Channel 29; MUSKEGON, MI; Owner: WOOD LICENSE COMPANY, LLC)
W19BA (Channel 19; GRAND RAPIDS, MI; Owner: TRINITY BROADCASTING NETWORK)
W67DN (Channel 67; HOUGHTON LAKE, MI; Owner: MS COMMUNICATIONS, LLC)
Hudsonville fatal accident statistics for 1975 - 2021
Hudsonville fatal accident list:
Feb 1, 2019 07:03 PM, I-196, Lat: 42.847853, Lon: -85.867617, Vehicles: 3, Persons: 3, Fatalities: 1Lat: 42.845294, Lon: -85.859719, Vehicles: 1, Persons: 1, Fatalities: 1, Drunk persons involved: 1Lat: 42.849064, Lon: -85.860653, Vehicles: 1, Persons: 1, Fatalities: 1Lat: 42.855347, Lon: -85.878214, Vehicles: 2, Persons: 2, Fatalities: 1Vehicles: 1, Persons: 1, Fatalities: 1Lat: 42.850158, Lon: -85.854597, Vehicles: 1, Persons: 7, Fatalities: 1
National Bridge Inventory (NBI) Statistics 37 Number of bridges240ft / 73.3m Total length $68,000 Total costs1,901,299 Total average daily traffic32,411 Total average daily truck traffic
New bridges - historical statistics
2 1940-1949 19 1970-1979 2 1980-1989 3 1990-1999 10 2000-2009 1 2010-2019
See full National Bridge Inventory statistics for Hudsonville, MI
Home Mortgage Disclosure Act Aggregated Statistics For Year 2009(Based on 1 partial tract) A) FHA, FSA/RHS & VA B) Conventional C) Refinancings D) Home Improvement Loans F) Non-occupant Loans on G) Loans On Manufactured Number Average Value Number Average Value Number Average Value Number Average Value Number Average Value Number Average Value
LOANS ORIGINATED 32 $112,337 38 $80,735 120 $116,611 4 $37,232 5 $146,704 4 $21,815 APPLICATIONS APPROVED, NOT ACCEPTED 1 $144,340 6 $54,018 15 $153,221 0 $0 0 $0 5 $29,918 APPLICATIONS DENIED 4 $135,812 6 $93,275 35 $118,473 4 $36,578 1 $80,040 2 $38,380 APPLICATIONS WITHDRAWN 3 $103,227 2 $128,925 22 $132,592 1 $5,250 1 $135,160 0 $0 FILES CLOSED FOR INCOMPLETENESS 1 $62,990 2 $89,230 6 $111,100 0 $0 1 $94,480 0 $0
Aggregated Statistics For Year 2008(Based on 1 partial tract) A) FHA, FSA/RHS & VA B) Conventional C) Refinancings D) Home Improvement Loans F) Non-occupant Loans on G) Loans On Manufactured Number Average Value Number Average Value Number Average Value Number Average Value Number Average Value Number Average Value
LOANS ORIGINATED 16 $115,022 41 $105,824 73 $132,218 10 $21,389 6 $100,930 1 $1,970 APPLICATIONS APPROVED, NOT ACCEPTED 1 $43,960 6 $98,962 8 $117,688 1 $5,250 1 $105,630 1 $66,270 APPLICATIONS DENIED 3 $122,910 7 $118,660 39 $141,045 5 $20,732 1 $161,400 0 $0 APPLICATIONS WITHDRAWN 0 $0 1 $118,100 14 $160,885 0 $0 0 $0 0 $0 FILES CLOSED FOR INCOMPLETENESS 0 $0 1 $121,380 3 $192,237 1 $4,590 0 $0 0 $0
Aggregated Statistics For Year 2007(Based on 1 partial tract) A) FHA, FSA/RHS & VA B) Conventional C) Refinancings D) Home Improvement Loans F) Non-occupant Loans on G) Loans On Manufactured Number Average Value Number Average Value Number Average Value Number Average Value Number Average Value Number Average Value
LOANS ORIGINATED 3 $135,813 93 $109,428 71 $121,397 9 $21,287 7 $194,769 3 $32,150 APPLICATIONS APPROVED, NOT ACCEPTED 0 $0 5 $111,144 25 $124,869 1 $13,120 3 $173,430 0 $0 APPLICATIONS DENIED 2 $136,470 14 $94,713 65 $133,976 9 $25,004 7 $131,594 1 $73,480 APPLICATIONS WITHDRAWN 0 $0 7 $112,849 28 $115,544 1 $8,530 2 $68,235 0 $0 FILES CLOSED FOR INCOMPLETENESS 0 $0 1 $89,230 7 $158,401 0 $0 1 $153,530 0 $0
Aggregated Statistics For Year 2006(Based on 1 partial tract) A) FHA, FSA/RHS & VA B) Conventional C) Refinancings D) Home Improvement Loans F) Non-occupant Loans on G) Loans On Manufactured Number Average Value Number Average Value Number Average Value Number Average Value Number Average Value Number Average Value
LOANS ORIGINATED 5 $138,568 127 $100,518 115 $97,280 21 $23,807 9 $123,201 3 $56,423 APPLICATIONS APPROVED, NOT ACCEPTED 0 $0 16 $108,872 22 $113,565 1 $11,810 0 $0 2 $43,630 APPLICATIONS DENIED 0 $0 19 $93,132 48 $130,919 7 $40,397 5 $117,836 7 $24,650 APPLICATIONS WITHDRAWN 1 $67,580 9 $119,191 33 $139,610 3 $70,640 1 $165,340 1 $52,490 FILES CLOSED FOR INCOMPLETENESS 0 $0 3 $82,670 22 $115,056 1 $18,370 1 $86,610 1 $38,050
Aggregated Statistics For Year 2005(Based on 1 partial tract) A) FHA, FSA/RHS & VA B) Conventional C) Refinancings D) Home Improvement Loans F) Non-occupant Loans on G) Loans On Manufactured Number Average Value Number Average Value Number Average Value Number Average Value Number Average Value Number Average Value
LOANS ORIGINATED 3 $113,943 125 $112,770 129 $117,905 20 $36,840 3 $109,130 4 $34,118 APPLICATIONS APPROVED, NOT ACCEPTED 1 $63,640 9 $107,747 15 $127,371 0 $0 1 $6,560 1 $18,370 APPLICATIONS DENIED 1 $9,190 21 $76,014 56 $124,026 5 $21,782 1 $124,660 9 $35,794 APPLICATIONS WITHDRAWN 0 $0 20 $70,432 39 $132,583 3 $70,860 1 $32,810 1 $14,430 FILES CLOSED FOR INCOMPLETENESS 0 $0 2 $94,805 7 $156,433 0 $0 1 $90,540 0 $0
Aggregated Statistics For Year 2004(Based on 1 partial tract) A) FHA, FSA/RHS & VA B) Conventional C) Refinancings D) Home Improvement Loans E) Loans on Dwellings For 5+ Families F) Non-occupant Loans on G) Loans On Manufactured Number Average Value Number Average Value Number Average Value Number Average Value Number Average Value Number Average Value Number Average Value
LOANS ORIGINATED 8 $126,299 142 $124,909 114 $112,861 14 $34,820 1 $4,408,340 4 $97,430 3 $25,150 APPLICATIONS APPROVED, NOT ACCEPTED 2 $104,975 15 $104,276 20 $126,988 2 $12,140 0 $0 1 $32,810 3 $37,180 APPLICATIONS DENIED 1 $194,860 20 $90,345 43 $98,476 9 $43,376 0 $0 1 $105,630 10 $38,119 APPLICATIONS WITHDRAWN 0 $0 7 $114,817 27 $109,131 5 $15,616 0 $0 2 $106,290 1 $5,250 FILES CLOSED FOR INCOMPLETENESS 0 $0 3 $139,530 16 $138,765 1 $36,090 0 $0 0 $0 0 $0
Aggregated Statistics For Year 2003(Based on 1 partial tract) A) FHA, FSA/RHS & VA B) Conventional C) Refinancings D) Home Improvement Loans E) Loans on Dwellings For 5+ Families F) Non-occupant Loans on Number Average Value Number Average Value Number Average Value Number Average Value Number Average Value Number Average Value
LOANS ORIGINATED 7 $115,943 131 $115,113 444 $108,590 10 $47,108 1 $534,720 16 $105,837 APPLICATIONS APPROVED, NOT ACCEPTED 2 $103,665 16 $111,906 35 $116,280 3 $15,527 0 $0 2 $83,325 APPLICATIONS DENIED 3 $118,097 23 $57,280 67 $108,981 5 $16,272 0 $0 1 $34,770 APPLICATIONS WITHDRAWN 0 $0 7 $112,474 43 $108,653 1 $17,060 0 $0 0 $0 FILES CLOSED FOR INCOMPLETENESS 0 $0 6 $119,628 12 $118,208 1 $65,610 0 $0 0 $0
Aggregated Statistics For Year 2002(Based on 1 partial tract) A) FHA, FSA/RHS & VA B) Conventional C) Refinancings D) Home Improvement Loans E) Loans on Dwellings For 5+ Families F) Non-occupant Loans on Number Average Value Number Average Value Number Average Value Number Average Value Number Average Value Number Average Value
LOANS ORIGINATED 12 $128,212 115 $103,527 319 $104,332 12 $27,556 1 $91,850 7 $118,099 APPLICATIONS APPROVED, NOT ACCEPTED 0 $0 10 $65,741 25 $99,360 2 $9,515 0 $0 0 $0 APPLICATIONS DENIED 0 $0 35 $51,401 50 $89,361 5 $30,312 0 $0 1 $6,560 APPLICATIONS WITHDRAWN 1 $66,920 9 $116,057 33 $116,229 1 $16,400 0 $0 0 $0 FILES CLOSED FOR INCOMPLETENESS 0 $0 1 $121,380 7 $139,374 0 $0 0 $0 0 $0
Aggregated Statistics For Year 2001(Based on 1 partial tract) A) FHA, FSA/RHS & VA B) Conventional C) Refinancings D) Home Improvement Loans F) Non-occupant Loans on Number Average Value Number Average Value Number Average Value Number Average Value Number Average Value
LOANS ORIGINATED 12 $114,982 92 $95,006 255 $102,913 21 $24,494 5 $93,822 APPLICATIONS APPROVED, NOT ACCEPTED 0 $0 17 $83,556 23 $91,911 2 $20,010 0 $0 APPLICATIONS DENIED 1 $80,040 26 $35,253 46 $80,016 6 $30,290 2 $84,635 APPLICATIONS WITHDRAWN 1 $78,730 5 $142,504 28 $108,350 1 $19,680 0 $0 FILES CLOSED FOR INCOMPLETENESS 0 $0 2 $101,695 12 $96,884 0 $0 0 $0
Aggregated Statistics For Year 2000(Based on 1 partial tract) A) FHA, FSA/RHS & VA B) Conventional C) Refinancings D) Home Improvement Loans F) Non-occupant Loans on Number Average Value Number Average Value Number Average Value Number Average Value Number Average Value
LOANS ORIGINATED 9 $109,641 104 $92,725 59 $87,272 22 $24,425 4 $74,632 APPLICATIONS APPROVED, NOT ACCEPTED 1 $63,640 22 $49,834 16 $69,916 4 $23,782 1 $26,240 APPLICATIONS DENIED 1 $163,370 72 $43,339 26 $60,588 12 $29,088 5 $41,596 APPLICATIONS WITHDRAWN 1 $51,830 5 $131,876 15 $93,166 1 $64,300 1 $114,160 FILES CLOSED FOR INCOMPLETENESS 1 $76,110 2 $142,045 5 $108,256 0 $0 0 $0
Aggregated Statistics For Year 1999(Based on 1 partial tract) A) FHA, FSA/RHS & VA B) Conventional C) Refinancings D) Home Improvement Loans F) Non-occupant Loans on Number Average Value Number Average Value Number Average Value Number Average Value Number Average Value
LOANS ORIGINATED 11 $106,256 122 $88,421 99 $82,875 20 $18,140 5 $116,882 APPLICATIONS APPROVED, NOT ACCEPTED 1 $58,180 28 $51,362 16 $62,796 3 $16,123 6 $36,825 APPLICATIONS DENIED 0 $0 69 $40,425 31 $58,938 7 $31,284 2 $23,535 APPLICATIONS WITHDRAWN 1 $55,560 7 $54,630 15 $91,954 3 $59,923 0 $0 FILES CLOSED FOR INCOMPLETENESS 0 $0 2 $78,445 12 $83,510 1 $5,230 1 $72,560
Detailed HMDA statistics for the following Tracts:
0218.00
Private Mortgage Insurance Companies Aggregated Statistics For Year 2009(Based on 1 partial tract) A) Conventional B) Refinancings Number Average Value Number Average Value
LOANS ORIGINATED 7 $98,977 2 $107,270 APPLICATIONS APPROVED, NOT ACCEPTED 1 $76,110 1 $104,980 APPLICATIONS DENIED 1 $57,740 1 $104,980 APPLICATIONS WITHDRAWN 1 $39,370 0 $0 FILES CLOSED FOR INCOMPLETENESS 0 $0 0 $0
Aggregated Statistics For Year 2008(Based on 1 partial tract) A) Conventional B) Refinancings C) Non-occupant Loans on Number Average Value Number Average Value Number Average Value
LOANS ORIGINATED 19 $118,271 10 $143,161 1 $69,550 APPLICATIONS APPROVED, NOT ACCEPTED 5 $127,020 5 $126,364 0 $0 APPLICATIONS DENIED 2 $107,930 0 $0 0 $0 APPLICATIONS WITHDRAWN 0 $0 0 $0 0 $0 FILES CLOSED FOR INCOMPLETENESS 0 $0 0 $0 0 $0
Aggregated Statistics For Year 2007(Based on 1 partial tract) A) Conventional B) Refinancings C) Non-occupant Loans on Number Average Value Number Average Value Number Average Value
LOANS ORIGINATED 33 $125,832 6 $154,622 1 $95,130 APPLICATIONS APPROVED, NOT ACCEPTED 3 $160,090 3 $190,927 1 $150,900 APPLICATIONS DENIED 0 $0 1 $80,700 0 $0 APPLICATIONS WITHDRAWN 1 $64,950 1 $95,790 0 $0 FILES CLOSED FOR INCOMPLETENESS 0 $0 0 $0 0 $0
Aggregated Statistics For Year 2006(Based on 1 partial tract) A) Conventional B) Refinancings Number Average Value Number Average Value
LOANS ORIGINATED 19 $129,252 5 $154,970 APPLICATIONS APPROVED, NOT ACCEPTED 3 $102,570 3 $141,280 APPLICATIONS DENIED 0 $0 0 $0 APPLICATIONS WITHDRAWN 0 $0 1 $110,220 FILES CLOSED FOR INCOMPLETENESS 0 $0 1 $85,290
Aggregated Statistics For Year 2005(Based on 1 partial tract) A) Conventional B) Refinancings Number Average Value Number Average Value
LOANS ORIGINATED 24 $139,421 9 $160,161 APPLICATIONS APPROVED, NOT ACCEPTED 5 $130,302 1 $228,980 APPLICATIONS DENIED 0 $0 0 $0 APPLICATIONS WITHDRAWN 1 $87,920 1 $113,510 FILES CLOSED FOR INCOMPLETENESS 0 $0 0 $0
Aggregated Statistics For Year 2004(Based on 1 partial tract) A) Conventional B) Refinancings C) Non-occupant Loans on Number Average Value Number Average Value Number Average Value
LOANS ORIGINATED 22 $132,115 8 $134,336 1 $77,420 APPLICATIONS APPROVED, NOT ACCEPTED 6 $135,813 1 $77,420 0 $0 APPLICATIONS DENIED 0 $0 0 $0 0 $0 APPLICATIONS WITHDRAWN 1 $91,850 1 $194,860 0 $0 FILES CLOSED FOR INCOMPLETENESS 0 $0 1 $98,420 0 $0
Aggregated Statistics For Year 2003(Based on 1 partial tract) A) Conventional B) Refinancings C) Non-occupant Loans on Number Average Value Number Average Value Number Average Value
LOANS ORIGINATED 36 $122,727 35 $122,541 1 $117,440 APPLICATIONS APPROVED, NOT ACCEPTED 3 $130,347 9 $114,380 0 $0 APPLICATIONS DENIED 0 $0 1 $72,170 0 $0 APPLICATIONS WITHDRAWN 0 $0 2 $128,270 0 $0 FILES CLOSED FOR INCOMPLETENESS 0 $0 0 $0 0 $0
Aggregated Statistics For Year 2002(Based on 1 partial tract) A) Conventional B) Refinancings C) Non-occupant Loans on Number Average Value Number Average Value Number Average Value
LOANS ORIGINATED 28 $118,004 29 $121,627 3 $101,477 APPLICATIONS APPROVED, NOT ACCEPTED 1 $104,320 5 $119,278 0 $0 APPLICATIONS DENIED 0 $0 0 $0 0 $0 APPLICATIONS WITHDRAWN 2 $124,005 0 $0 0 $0 FILES CLOSED FOR INCOMPLETENESS 0 $0 0 $0 0 $0
Aggregated Statistics For Year 2001(Based on 1 partial tract) A) Conventional B) Refinancings C) Non-occupant Loans on Number Average Value Number Average Value Number Average Value
LOANS ORIGINATED 33 $126,269 28 $117,348 1 $196,830 APPLICATIONS APPROVED, NOT ACCEPTED 5 $138,438 5 $115,604 0 $0 APPLICATIONS DENIED 0 $0 0 $0 0 $0 APPLICATIONS WITHDRAWN 0 $0 0 $0 0 $0 FILES CLOSED FOR INCOMPLETENESS 0 $0 0 $0 0 $0
Aggregated Statistics For Year 2000(Based on 1 partial tract) A) Conventional B) Refinancings Number Average Value Number Average Value
LOANS ORIGINATED 24 $106,862 5 $119,148 APPLICATIONS APPROVED, NOT ACCEPTED 3 $96,227 2 $144,340 APPLICATIONS DENIED 0 $0 0 $0 APPLICATIONS WITHDRAWN 1 $286,720 0 $0 FILES CLOSED FOR INCOMPLETENESS 0 $0 0 $0
Aggregated Statistics For Year 1999(Based on 1 partial tract) A) Conventional B) Refinancings C) Non-occupant Loans on Number Average Value Number Average Value Number Average Value
LOANS ORIGINATED 31 $107,818 9 $100,379 1 $55,560 APPLICATIONS APPROVED, NOT ACCEPTED 2 $123,220 3 $116,577 0 $0 APPLICATIONS DENIED 0 $0 1 $58,180 0 $0 APPLICATIONS WITHDRAWN 1 $68,640 0 $0 0 $0 FILES CLOSED FOR INCOMPLETENESS 0 $0 0 $0 0 $0
Detailed PMIC statistics for the following Tracts:
0218.00
Fire-safe hotels and motels in Hudsonville, Michigan:
Amerihost Inn Hudsonville, 3301 Highland Dr, Hudsonville, Michigan 49426 Phone: (616) 662-4000, Fax: (616) 662-5000
Super 8 Hudsonville, 3005 Corporate Grove Dr, Hudsonville, Michigan 49426 Phone: (616) 896-6710, Fax: (616) 896-9958
All 2 fire-safe hotels and motels in Hudsonville, Michigan
Most common first names in Hudsonville, MI among deceased individuals Name Count Lived (average)
John 125 79.6 years Henry 52 78.0 years Robert 49 68.6 years Peter 40 80.1 years Gertrude 38 83.2 years William 38 75.4 years George 37 81.0 years James 37 74.7 years Albert 31 79.5 years Anna 31 85.1 years
Most common last names in Hudsonville, MI among deceased individuals Last name Count Lived (average)
Schut 28 77.5 years Vruggink 23 78.4 years Hoezee 18 78.8 years Devries 14 79.8 years Timmer 14 73.7 years Vanderkolk 12 72.8 years Smith 12 81.5 years Meyer 12 75.7 years Dykstra 12 83.8 years Veltema 12 81.7 years
Hudsonville compared to Michigan state average:
Unemployed percentage significantly below state average. Black race population percentage significantly below state average. Median age below state average. Foreign-born population percentage below state average. Renting percentage below state average. Length of stay since moving in significantly above state average. House age below state average.
Top Patent Applicants
Jason M. Hipshier (24)
Joel A. Stray (23)
Roger A. Vandenberg (19)
David C. Eberlein (16)
Gregory A. Huizen (15)
Richard R. Hook (14)
John J. Janik (13)
Roger Veldman (13)
Kenton J. Ypma (13)
Jeffrey A. Forgette (13)
Total of 462 patent applications in 2008-2024.

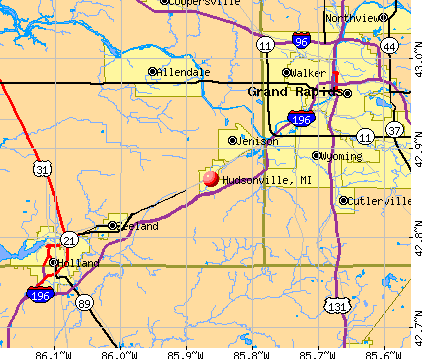


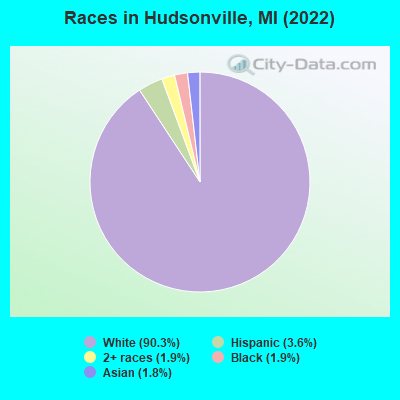
 Recent articles from our blog. Our writers, many of them Ph.D. graduates or candidates, create easy-to-read articles on a wide variety of topics.

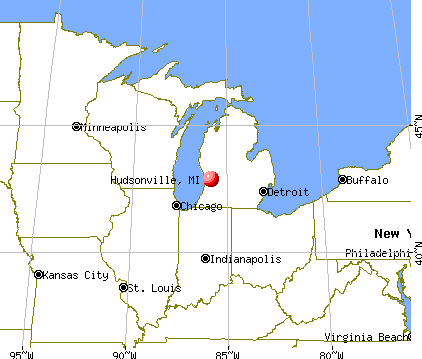
 (8.7 miles
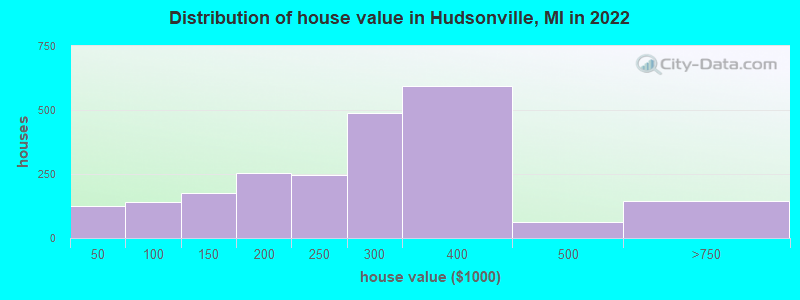

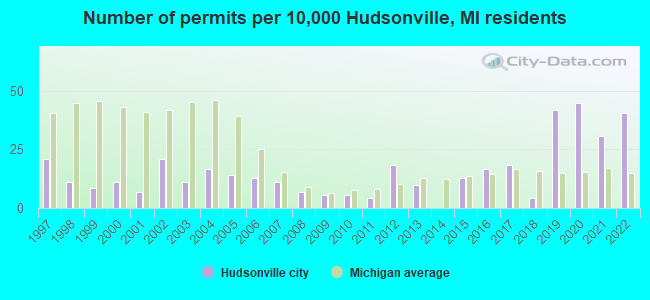
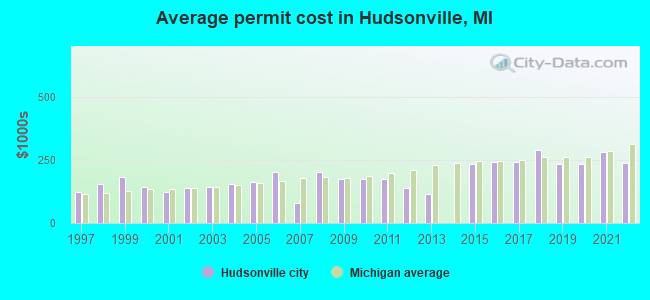
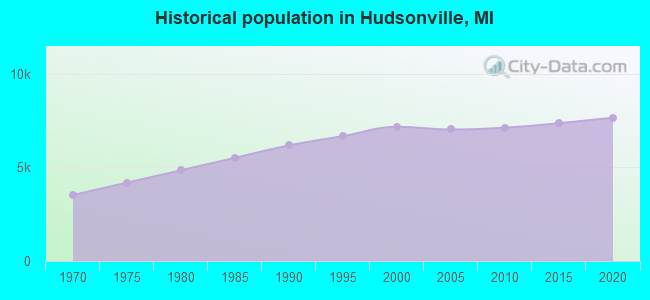
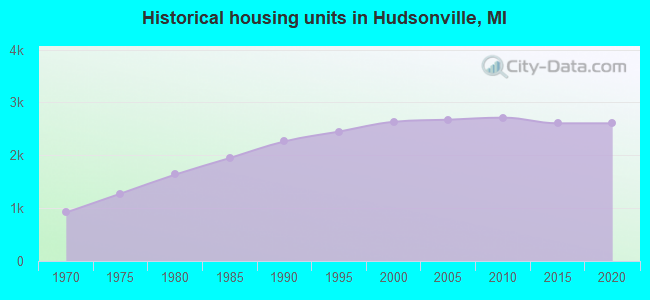
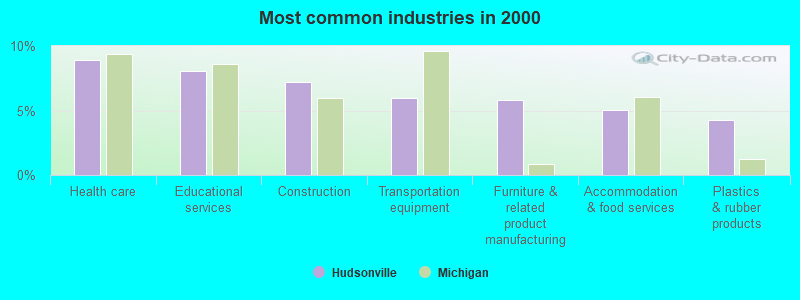
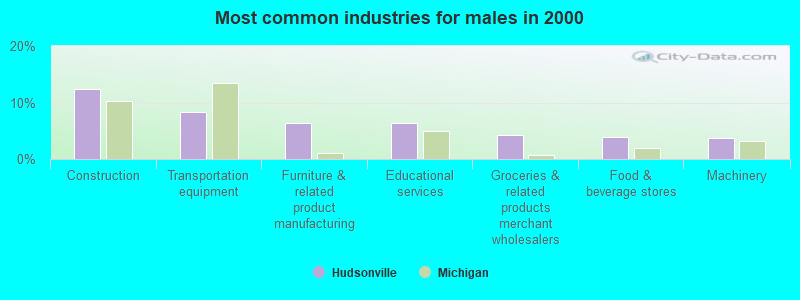
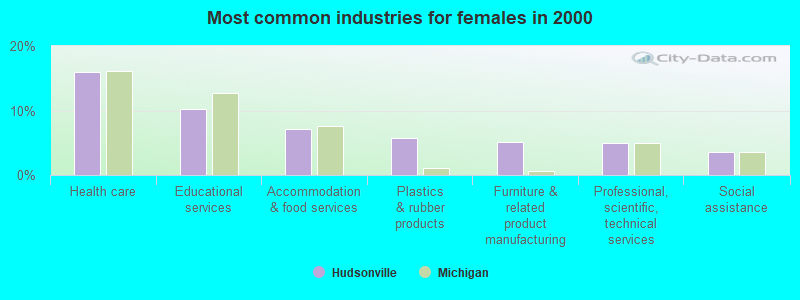
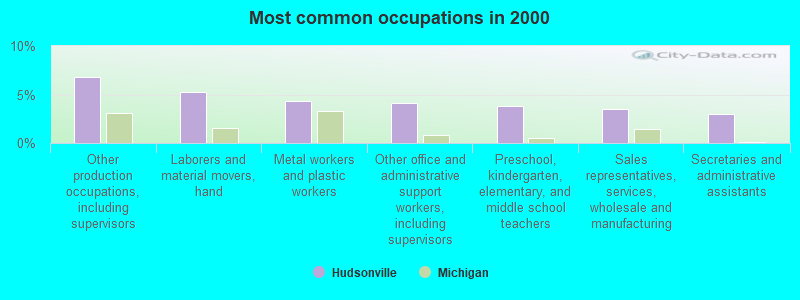
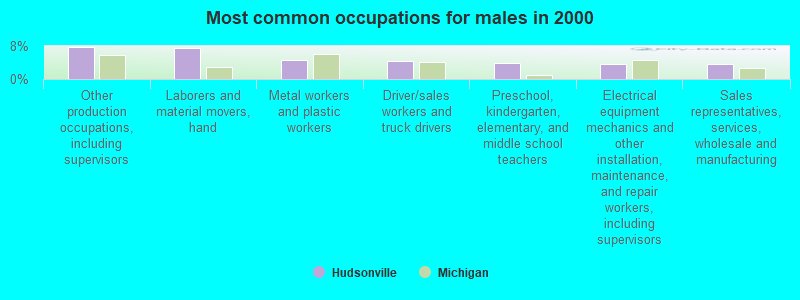
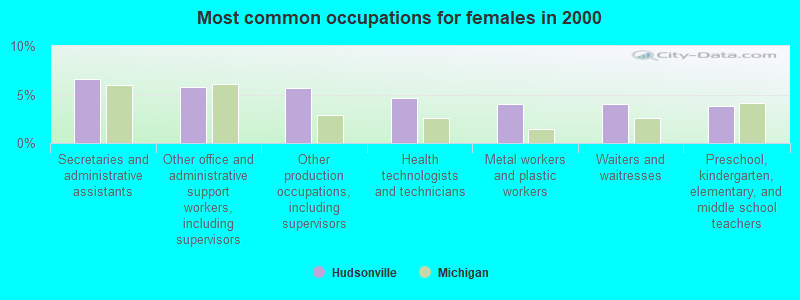


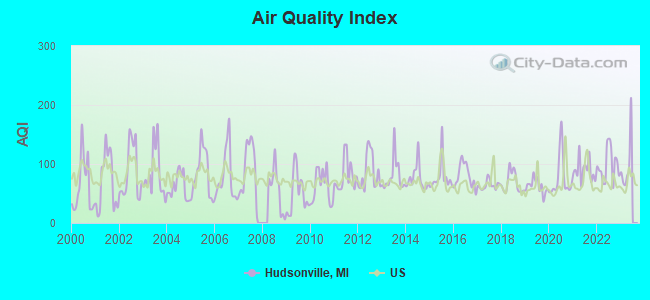
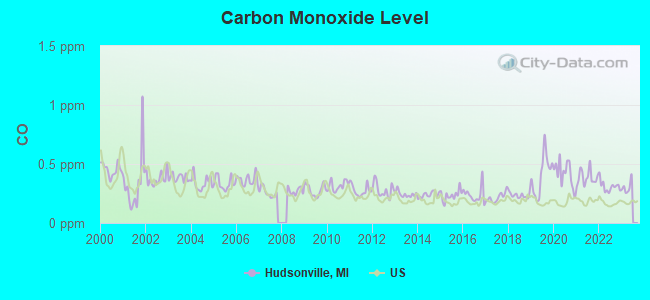
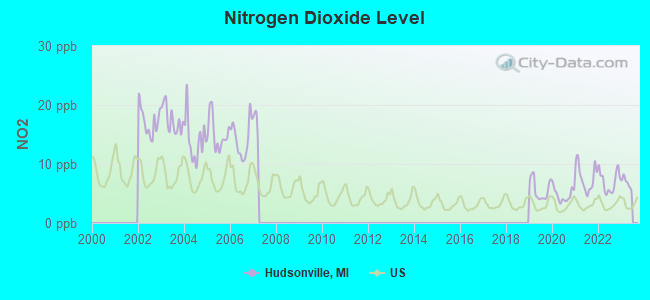
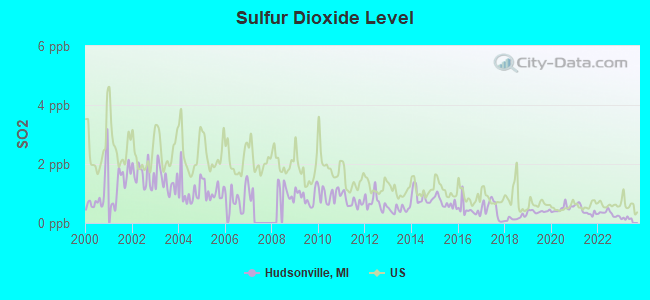
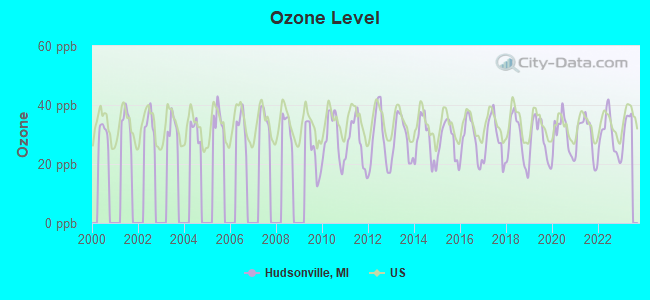
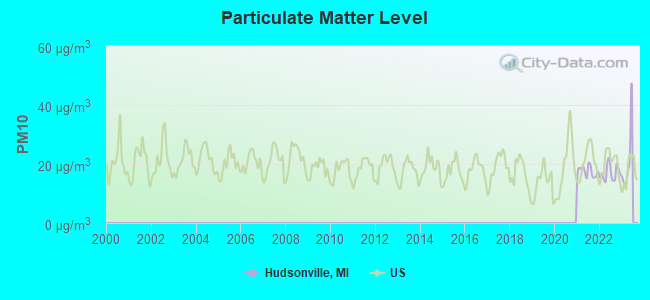
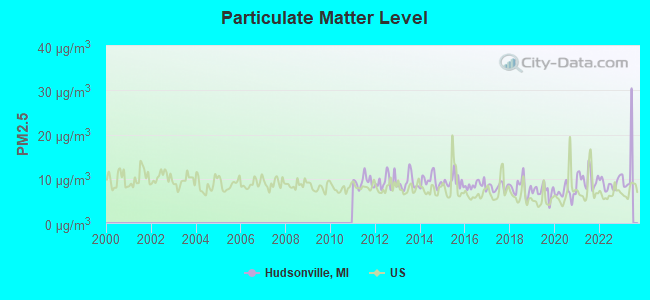
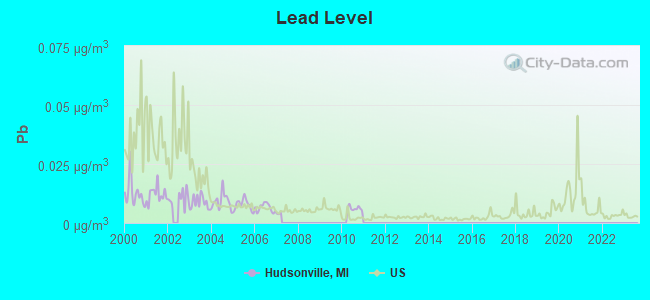
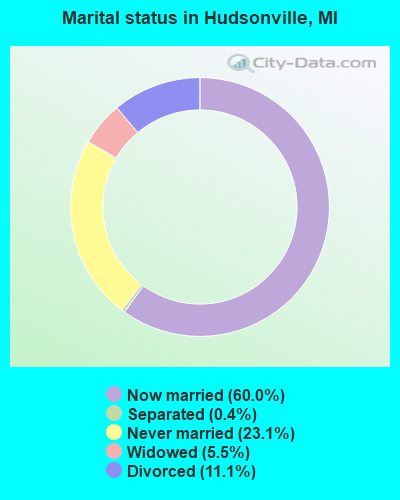
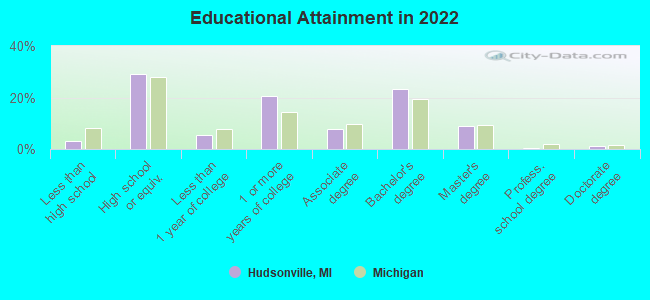
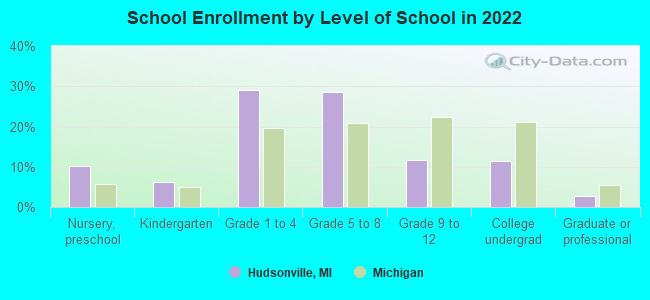
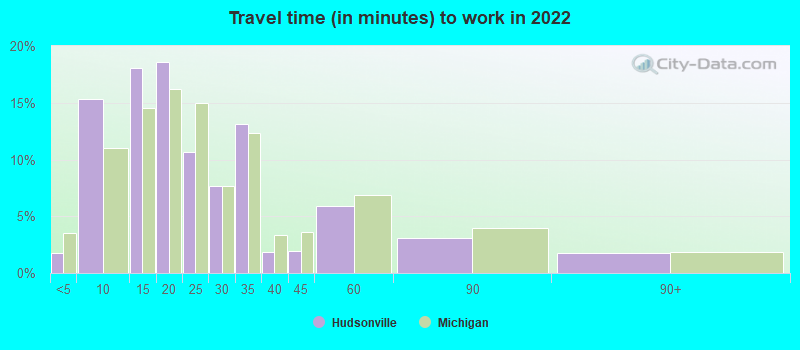
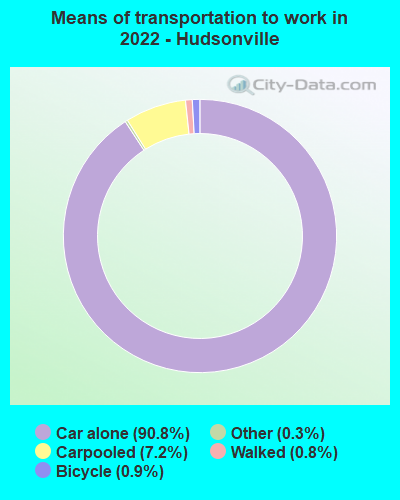
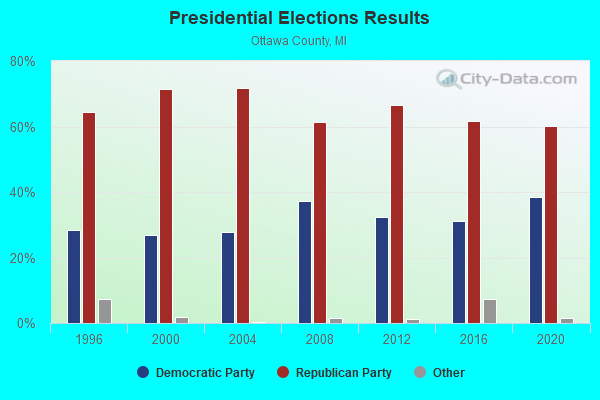
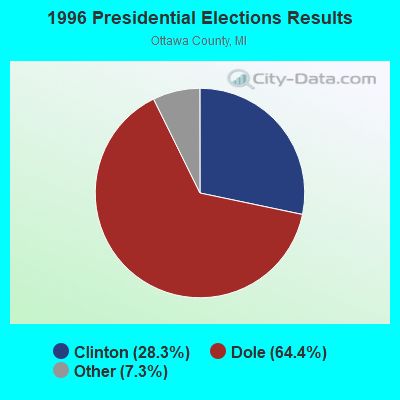

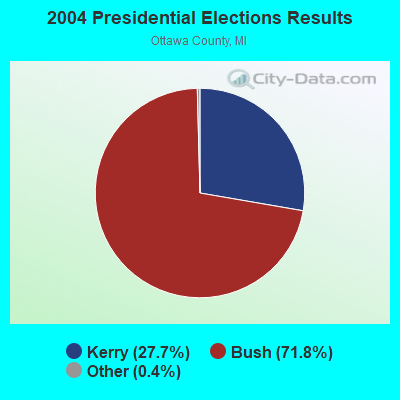
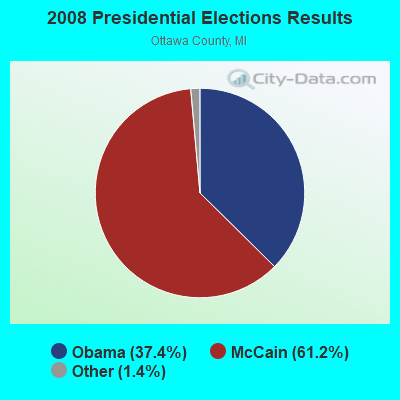
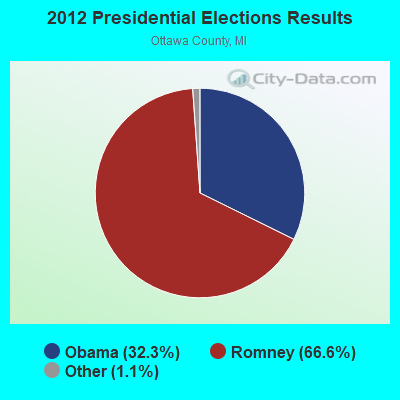
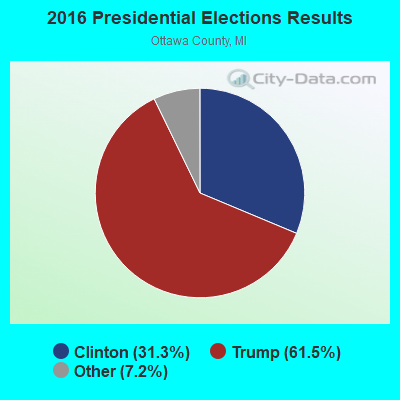

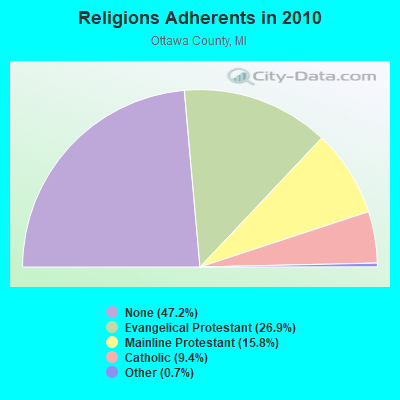
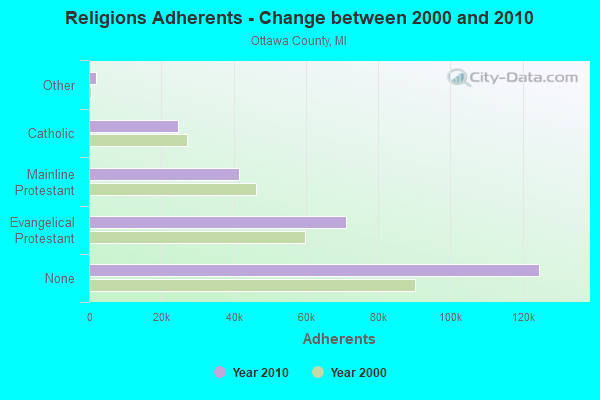

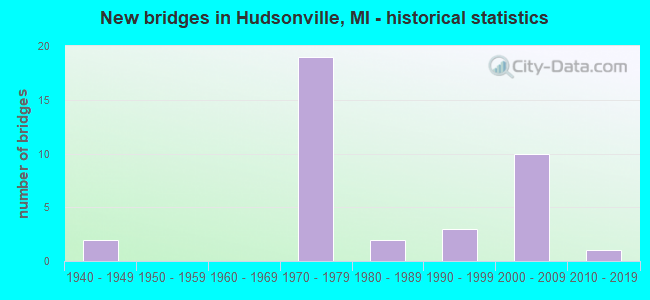
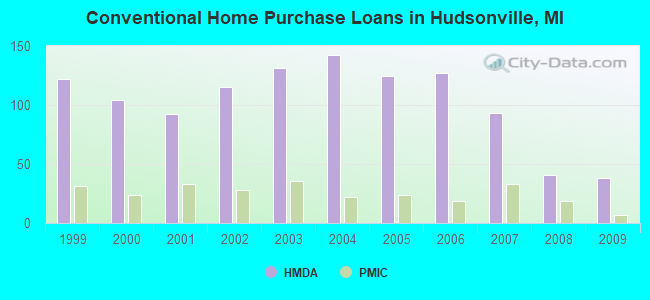
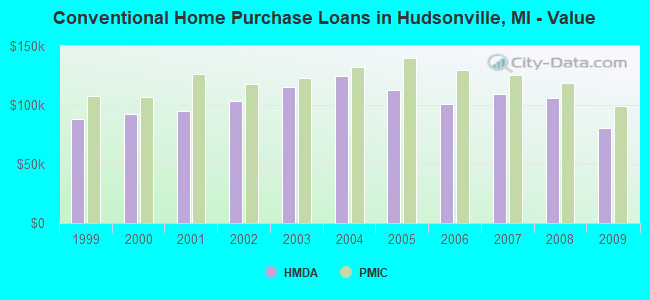
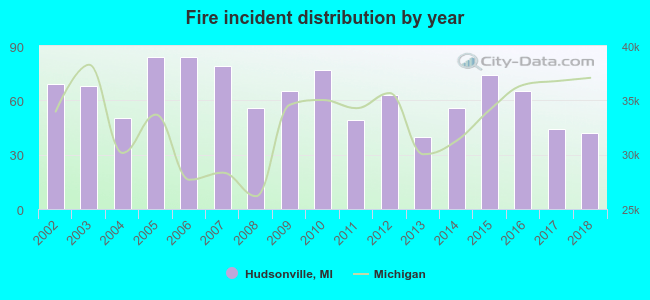 According to the data from the years 2002 - 2018 the average number of fire incidents per year is 63. The highest number of fire incidents - 84 took place in 2005, and the least - 40 in 2013. The data has a dropping trend.
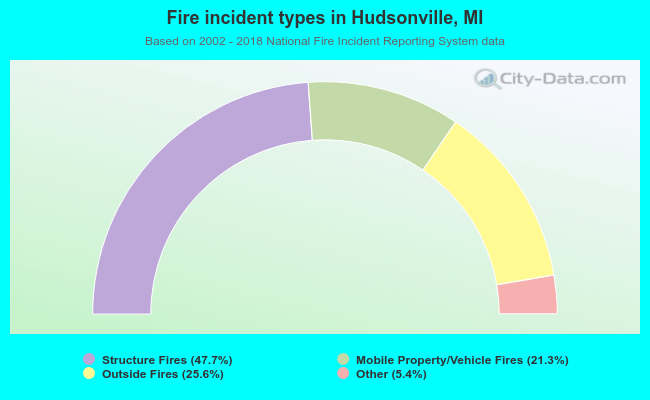 When looking into fire subcategories, the most incidents belonged to: Structure Fires (47.7%), and Outside Fires (25.6%).