Percentage of residents living in poverty in 2022: 36.5%
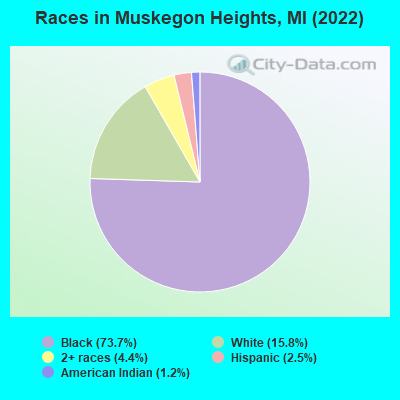
(34.1% for White Non-Hispanic residents, 35.8% for Black residents, 33.6% for Hispanic or Latino residents, 56.3% for American Indian residents, 43.7% for two or more races residents)
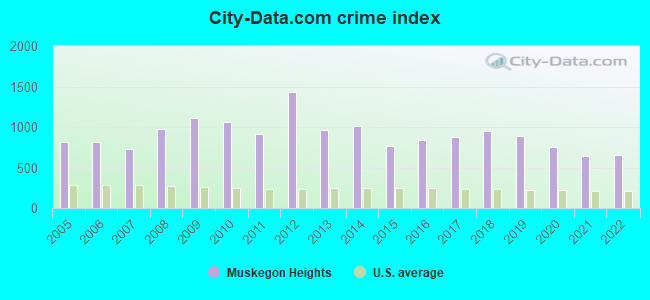
The City-Data.com crime index weighs serious crimes and violent crimes more heavily. Higher means more crime, U.S. average is 246.1. It adjusts for the number of visitors and daily workers commuting into cities.
Latest news from Muskegon Heights, MI collected exclusively by city-data.com from local newspapers, TV, and radio stations
Ancestries: American (1.1%).
Current Local Time: EST time zone
Elevation: 625 feet
Land area: 3.17 square miles.
Population density: 3,106 people per square mile (average).
143 residents are foreign born
This city:
1.4%
Michigan:
6.9%
Median real estate property taxes paid for housing units with mortgages in 2022: $1,299 (1.8%) Median real estate property taxes paid for housing units with no mortgage in 2022: $1,055 (1.8%)
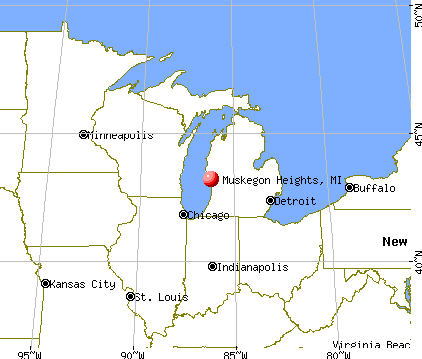
Nearest city with pop. 50,000+: Grand Rapids, MI (34.0 miles , pop. 197,800).
Nearest city with pop. 200,000+: Milwaukee, WI (87.1 miles , pop. 596,974).
Nearest city with pop. 1,000,000+: Chicago, IL (119.4 miles , pop. 2,896,016).
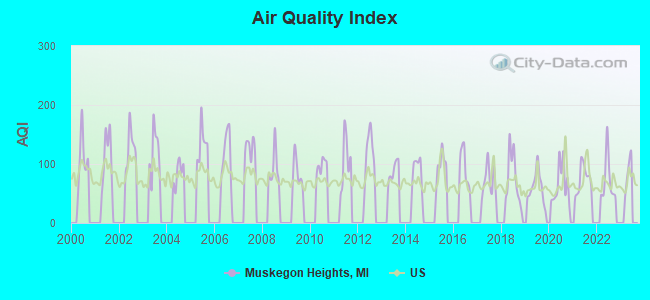
Air Quality Index (AQI) level in 2022 was 72.6. This is about average.
City:
72.6
U.S.:
72.6
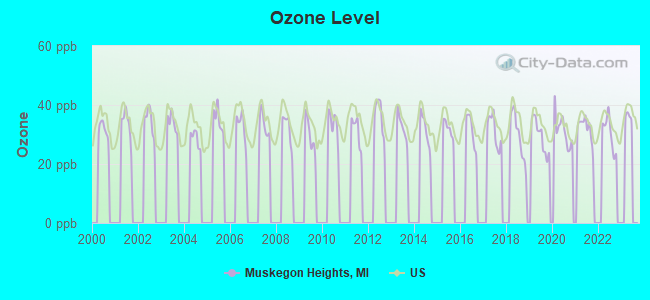
Ozone [ppb] level in 2022 was 30.4. This is about average.Closest monitor was 3.1 miles away from the city center.
City:
30.4
U.S.:
33.3
Tornado activity:
Muskegon Heights-area historical tornado activity is below Michigan state average. It is 38% smaller than the overall U.S. average.
On 4/3/1956, a category F5 (max. wind speeds 261-318 mph) tornado 36.9 miles away from the Muskegon Heights city center killed 18 peopleand injured 340 peopleand causedbetween $50,000 and $500,000 in damages.
On 4/11/1965, a category F4 (max. wind speeds 207-260 mph) tornado 20.7 miles away from the city center killed 5 peopleand injured 142 peopleand causedbetween $500,000 and $5,000,000 in damages.
Earthquake activity:
Muskegon Heights-area historical earthquake activity is significantly above Michigan state average. It is 23% smaller than the overall U.S. average.
On 5/2/2015 at 16:23:07, a magnitude 4.2 (4.2 MW, Depth: 2.8 mi, Class: Light, Intensity: IV - V) earthquake occurred 78.7 miles away from the city center On 4/18/2008 at 09:36:59, a magnitude 5.4 (5.1 MB, 4.8 MS, 5.4 MW, 5.2 MW, Class: Moderate, Intensity: VI - VII) earthquake occurred 339.7 miles away from the city center On 1/31/1986 at 16:46:43, a magnitude 5.0 (5.0 MB) earthquake occurred 282.2 miles away from Muskegon Heights center On 9/25/1998 at 19:52:52, a magnitude 5.2 (4.8 MB, 4.3 MS, 5.2 LG, 4.5 MW, Depth: 3.1 mi) earthquake occurred 321.4 miles away from the city center On 6/10/1987 at 23:48:54, a magnitude 5.1 (4.9 MB, 4.4 MS, 4.6 MS, 5.1 LG) earthquake occurred 315.0 miles away from the city center On 7/12/1986 at 08:19:37, a magnitude 4.5 (4.5 MB) earthquake occurred 208.1 miles away from the city center Magnitude types: regional Lg-wave magnitude (LG), body-wave magnitude (MB), surface-wave magnitude (MS), moment magnitude (MW)
Natural disasters:
The number of natural disasters in Muskegon County (12) is smaller than the US average (15). Major Disasters (Presidential) Declared: 7 Emergencies Declared: 4
Causes of natural disasters: Floods: 6, Storms: 6, Tornadoes: 2, Winds: 2, Winter Storms: 2, Blizzard: 1, Hurricane: 1, Snowstorm: 1, Other: 1 (Note: some incidents may be assigned to more than one category).
Hospitals and medical centers in Muskegon Heights:
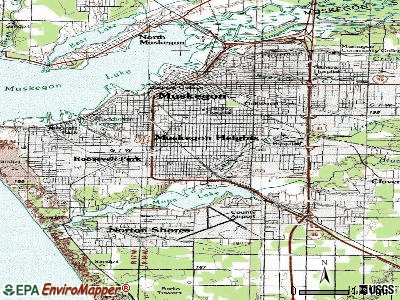
Notable locations in Muskegon Heights: Muskegon Heights City Hall (A), Muskegon Heights Fire Department (B), Muskegon Heights Library (C), Muskegon Heights Police Department (D). Display/hide their locations on the map
Churches in Muskegon Heights include: Sacred Heart Church (A), Jesus' Fellowship Church (B), Wood Street Seventh Day Church (C), Church of Christ (D), Covenant Community Church (E), Temple United Methodist Church (F), Mount Herman Zion Baptist Church (G), New Life Baptist Church (H), Mount Olive Baptist Church (I). Display/hide their locations on the map
Parks in Muskegon Heights include: West Heights Park (1), Rowan City Park (2), Harris Nature Park (3), Johnny O Haris Park (4), Mona Lake Park (5). Display/hide their locations on the map
Birthplace of: Milo Sukup - Football player and coach, Sonny Grandelius - Football player and coach, Eddie Spencer - College basketball player (Central Michigan Chippewas).
Muskegon County has a predicted average indoor radon screening level less than 2 pCi/L (pico curies per liter) - Low Potential
Drinking water stations with addresses in Muskegon Heights and their reported violations in the past:
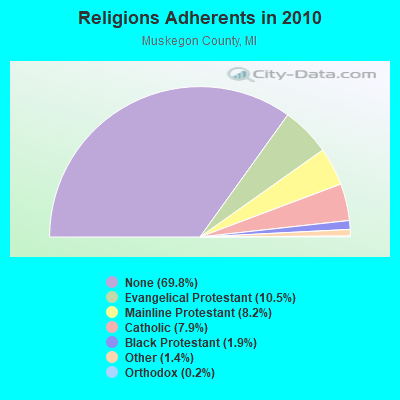
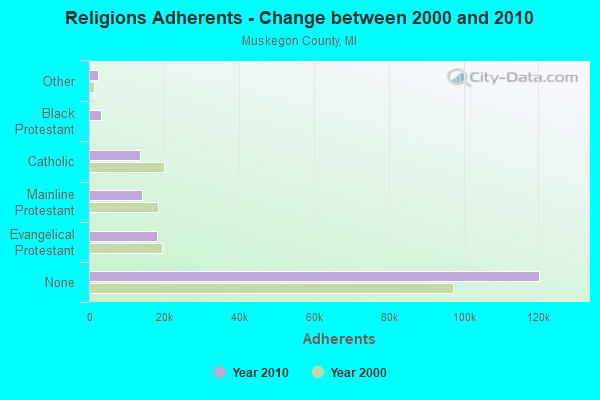
Religion statistics for Muskegon Heights, MI (based on Muskegon County data)
Religion
Adherents
Congregations
Evangelical Protestant
18,063
105
Mainline Protestant
14,051
49
Catholic
13,687
11
Black Protestant
3,314
11
Other
2,464
10
Orthodox
350
1
None
120,259
-
Source: Clifford Grammich, Kirk Hadaway, Richard Houseal, Dale E.Jones, Alexei Krindatch, Richie Stanley and Richard H.Taylor. 2012. 2010 U.S.Religion Census: Religious Congregations & Membership Study. Association of Statisticians of American Religious Bodies. Jones, Dale E., et al. 2002. Congregations and Membership in the United States 2000. Nashville, TN: Glenmary Research Center. Graphs represent county-level data
MUSKEGON HGTS, 3345 South Getty Street (Lat: 43.191472 Lon: -86.225972), Type: Tank, Structure height: 46 m, Overall height: 49.4 m, Call Sign: WQQN357, Assigned Frequencies: 19475.0 MHz, 19525.0 MHz, Grant Date: 12/28/2022, Expiration Date: 01/31/2033, Certifier: John Monday, Registrant: At&t Services, Inc., 208 S Akard St, 20f, Dallas, TX 75202, Phone: (855) 699-7073, Email:
MU04497M, E. Sherman And Peck St. (Lat: 43.202417 Lon: -86.237917), Type: Mtower, Structure height: 39.6 m, Call Sign: WRVR872, Assigned Frequencies: 19620.0 MHz, 19620.0 MHz, 19620.0 MHz, 19620.0 MHz, 19620.0 MHz, 19620.0 MHz, 19620.0 MHz, 19620.0 MHz, 19620.0 MHz, 19620.0 MHz... (+5 more), Grant Date: 12/28/2022, Expiration Date: 12/28/2032, Cancellation Date: 02/05/2024, Certifier: Jenny Knopf, Registrant: T-Mobile Usa, Inc., 12920 Se 38th Street, Bellevue, WA 98006, Phone: (425) 383-8401, Fax: (425) 383-4040, Email:
FCC Registered Paging Towers:
1
65 E Columbia (Lat: 43.196667 Lon: -86.238111), Call Sign: KNKL663, Assigned Frequencies: 152.600 MHz, Expiration Date: 04/01/1999, Cancellation Date: 06/05/1999, Registrant: Northern Communications, Inc., 3318 Glade Street, Muskegon, MI 49444-0000
FCC Registered Amateur Radio Licenses:
2
Call Sign: KA8ZEV, Licensee ID: L01077229, Grant Date: 10/26/2005, Expiration Date: 01/24/2016, Cancellation Date: 01/25/2018, Certifier: Robert F Hughes Jr, Registrant: Robert F Hughes Jr, 2628 Riordan St, Muskegon Heights, MI 49444
Call Sign: W8NWY, Grant Date: 05/17/1995, Expiration Date: 05/17/2005, Cancellation Date: 05/18/2007, Registrant: Guadalupe Alviar, 55 E Delano Ave, Muskegon Heights, MI 49444
Home Mortgage Disclosure Act Aggregated Statistics For Year 2009 (Based on 5 full tracts)
A) FHA, FSA/RHS & VA Home Purchase Loans
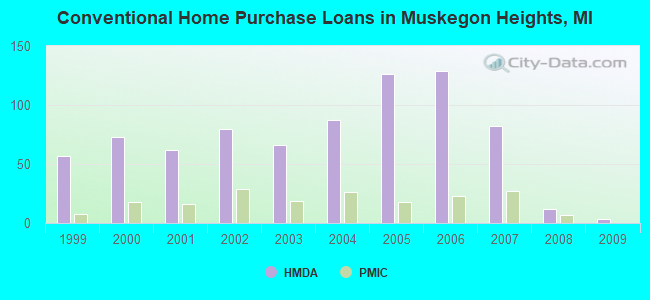
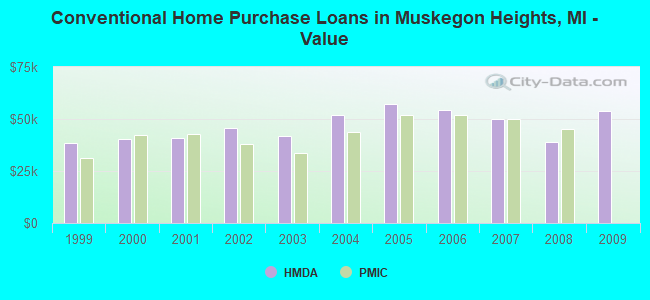
B) Conventional Home Purchase Loans
C) Refinancings
D) Home Improvement Loans
F) Non-occupant Loans on < 5 Family Dwellings (A B C & D)
Number
Average Value
Number
Average Value
Number
Average Value
Number
Average Value
Number
Average Value
LOANS ORIGINATED
10
$48,020
3
$53,937
20
$71,388
6
$20,985
5
$83,108
APPLICATIONS APPROVED, NOT ACCEPTED
1
$67,980
1
$43,350
3
$46,950
0
$0
1
$43,350
APPLICATIONS DENIED
5
$44,336
5
$40,040
45
$47,461
19
$19,804
10
$29,078
APPLICATIONS WITHDRAWN
1
$140,000
0
$0
4
$72,425
1
$8,870
0
$0
FILES CLOSED FOR INCOMPLETENESS
0
$0
1
$54,190
2
$146,165
2
$76,180
1
$43,000
Aggregated Statistics For Year 2008 (Based on 5 full tracts)
A) FHA, FSA/RHS & VA Home Purchase Loans
B) Conventional Home Purchase Loans
C) Refinancings
D) Home Improvement Loans
E) Loans on Dwellings For 5+ Families
F) Non-occupant Loans on < 5 Family Dwellings (A B C & D)
Number
Average Value
Number
Average Value
Number
Average Value
Number
Average Value
Number
Average Value
Number
Average Value
LOANS ORIGINATED
10
$45,146
12
$38,786
35
$51,843
11
$24,657
2
$167,500
9
$62,816
APPLICATIONS APPROVED, NOT ACCEPTED
2
$50,095
1
$30,000
11
$56,698
2
$13,465
0
$0
1
$32,000
APPLICATIONS DENIED
15
$48,957
16
$34,772
94
$58,448
25
$30,102
0
$0
10
$37,095
APPLICATIONS WITHDRAWN
5
$59,948
2
$26,500
25
$67,788
2
$69,500
0
$0
5
$40,726
FILES CLOSED FOR INCOMPLETENESS
2
$38,395
0
$0
3
$57,700
1
$24,630
0
$0
0
$0
Aggregated Statistics For Year 2007 (Based on 5 full tracts)
A) FHA, FSA/RHS & VA Home Purchase Loans
B) Conventional Home Purchase Loans
C) Refinancings
D) Home Improvement Loans
E) Loans on Dwellings For 5+ Families
F) Non-occupant Loans on < 5 Family Dwellings (A B C & D)
Number
Average Value
Number
Average Value
Number
Average Value
Number
Average Value
Number
Average Value
Number
Average Value
LOANS ORIGINATED
4
$56,202
82
$49,971
104
$62,570
22
$32,176
1
$99,730
67
$58,742
APPLICATIONS APPROVED, NOT ACCEPTED
0
$0
10
$55,164
36
$62,099
3
$13,667
0
$0
8
$57,360
APPLICATIONS DENIED
5
$47,248
62
$54,164
273
$57,948
73
$29,007
0
$0
66
$47,225
APPLICATIONS WITHDRAWN
3
$55,680
11
$47,298
52
$60,517
3
$13,313
0
$0
10
$38,660
FILES CLOSED FOR INCOMPLETENESS
1
$10,970
4
$56,265
13
$79,953
0
$0
0
$0
3
$40,630
Aggregated Statistics For Year 2006 (Based on 5 full tracts)
A) FHA, FSA/RHS & VA Home Purchase Loans
B) Conventional Home Purchase Loans
C) Refinancings
D) Home Improvement Loans
F) Non-occupant Loans on < 5 Family Dwellings (A B C & D)
G) Loans On Manufactured Home Dwelling (A B C & D)
Number
Average Value
Number
Average Value
Number
Average Value
Number
Average Value
Number
Average Value
Number
Average Value
LOANS ORIGINATED
10
$68,427
129
$54,511
170
$56,289
34
$21,929
69
$42,888
1
$20,940
APPLICATIONS APPROVED, NOT ACCEPTED
0
$0
26
$49,080
51
$72,371
11
$29,661
12
$61,026
0
$0
APPLICATIONS DENIED
4
$73,030
90
$57,782
319
$65,116
82
$26,997
56
$52,739
0
$0
APPLICATIONS WITHDRAWN
1
$31,530
33
$46,908
135
$69,928
11
$28,170
24
$44,255
0
$0
FILES CLOSED FOR INCOMPLETENESS
1
$27,590
10
$60,998
32
$78,979
1
$64,040
3
$57,717
0
$0
Aggregated Statistics For Year 2005 (Based on 5 full tracts)
A) FHA, FSA/RHS & VA Home Purchase Loans
B) Conventional Home Purchase Loans
C) Refinancings
D) Home Improvement Loans
E) Loans on Dwellings For 5+ Families
F) Non-occupant Loans on < 5 Family Dwellings (A B C & D)
G) Loans On Manufactured Home Dwelling (A B C & D)
Number
Average Value
Number
Average Value
Number
Average Value
Number
Average Value
Number
Average Value
Number
Average Value
Number
Average Value
LOANS ORIGINATED
7
$53,767
126
$57,439
234
$53,738
24
$34,927
1
$99,730
91
$54,490
0
$0
APPLICATIONS APPROVED, NOT ACCEPTED
5
$63,114
29
$49,192
85
$58,148
9
$30,069
0
$0
8
$37,625
1
$51,860
APPLICATIONS DENIED
6
$70,877
105
$62,144
417
$59,352
82
$26,932
0
$0
58
$45,702
3
$13,233
APPLICATIONS WITHDRAWN
3
$64,267
44
$65,325
204
$69,154
17
$88,561
0
$0
18
$49,312
2
$37,895
FILES CLOSED FOR INCOMPLETENESS
1
$69,000
3
$35,960
48
$68,012
1
$49,870
0
$0
4
$39,472
0
$0
Aggregated Statistics For Year 2004 (Based on 5 full tracts)
A) FHA, FSA/RHS & VA Home Purchase Loans
B) Conventional Home Purchase Loans
C) Refinancings
D) Home Improvement Loans
F) Non-occupant Loans on < 5 Family Dwellings (A B C & D)
G) Loans On Manufactured Home Dwelling (A B C & D)
Number
Average Value
Number
Average Value
Number
Average Value
Number
Average Value
Number
Average Value
Number
Average Value
LOANS ORIGINATED
18
$58,449
87
$52,098
209
$55,469
40
$22,182
64
$47,938
1
$37,900
APPLICATIONS APPROVED, NOT ACCEPTED
0
$0
32
$53,997
88
$58,785
12
$37,408
9
$54,067
0
$0
APPLICATIONS DENIED
10
$45,995
89
$50,079
407
$58,660
85
$24,277
34
$46,457
10
$27,311
APPLICATIONS WITHDRAWN
1
$50,860
20
$55,253
107
$59,174
15
$38,087
6
$41,902
0
$0
FILES CLOSED FOR INCOMPLETENESS
0
$0
7
$63,017
51
$58,984
2
$21,785
7
$42,221
0
$0
Aggregated Statistics For Year 2003 (Based on 5 full tracts)
A) FHA, FSA/RHS & VA Home Purchase Loans
B) Conventional Home Purchase Loans
C) Refinancings
D) Home Improvement Loans
F) Non-occupant Loans on < 5 Family Dwellings (A B C & D)
Number
Average Value
Number
Average Value
Number
Average Value
Number
Average Value
Number
Average Value
LOANS ORIGINATED
22
$53,352
66
$41,636
214
$54,761
33
$15,950
68
$38,258
APPLICATIONS APPROVED, NOT ACCEPTED
3
$55,583
19
$47,093
85
$57,647
3
$13,303
9
$44,513
APPLICATIONS DENIED
13
$46,962
42
$47,324
383
$51,150
58
$12,823
54
$41,264
APPLICATIONS WITHDRAWN
0
$0
7
$47,886
108
$57,884
6
$28,678
7
$39,044
FILES CLOSED FOR INCOMPLETENESS
2
$59,080
1
$68,960
18
$44,277
1
$32,510
3
$49,467
Aggregated Statistics For Year 2002 (Based on 5 full tracts)
A) FHA, FSA/RHS & VA Home Purchase Loans
B) Conventional Home Purchase Loans
C) Refinancings
D) Home Improvement Loans
E) Loans on Dwellings For 5+ Families
F) Non-occupant Loans on < 5 Family Dwellings (A B C & D)
Number
Average Value
Number
Average Value
Number
Average Value
Number
Average Value
Number
Average Value
Number
Average Value
LOANS ORIGINATED
29
$48,387
80
$45,834
239
$47,142
35
$15,773
0
$0
75
$32,701
APPLICATIONS APPROVED, NOT ACCEPTED
0
$0
16
$40,059
78
$46,231
9
$25,536
1
$52,000
9
$32,168
APPLICATIONS DENIED
7
$50,286
38
$49,922
351
$48,099
61
$10,640
0
$0
30
$27,262
APPLICATIONS WITHDRAWN
4
$51,288
10
$63,830
105
$49,852
3
$10,837
0
$0
10
$37,786
FILES CLOSED FOR INCOMPLETENESS
2
$52,505
6
$33,997
36
$53,227
3
$28,583
0
$0
6
$30,845
Aggregated Statistics For Year 2001 (Based on 5 full tracts)
A) FHA, FSA/RHS & VA Home Purchase Loans
B) Conventional Home Purchase Loans
C) Refinancings
D) Home Improvement Loans
F) Non-occupant Loans on < 5 Family Dwellings (A B C & D)
Number
Average Value
Number
Average Value
Number
Average Value
Number
Average Value
Number
Average Value
LOANS ORIGINATED
32
$47,123
62
$40,807
205
$49,410
70
$11,439
54
$38,268
APPLICATIONS APPROVED, NOT ACCEPTED
2
$28,290
15
$34,053
87
$40,194
10
$10,073
13
$31,737
APPLICATIONS DENIED
8
$53,796
68
$36,336
414
$44,873
162
$11,711
42
$28,244
APPLICATIONS WITHDRAWN
4
$57,925
13
$38,202
129
$49,476
14
$18,092
9
$34,448
FILES CLOSED FOR INCOMPLETENESS
3
$41,223
4
$33,888
32
$44,987
0
$0
3
$19,647
Aggregated Statistics For Year 2000 (Based on 5 full tracts)
A) FHA, FSA/RHS & VA Home Purchase Loans
B) Conventional Home Purchase Loans
C) Refinancings
D) Home Improvement Loans
F) Non-occupant Loans on < 5 Family Dwellings (A B C & D)
Number
Average Value
Number
Average Value
Number
Average Value
Number
Average Value
Number
Average Value
LOANS ORIGINATED
40
$45,768
73
$40,310
216
$40,458
64
$12,454
58
$29,865
APPLICATIONS APPROVED, NOT ACCEPTED
2
$35,905
20
$40,639
89
$46,981
30
$11,756
9
$29,037
APPLICATIONS DENIED
11
$41,038
78
$35,329
319
$39,737
203
$11,890
32
$29,621
APPLICATIONS WITHDRAWN
4
$42,635
18
$41,812
119
$37,386
4
$73,430
9
$36,508
FILES CLOSED FOR INCOMPLETENESS
1
$23,940
8
$30,579
31
$46,995
1
$25,000
3
$38,000
Aggregated Statistics For Year 1999 (Based on 5 full tracts)
A) FHA, FSA/RHS & VA Home Purchase Loans
B) Conventional Home Purchase Loans
C) Refinancings
D) Home Improvement Loans
E) Loans on Dwellings For 5+ Families
F) Non-occupant Loans on < 5 Family Dwellings (A B C & D)
2004 - 2018 National Fire Incident Reporting System (NFIRS) incidents
Based on the data from the years 2004 - 2018 the average number of fires per year is 71. The highest number of reported fire incidents - 128 took place in 2012, and the least - 3 in 2005. The data has a rising trend.
When looking into fire subcategories, the most reports belonged to: Structure Fires (56.2%), and Outside Fires (24.8%).
Fire incident types reported to NFIRS in Muskegon Heights, MI
#3 on the list of "Top 101 cities with the most people below the poverty level, excluding cities with 15% or more of residents in college and with the median age below 28 (population 5,000+)"
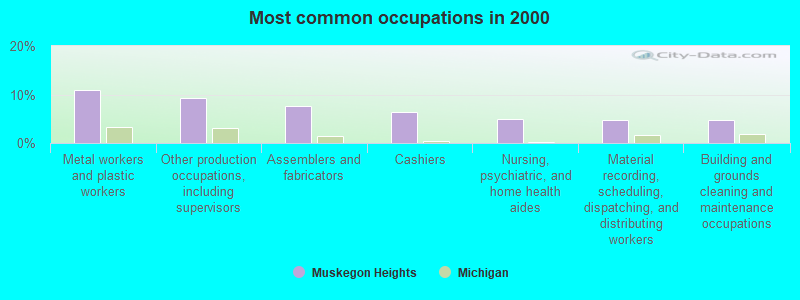
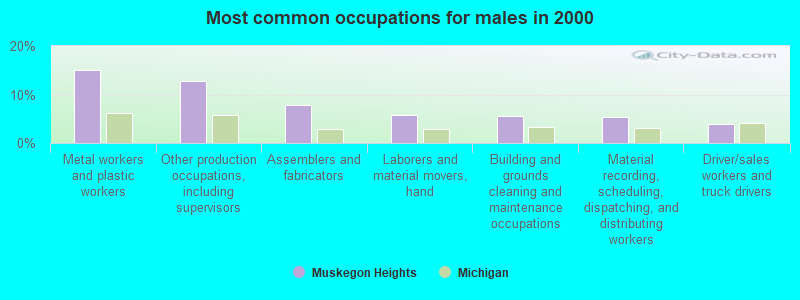
#7 on the list of "Top 101 cities with largest percentage of males in occupations: production occupations (population 5,000+)"
#12 on the list of "Top 101 cities with the highest number of arson incidents per 100,000 residents, excludes tourist destinations and others with a lot of outsiders visiting based on city industries data (population 5,000+)"
#14 on the list of "Top 101 cities with the largest city-data.com crime index per police officer (population 5,000+)"
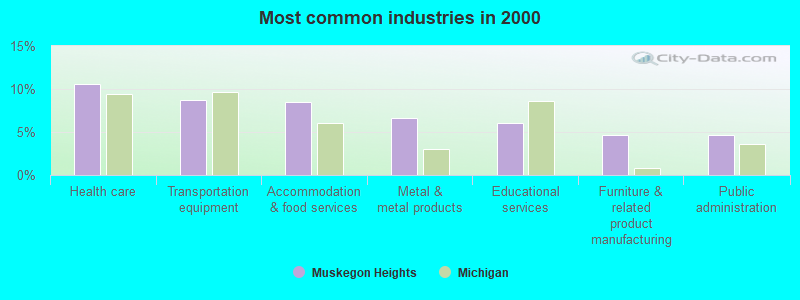
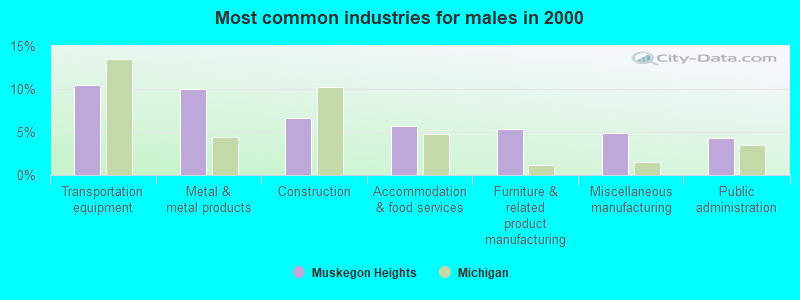
#19 on the list of "Top 101 cities with largest percentage of males in industries: manufacturing (population 5,000+)"
#27 on the list of "Top 101 cities with the largest positive percentage difference between never married females and males (15+ years) (with at least 1,000 females never married)"
#37 on the list of "Top 101 cities with the highest city-data.com crime index, excludes tourist destinations and others with a lot of outsiders visiting based on city industries data (population 5,000+)"
#49 on the list of "Top 101 cities with the highest percentage of single-parent households, population 5,000+"
#51 on the list of "Top 101 cities with the highest number of assaults per 100,000 residents, excludes tourist destinations and others with a lot of outsiders visiting based on city industries data (population 5,000+)"
#52 on the list of "Top 101 cities with the highest number of rapes per 100,000 residents, excludes tourist destinations and others with a lot of outsiders visiting based on city industries data (population 5,000+)"
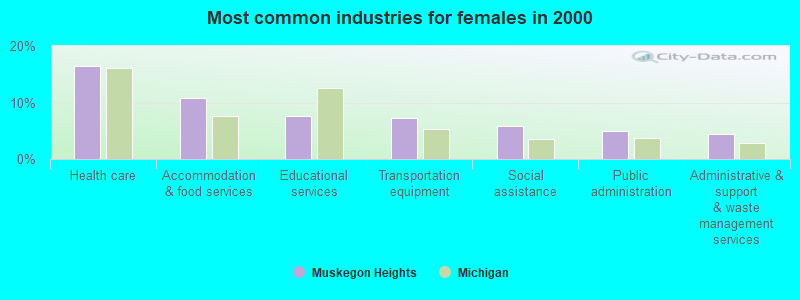
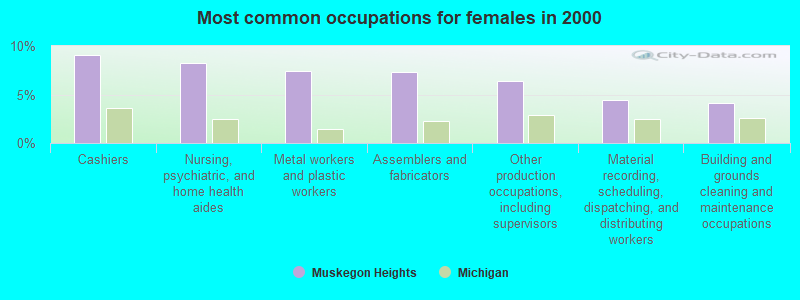
#55 on the list of "Top 101 cities with largest percentage of females in occupations: healthcare support occupations (population 5,000+)"
#55 on the list of "Top 101 cities with the highest number of burglaries per 100,000 residents, excludes tourist destinations and others with a lot of outsiders visiting based on city industries data (population 5,000+)"
#66 on the list of "Top 101 cities with the highest number of robberies per 100,000 residents, excludes tourist destinations and others with a lot of outsiders visiting based on city industries data (population 5,000+)"
#75 on the list of "Top 101 cities with the most people taking a taxi to work (population 5,000+)"
#75 on the list of "Top 100 least-safe cities (highest city-data.com crime index)"
#95 on the list of "Top 101 cities with largest percentage of females in industries: administrative and support and waste management services (population 5,000+)"
#96 (49444) on the list of "Top 101 zip codes with the largest percentage of Dutch first ancestries (pop 5,000+)"
#20 on the list of "Top 101 counties with the largest number of people moving out compared to moving in (pop. 50,000+)"
#50 on the list of "Top 101 counties with the lowest percentage of residents relocating from foreign countries between 2010 and 2011"
#79 on the list of "Top 101 counties with the lowest percentage of residents relocating from other counties between 2010 and 2011"
#96 on the list of "Top 101 counties with the smallest number of people without health insurance coverage in 2000 (pop. 50,000+)"


 Recent articles from our blog. Our writers, many of them Ph.D. graduates or candidates, create easy-to-read articles on a wide variety of topics.

 (34.0 miles


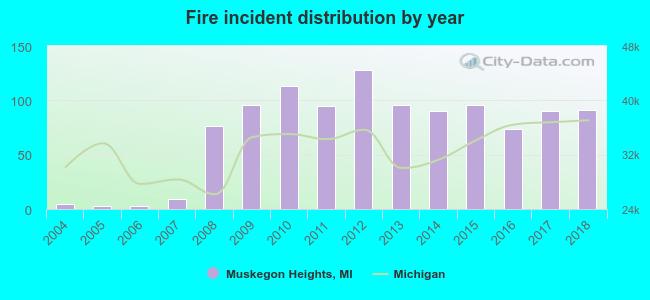 Based on the data from the years 2004 - 2018 the average number of fires per year is 71. The highest number of reported fire incidents - 128 took place in 2012, and the least - 3 in 2005. The data has a rising trend.
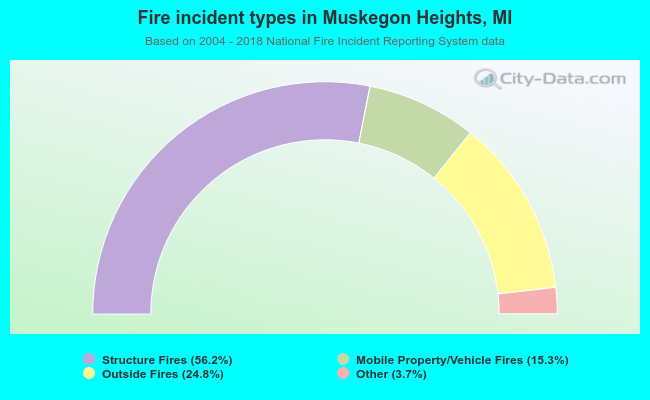 When looking into fire subcategories, the most reports belonged to: Structure Fires (56.2%), and Outside Fires (24.8%).