Weslaco, Texas Submit your own pictures of this city and show them to the world
OSM Map
General Map
Google Map
MSN Map
OSM Map
General Map
Google Map
MSN Map
OSM Map
General Map
Google Map
MSN Map
OSM Map
General Map
Google Map
MSN Map
Please wait while loading the map...
Population in 2022: 42,231 (100% urban, 0% rural). Population change since 2000: +56.8%Males: 20,501 Females: 21,730
March 2022 cost of living index in Weslaco: 80.8 (low, U.S. average is 100) Percentage of residents living in poverty in 2022: 24.7%for White Non-Hispanic residents , 54.7% for Black residents , 24.2% for Hispanic or Latino residents , 3.6% for American Indian residents , 43.8% for other race residents , 26.5% for two or more races residents )
Profiles of local businesses
Business Search - 14 Million verified businesses
Data:
Median household income ($)
Median household income (% change since 2000)
Household income diversity
Ratio of average income to average house value (%)
Ratio of average income to average rent
Median household income ($) - White
Median household income ($) - Black or African American
Median household income ($) - Asian
Median household income ($) - Hispanic or Latino
Median household income ($) - American Indian and Alaska Native
Median household income ($) - Multirace
Median household income ($) - Other Race
Median household income for houses/condos with a mortgage ($)
Median household income for apartments without a mortgage ($)
Races - White alone (%)
Races - White alone (% change since 2000)
Races - Black alone (%)
Races - Black alone (% change since 2000)
Races - American Indian alone (%)
Races - American Indian alone (% change since 2000)
Races - Asian alone (%)
Races - Asian alone (% change since 2000)
Races - Hispanic (%)
Races - Hispanic (% change since 2000)
Races - Native Hawaiian and Other Pacific Islander alone (%)
Races - Native Hawaiian and Other Pacific Islander alone (% change since 2000)
Races - Two or more races (%)
Races - Two or more races (% change since 2000)
Races - Other race alone (%)
Races - Other race alone (% change since 2000)
Racial diversity
Unemployment (%)
Unemployment (% change since 2000)
Unemployment (%) - White
Unemployment (%) - Black or African American
Unemployment (%) - Asian
Unemployment (%) - Hispanic or Latino
Unemployment (%) - American Indian and Alaska Native
Unemployment (%) - Multirace
Unemployment (%) - Other Race
Population density (people per square mile)
Population - Males (%)
Population - Females (%)
Population - Males (%) - White
Population - Males (%) - Black or African American
Population - Males (%) - Asian
Population - Males (%) - Hispanic or Latino
Population - Males (%) - American Indian and Alaska Native
Population - Males (%) - Multirace
Population - Males (%) - Other Race
Population - Females (%) - White
Population - Females (%) - Black or African American
Population - Females (%) - Asian
Population - Females (%) - Hispanic or Latino
Population - Females (%) - American Indian and Alaska Native
Population - Females (%) - Multirace
Population - Females (%) - Other Race
Coronavirus confirmed cases (Jun 10, 2024)
Deaths caused by coronavirus (Jun 10, 2024)
Coronavirus confirmed cases (per 100k population) (Jun 10, 2024)
Deaths caused by coronavirus (per 100k population) (Jun 10, 2024)
Daily increase in number of cases (Jun 10, 2024)
Weekly increase in number of cases (Jun 10, 2024)
Cases doubled (in days) (Jun 10, 2024)
Hospitalized patients (Apr 18, 2022)
Negative test results (Apr 18, 2022)
Total test results (Apr 18, 2022)
COVID Vaccine doses distributed (per 100k population) (Sep 19, 2023)
COVID Vaccine doses administered (per 100k population) (Sep 19, 2023)
COVID Vaccine doses distributed (Sep 19, 2023)
COVID Vaccine doses administered (Sep 19, 2023)
Likely homosexual households (%)
Likely homosexual households (% change since 2000)
Likely homosexual households - Lesbian couples (%)
Likely homosexual households - Lesbian couples (% change since 2000)
Likely homosexual households - Gay men (%)
Likely homosexual households - Gay men (% change since 2000)
Cost of living index
Median gross rent ($)
Median contract rent ($)
Median monthly housing costs ($)
Median house or condo value ($)
Median house or condo value ($ change since 2000)
Mean house or condo value by units in structure - 1, detached ($)
Mean house or condo value by units in structure - 1, attached ($)
Mean house or condo value by units in structure - 2 ($)
Mean house or condo value by units in structure by units in structure - 3 or 4 ($)
Mean house or condo value by units in structure - 5 or more ($)
Mean house or condo value by units in structure - Boat, RV, van, etc. ($)
Mean house or condo value by units in structure - Mobile home ($)
Median house or condo value ($) - White
Median house or condo value ($) - Black or African American
Median house or condo value ($) - Asian
Median house or condo value ($) - Hispanic or Latino
Median house or condo value ($) - American Indian and Alaska Native
Median house or condo value ($) - Multirace
Median house or condo value ($) - Other Race
Median resident age
Resident age diversity
Median resident age - Males
Median resident age - Females
Median resident age - White
Median resident age - Black or African American
Median resident age - Asian
Median resident age - Hispanic or Latino
Median resident age - American Indian and Alaska Native
Median resident age - Multirace
Median resident age - Other Race
Median resident age - Males - White
Median resident age - Males - Black or African American
Median resident age - Males - Asian
Median resident age - Males - Hispanic or Latino
Median resident age - Males - American Indian and Alaska Native
Median resident age - Males - Multirace
Median resident age - Males - Other Race
Median resident age - Females - White
Median resident age - Females - Black or African American
Median resident age - Females - Asian
Median resident age - Females - Hispanic or Latino
Median resident age - Females - American Indian and Alaska Native
Median resident age - Females - Multirace
Median resident age - Females - Other Race
Commute - mean travel time to work (minutes)
Travel time to work - Less than 5 minutes (%)
Travel time to work - Less than 5 minutes (% change since 2000)
Travel time to work - 5 to 9 minutes (%)
Travel time to work - 5 to 9 minutes (% change since 2000)
Travel time to work - 10 to 19 minutes (%)
Travel time to work - 10 to 19 minutes (% change since 2000)
Travel time to work - 20 to 29 minutes (%)
Travel time to work - 20 to 29 minutes (% change since 2000)
Travel time to work - 30 to 39 minutes (%)
Travel time to work - 30 to 39 minutes (% change since 2000)
Travel time to work - 40 to 59 minutes (%)
Travel time to work - 40 to 59 minutes (% change since 2000)
Travel time to work - 60 to 89 minutes (%)
Travel time to work - 60 to 89 minutes (% change since 2000)
Travel time to work - 90 or more minutes (%)
Travel time to work - 90 or more minutes (% change since 2000)
Marital status - Never married (%)
Marital status - Now married (%)
Marital status - Separated (%)
Marital status - Widowed (%)
Marital status - Divorced (%)
Median family income ($)
Median family income (% change since 2000)
Median non-family income ($)
Median non-family income (% change since 2000)
Median per capita income ($)
Median per capita income (% change since 2000)
Median family income ($) - White
Median family income ($) - Black or African American
Median family income ($) - Asian
Median family income ($) - Hispanic or Latino
Median family income ($) - American Indian and Alaska Native
Median family income ($) - Multirace
Median family income ($) - Other Race
Median year house/condo built
Median year apartment built
Year house built - Built 2005 or later (%)
Year house built - Built 2000 to 2004 (%)
Year house built - Built 1990 to 1999 (%)
Year house built - Built 1980 to 1989 (%)
Year house built - Built 1970 to 1979 (%)
Year house built - Built 1960 to 1969 (%)
Year house built - Built 1950 to 1959 (%)
Year house built - Built 1940 to 1949 (%)
Year house built - Built 1939 or earlier (%)
Average household size
Household density (households per square mile)
Average household size - White
Average household size - Black or African American
Average household size - Asian
Average household size - Hispanic or Latino
Average household size - American Indian and Alaska Native
Average household size - Multirace
Average household size - Other Race
Occupied housing units (%)
Vacant housing units (%)
Owner occupied housing units (%)
Renter occupied housing units (%)
Vacancy status - For rent (%)
Vacancy status - For sale only (%)
Vacancy status - Rented or sold, not occupied (%)
Vacancy status - For seasonal, recreational, or occasional use (%)
Vacancy status - For migrant workers (%)
Vacancy status - Other vacant (%)
Residents with income below the poverty level (%)
Residents with income below 50% of the poverty level (%)
Children below poverty level (%)
Poor families by family type - Married-couple family (%)
Poor families by family type - Male, no wife present (%)
Poor families by family type - Female, no husband present (%)
Poverty status for native-born residents (%)
Poverty status for foreign-born residents (%)
Poverty among high school graduates not in families (%)
Poverty among people who did not graduate high school not in families (%)
Residents with income below the poverty level (%) - White
Residents with income below the poverty level (%) - Black or African American
Residents with income below the poverty level (%) - Asian
Residents with income below the poverty level (%) - Hispanic or Latino
Residents with income below the poverty level (%) - American Indian and Alaska Native
Residents with income below the poverty level (%) - Multirace
Residents with income below the poverty level (%) - Other Race
Air pollution - Air Quality Index (AQI)
Air pollution - CO
Air pollution - NO2
Air pollution - SO2
Air pollution - Ozone
Air pollution - PM10
Air pollution - PM25
Air pollution - Pb
Crime - Murders per 100,000 population
Crime - Rapes per 100,000 population
Crime - Robberies per 100,000 population
Crime - Assaults per 100,000 population
Crime - Burglaries per 100,000 population
Crime - Thefts per 100,000 population
Crime - Auto thefts per 100,000 population
Crime - Arson per 100,000 population
Crime - City-data.com crime index
Crime - Violent crime index
Crime - Property crime index
Crime - Murders per 100,000 population (5 year average)
Crime - Rapes per 100,000 population (5 year average)
Crime - Robberies per 100,000 population (5 year average)
Crime - Assaults per 100,000 population (5 year average)
Crime - Burglaries per 100,000 population (5 year average)
Crime - Thefts per 100,000 population (5 year average)
Crime - Auto thefts per 100,000 population (5 year average)
Crime - Arson per 100,000 population (5 year average)
Crime - City-data.com crime index (5 year average)
Crime - Violent crime index (5 year average)
Crime - Property crime index (5 year average)
1996 Presidential Elections Results (%) - Democratic Party (Clinton)
1996 Presidential Elections Results (%) - Republican Party (Dole)
1996 Presidential Elections Results (%) - Other
2000 Presidential Elections Results (%) - Democratic Party (Gore)
2000 Presidential Elections Results (%) - Republican Party (Bush)
2000 Presidential Elections Results (%) - Other
2004 Presidential Elections Results (%) - Democratic Party (Kerry)
2004 Presidential Elections Results (%) - Republican Party (Bush)
2004 Presidential Elections Results (%) - Other
2008 Presidential Elections Results (%) - Democratic Party (Obama)
2008 Presidential Elections Results (%) - Republican Party (McCain)
2008 Presidential Elections Results (%) - Other
2012 Presidential Elections Results (%) - Democratic Party (Obama)
2012 Presidential Elections Results (%) - Republican Party (Romney)
2012 Presidential Elections Results (%) - Other
2016 Presidential Elections Results (%) - Democratic Party (Clinton)
2016 Presidential Elections Results (%) - Republican Party (Trump)
2016 Presidential Elections Results (%) - Other
2020 Presidential Elections Results (%) - Democratic Party (Biden)
2020 Presidential Elections Results (%) - Republican Party (Trump)
2020 Presidential Elections Results (%) - Other
Ancestries Reported - Arab (%)
Ancestries Reported - Czech (%)
Ancestries Reported - Danish (%)
Ancestries Reported - Dutch (%)
Ancestries Reported - English (%)
Ancestries Reported - French (%)
Ancestries Reported - French Canadian (%)
Ancestries Reported - German (%)
Ancestries Reported - Greek (%)
Ancestries Reported - Hungarian (%)
Ancestries Reported - Irish (%)
Ancestries Reported - Italian (%)
Ancestries Reported - Lithuanian (%)
Ancestries Reported - Norwegian (%)
Ancestries Reported - Polish (%)
Ancestries Reported - Portuguese (%)
Ancestries Reported - Russian (%)
Ancestries Reported - Scotch-Irish (%)
Ancestries Reported - Scottish (%)
Ancestries Reported - Slovak (%)
Ancestries Reported - Subsaharan African (%)
Ancestries Reported - Swedish (%)
Ancestries Reported - Swiss (%)
Ancestries Reported - Ukrainian (%)
Ancestries Reported - United States (%)
Ancestries Reported - Welsh (%)
Ancestries Reported - West Indian (%)
Ancestries Reported - Other (%)
Educational Attainment - No schooling completed (%)
Educational Attainment - Less than high school (%)
Educational Attainment - High school or equivalent (%)
Educational Attainment - Less than 1 year of college (%)
Educational Attainment - 1 or more years of college (%)
Educational Attainment - Associate degree (%)
Educational Attainment - Bachelor's degree (%)
Educational Attainment - Master's degree (%)
Educational Attainment - Professional school degree (%)
Educational Attainment - Doctorate degree (%)
School Enrollment - Nursery, preschool (%)
School Enrollment - Kindergarten (%)
School Enrollment - Grade 1 to 4 (%)
School Enrollment - Grade 5 to 8 (%)
School Enrollment - Grade 9 to 12 (%)
School Enrollment - College undergrad (%)
School Enrollment - Graduate or professional (%)
School Enrollment - Not enrolled in school (%)
School enrollment - Public schools (%)
School enrollment - Private schools (%)
School enrollment - Not enrolled (%)
Median number of rooms in houses and condos
Median number of rooms in apartments
Housing units lacking complete plumbing facilities (%)
Housing units lacking complete kitchen facilities (%)
Density of houses
Urban houses (%)
Rural houses (%)
Households with people 60 years and over (%)
Households with people 65 years and over (%)
Households with people 75 years and over (%)
Households with one or more nonrelatives (%)
Households with no nonrelatives (%)
Population in households (%)
Family households (%)
Nonfamily households (%)
Population in families (%)
Family households with own children (%)
Median number of bedrooms in owner occupied houses
Mean number of bedrooms in owner occupied houses
Median number of bedrooms in renter occupied houses
Mean number of bedrooms in renter occupied houses
Median number of vehichles in owner occupied houses
Mean number of vehichles in owner occupied houses
Median number of vehichles in renter occupied houses
Mean number of vehichles in renter occupied houses
Mortgage status - with mortgage (%)
Mortgage status - with second mortgage (%)
Mortgage status - with home equity loan (%)
Mortgage status - with both second mortgage and home equity loan (%)
Mortgage status - without a mortgage (%)
Average family size
Average family size - White
Average family size - Black or African American
Average family size - Asian
Average family size - Hispanic or Latino
Average family size - American Indian and Alaska Native
Average family size - Multirace
Average family size - Other Race
Geographical mobility - Same house 1 year ago (%)
Geographical mobility - Moved within same county (%)
Geographical mobility - Moved from different county within same state (%)
Geographical mobility - Moved from different state (%)
Geographical mobility - Moved from abroad (%)
Place of birth - Born in state of residence (%)
Place of birth - Born in other state (%)
Place of birth - Native, outside of US (%)
Place of birth - Foreign born (%)
Housing units in structures - 1, detached (%)
Housing units in structures - 1, attached (%)
Housing units in structures - 2 (%)
Housing units in structures - 3 or 4 (%)
Housing units in structures - 5 to 9 (%)
Housing units in structures - 10 to 19 (%)
Housing units in structures - 20 to 49 (%)
Housing units in structures - 50 or more (%)
Housing units in structures - Mobile home (%)
Housing units in structures - Boat, RV, van, etc. (%)
House/condo owner moved in on average (years ago)
Renter moved in on average (years ago)
Year householder moved into unit - Moved in 1999 to March 2000 (%)
Year householder moved into unit - Moved in 1995 to 1998 (%)
Year householder moved into unit - Moved in 1990 to 1994 (%)
Year householder moved into unit - Moved in 1980 to 1989 (%)
Year householder moved into unit - Moved in 1970 to 1979 (%)
Year householder moved into unit - Moved in 1969 or earlier (%)
Means of transportation to work - Drove car alone (%)
Means of transportation to work - Carpooled (%)
Means of transportation to work - Public transportation (%)
Means of transportation to work - Bus or trolley bus (%)
Means of transportation to work - Streetcar or trolley car (%)
Means of transportation to work - Subway or elevated (%)
Means of transportation to work - Railroad (%)
Means of transportation to work - Ferryboat (%)
Means of transportation to work - Taxicab (%)
Means of transportation to work - Motorcycle (%)
Means of transportation to work - Bicycle (%)
Means of transportation to work - Walked (%)
Means of transportation to work - Other means (%)
Working at home (%)
Industry diversity
Most Common Industries - Agriculture, forestry, fishing and hunting, and mining (%)
Most Common Industries - Agriculture, forestry, fishing and hunting (%)
Most Common Industries - Mining, quarrying, and oil and gas extraction (%)
Most Common Industries - Construction (%)
Most Common Industries - Manufacturing (%)
Most Common Industries - Wholesale trade (%)
Most Common Industries - Retail trade (%)
Most Common Industries - Transportation and warehousing, and utilities (%)
Most Common Industries - Transportation and warehousing (%)
Most Common Industries - Utilities (%)
Most Common Industries - Information (%)
Most Common Industries - Finance and insurance, and real estate and rental and leasing (%)
Most Common Industries - Finance and insurance (%)
Most Common Industries - Real estate and rental and leasing (%)
Most Common Industries - Professional, scientific, and management, and administrative and waste management services (%)
Most Common Industries - Professional, scientific, and technical services (%)
Most Common Industries - Management of companies and enterprises (%)
Most Common Industries - Administrative and support and waste management services (%)
Most Common Industries - Educational services, and health care and social assistance (%)
Most Common Industries - Educational services (%)
Most Common Industries - Health care and social assistance (%)
Most Common Industries - Arts, entertainment, and recreation, and accommodation and food services (%)
Most Common Industries - Arts, entertainment, and recreation (%)
Most Common Industries - Accommodation and food services (%)
Most Common Industries - Other services, except public administration (%)
Most Common Industries - Public administration (%)
Occupation diversity
Most Common Occupations - Management, business, science, and arts occupations (%)
Most Common Occupations - Management, business, and financial occupations (%)
Most Common Occupations - Management occupations (%)
Most Common Occupations - Business and financial operations occupations (%)
Most Common Occupations - Computer, engineering, and science occupations (%)
Most Common Occupations - Computer and mathematical occupations (%)
Most Common Occupations - Architecture and engineering occupations (%)
Most Common Occupations - Life, physical, and social science occupations (%)
Most Common Occupations - Education, legal, community service, arts, and media occupations (%)
Most Common Occupations - Community and social service occupations (%)
Most Common Occupations - Legal occupations (%)
Most Common Occupations - Education, training, and library occupations (%)
Most Common Occupations - Arts, design, entertainment, sports, and media occupations (%)
Most Common Occupations - Healthcare practitioners and technical occupations (%)
Most Common Occupations - Health diagnosing and treating practitioners and other technical occupations (%)
Most Common Occupations - Health technologists and technicians (%)
Most Common Occupations - Service occupations (%)
Most Common Occupations - Healthcare support occupations (%)
Most Common Occupations - Protective service occupations (%)
Most Common Occupations - Fire fighting and prevention, and other protective service workers including supervisors (%)
Most Common Occupations - Law enforcement workers including supervisors (%)
Most Common Occupations - Food preparation and serving related occupations (%)
Most Common Occupations - Building and grounds cleaning and maintenance occupations (%)
Most Common Occupations - Personal care and service occupations (%)
Most Common Occupations - Sales and office occupations (%)
Most Common Occupations - Sales and related occupations (%)
Most Common Occupations - Office and administrative support occupations (%)
Most Common Occupations - Natural resources, construction, and maintenance occupations (%)
Most Common Occupations - Farming, fishing, and forestry occupations (%)
Most Common Occupations - Construction and extraction occupations (%)
Most Common Occupations - Installation, maintenance, and repair occupations (%)
Most Common Occupations - Production, transportation, and material moving occupations (%)
Most Common Occupations - Production occupations (%)
Most Common Occupations - Transportation occupations (%)
Most Common Occupations - Material moving occupations (%)
People in Group quarters - Institutionalized population (%)
People in Group quarters - Correctional institutions (%)
People in Group quarters - Federal prisons and detention centers (%)
People in Group quarters - Halfway houses (%)
People in Group quarters - Local jails and other confinement facilities (including police lockups) (%)
People in Group quarters - Military disciplinary barracks (%)
People in Group quarters - State prisons (%)
People in Group quarters - Other types of correctional institutions (%)
People in Group quarters - Nursing homes (%)
People in Group quarters - Hospitals/wards, hospices, and schools for the handicapped (%)
People in Group quarters - Hospitals/wards and hospices for chronically ill (%)
People in Group quarters - Hospices or homes for chronically ill (%)
People in Group quarters - Military hospitals or wards for chronically ill (%)
People in Group quarters - Other hospitals or wards for chronically ill (%)
People in Group quarters - Hospitals or wards for drug/alcohol abuse (%)
People in Group quarters - Mental (Psychiatric) hospitals or wards (%)
People in Group quarters - Schools, hospitals, or wards for the mentally retarded (%)
People in Group quarters - Schools, hospitals, or wards for the physically handicapped (%)
People in Group quarters - Institutions for the deaf (%)
People in Group quarters - Institutions for the blind (%)
People in Group quarters - Orthopedic wards and institutions for the physically handicapped (%)
People in Group quarters - Wards in general hospitals for patients who have no usual home elsewhere (%)
People in Group quarters - Wards in military hospitals for patients who have no usual home elsewhere (%)
People in Group quarters - Juvenile institutions (%)
People in Group quarters - Long-term care (%)
People in Group quarters - Homes for abused, dependent, and neglected children (%)
People in Group quarters - Residential treatment centers for emotionally disturbed children (%)
People in Group quarters - Training schools for juvenile delinquents (%)
People in Group quarters - Short-term care, detention or diagnostic centers for delinquent children (%)
People in Group quarters - Type of juvenile institution unknown (%)
People in Group quarters - Noninstitutionalized population (%)
People in Group quarters - College dormitories (includes college quarters off campus) (%)
People in Group quarters - Military quarters (%)
People in Group quarters - On base (%)
People in Group quarters - Barracks, unaccompanied personnel housing (UPH), (Enlisted/Officer), ;and similar group living quarters for military personnel (%)
People in Group quarters - Transient quarters for temporary residents (%)
People in Group quarters - Military ships (%)
People in Group quarters - Group homes (%)
People in Group quarters - Homes or halfway houses for drug/alcohol abuse (%)
People in Group quarters - Homes for the mentally ill (%)
People in Group quarters - Homes for the mentally retarded (%)
People in Group quarters - Homes for the physically handicapped (%)
People in Group quarters - Other group homes (%)
People in Group quarters - Religious group quarters (%)
People in Group quarters - Dormitories (%)
People in Group quarters - Agriculture workers' dormitories on farms (%)
People in Group quarters - Job Corps and vocational training facilities (%)
People in Group quarters - Other workers' dormitories (%)
People in Group quarters - Crews of maritime vessels (%)
People in Group quarters - Other nonhousehold living situations (%)
People in Group quarters - Other noninstitutional group quarters (%)
Residents speaking English at home (%)
Residents speaking English at home - Born in the United States (%)
Residents speaking English at home - Native, born elsewhere (%)
Residents speaking English at home - Foreign born (%)
Residents speaking Spanish at home (%)
Residents speaking Spanish at home - Born in the United States (%)
Residents speaking Spanish at home - Native, born elsewhere (%)
Residents speaking Spanish at home - Foreign born (%)
Residents speaking other language at home (%)
Residents speaking other language at home - Born in the United States (%)
Residents speaking other language at home - Native, born elsewhere (%)
Residents speaking other language at home - Foreign born (%)
Class of Workers - Employee of private company (%)
Class of Workers - Self-employed in own incorporated business (%)
Class of Workers - Private not-for-profit wage and salary workers (%)
Class of Workers - Local government workers (%)
Class of Workers - State government workers (%)
Class of Workers - Federal government workers (%)
Class of Workers - Self-employed workers in own not incorporated business and Unpaid family workers (%)
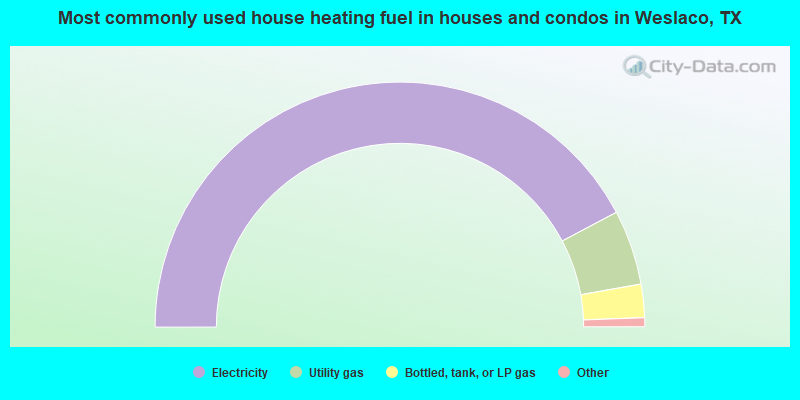
House heating fuel used in houses and condos - Utility gas (%)
House heating fuel used in houses and condos - Bottled, tank, or LP gas (%)
House heating fuel used in houses and condos - Electricity (%)
House heating fuel used in houses and condos - Fuel oil, kerosene, etc. (%)
House heating fuel used in houses and condos - Coal or coke (%)
House heating fuel used in houses and condos - Wood (%)
House heating fuel used in houses and condos - Solar energy (%)
House heating fuel used in houses and condos - Other fuel (%)
House heating fuel used in houses and condos - No fuel used (%)
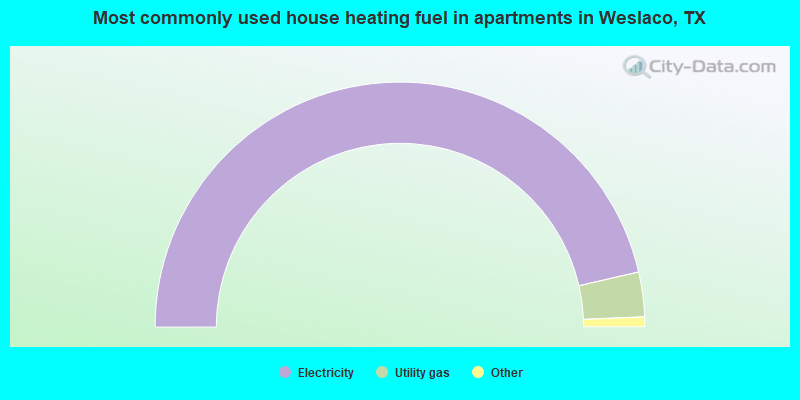
House heating fuel used in apartments - Utility gas (%)
House heating fuel used in apartments - Bottled, tank, or LP gas (%)
House heating fuel used in apartments - Electricity (%)
House heating fuel used in apartments - Fuel oil, kerosene, etc. (%)
House heating fuel used in apartments - Coal or coke (%)
House heating fuel used in apartments - Wood (%)
House heating fuel used in apartments - Solar energy (%)
House heating fuel used in apartments - Other fuel (%)
House heating fuel used in apartments - No fuel used (%)
Armed forces status - In Armed Forces (%)
Armed forces status - Civilian (%)
Armed forces status - Civilian - Veteran (%)
Armed forces status - Civilian - Nonveteran (%)
Fatal accidents locations in years 2005-2021
Fatal accidents locations in 2005
Fatal accidents locations in 2006
Fatal accidents locations in 2007
Fatal accidents locations in 2008
Fatal accidents locations in 2009
Fatal accidents locations in 2010
Fatal accidents locations in 2011
Fatal accidents locations in 2012
Fatal accidents locations in 2013
Fatal accidents locations in 2014
Fatal accidents locations in 2015
Fatal accidents locations in 2016
Fatal accidents locations in 2017
Fatal accidents locations in 2018
Fatal accidents locations in 2019
Fatal accidents locations in 2020
Fatal accidents locations in 2021
Alcohol use - People drinking some alcohol every month (%)
Alcohol use - People not drinking at all (%)
Alcohol use - Average days/month drinking alcohol
Alcohol use - Average drinks/week
Alcohol use - Average days/year people drink much
Audiometry - Average condition of hearing (%)
Audiometry - People that can hear a whisper from across a quiet room (%)
Audiometry - People that can hear normal voice from across a quiet room (%)
Audiometry - Ears ringing, roaring, buzzing (%)
Audiometry - Had a job exposure to loud noise (%)
Audiometry - Had off-work exposure to loud noise (%)
Blood Pressure & Cholesterol - Has high blood pressure (%)
Blood Pressure & Cholesterol - Checking blood pressure at home (%)
Blood Pressure & Cholesterol - Frequently checking blood cholesterol (%)
Blood Pressure & Cholesterol - Has high cholesterol level (%)
Consumer Behavior - Money monthly spent on food at supermarket/grocery store
Consumer Behavior - Money monthly spent on food at other stores
Consumer Behavior - Money monthly spent on eating out
Consumer Behavior - Money monthly spent on carryout/delivered foods
Consumer Behavior - Income spent on food at supermarket/grocery store (%)
Consumer Behavior - Income spent on food at other stores (%)
Consumer Behavior - Income spent on eating out (%)
Consumer Behavior - Income spent on carryout/delivered foods (%)
Current Health Status - General health condition (%)
Current Health Status - Blood donors (%)
Current Health Status - Has blood ever tested for HIV virus (%)
Current Health Status - Left-handed people (%)
Dermatology - People using sunscreen (%)
Diabetes - Diabetics (%)
Diabetes - Had a blood test for high blood sugar (%)
Diabetes - People taking insulin (%)
Diet Behavior & Nutrition - Diet health (%)
Diet Behavior & Nutrition - Milk product consumption (# of products/month)
Diet Behavior & Nutrition - Meals not home prepared (#/week)
Diet Behavior & Nutrition - Meals from fast food or pizza place (#/week)
Diet Behavior & Nutrition - Ready-to-eat foods (#/month)
Diet Behavior & Nutrition - Frozen meals/pizza (#/month)
Drug Use - People that ever used marijuana or hashish (%)
Drug Use - Ever used hard drugs (%)
Drug Use - Ever used any form of cocaine (%)
Drug Use - Ever used heroin (%)
Drug Use - Ever used methamphetamine (%)
Health Insurance - People covered by health insurance (%)
Kidney Conditions-Urology - Avg. # of times urinating at night
Medical Conditions - People with asthma (%)
Medical Conditions - People with anemia (%)
Medical Conditions - People with psoriasis (%)
Medical Conditions - People with overweight (%)
Medical Conditions - Elderly people having difficulties in thinking or remembering (%)
Medical Conditions - People who ever received blood transfusion (%)
Medical Conditions - People having trouble seeing even with glass/contacts (%)
Medical Conditions - People with arthritis (%)
Medical Conditions - People with gout (%)
Medical Conditions - People with congestive heart failure (%)
Medical Conditions - People with coronary heart disease (%)
Medical Conditions - People with angina pectoris (%)
Medical Conditions - People who ever had heart attack (%)
Medical Conditions - People who ever had stroke (%)
Medical Conditions - People with emphysema (%)
Medical Conditions - People with thyroid problem (%)
Medical Conditions - People with chronic bronchitis (%)
Medical Conditions - People with any liver condition (%)
Medical Conditions - People who ever had cancer or malignancy (%)
Mental Health - People who have little interest in doing things (%)
Mental Health - People feeling down, depressed, or hopeless (%)
Mental Health - People who have trouble sleeping or sleeping too much (%)
Mental Health - People feeling tired or having little energy (%)
Mental Health - People with poor appetite or overeating (%)
Mental Health - People feeling bad about themself (%)
Mental Health - People who have trouble concentrating on things (%)
Mental Health - People moving or speaking slowly or too fast (%)
Mental Health - People having thoughts they would be better off dead (%)
Oral Health - Average years since last visit a dentist
Oral Health - People embarrassed because of mouth (%)
Oral Health - People with gum disease (%)
Oral Health - General health of teeth and gums (%)
Oral Health - Average days a week using dental floss/device
Oral Health - Average days a week using mouthwash for dental problem
Oral Health - Average number of teeth
Pesticide Use - Households using pesticides to control insects (%)
Pesticide Use - Households using pesticides to kill weeds (%)
Physical Activity - People doing vigorous-intensity work activities (%)
Physical Activity - People doing moderate-intensity work activities (%)
Physical Activity - People walking or bicycling (%)
Physical Activity - People doing vigorous-intensity recreational activities (%)
Physical Activity - People doing moderate-intensity recreational activities (%)
Physical Activity - Average hours a day doing sedentary activities
Physical Activity - Average hours a day watching TV or videos
Physical Activity - Average hours a day using computer
Physical Functioning - People having limitations keeping them from working (%)
Physical Functioning - People limited in amount of work they can do (%)
Physical Functioning - People that need special equipment to walk (%)
Physical Functioning - People experiencing confusion/memory problems (%)
Physical Functioning - People requiring special healthcare equipment (%)
Prescription Medications - Average number of prescription medicines taking
Preventive Aspirin Use - Adults 40+ taking low-dose aspirin (%)
Reproductive Health - Vaginal deliveries (%)
Reproductive Health - Cesarean deliveries (%)
Reproductive Health - Deliveries resulted in a live birth (%)
Reproductive Health - Pregnancies resulted in a delivery (%)
Reproductive Health - Women breastfeeding newborns (%)
Reproductive Health - Women that had a hysterectomy (%)
Reproductive Health - Women that had both ovaries removed (%)
Reproductive Health - Women that have ever taken birth control pills (%)
Reproductive Health - Women taking birth control pills (%)
Reproductive Health - Women that have ever used Depo-Provera or injectables (%)
Reproductive Health - Women that have ever used female hormones (%)
Sexual Behavior - People 18+ that ever had sex (vaginal, anal, or oral) (%)
Sexual Behavior - Males 18+ that ever had vaginal sex with a woman (%)
Sexual Behavior - Males 18+ that ever performed oral sex on a woman (%)
Sexual Behavior - Males 18+ that ever had anal sex with a woman (%)
Sexual Behavior - Males 18+ that ever had any sex with a man (%)
Sexual Behavior - Females 18+ that ever had vaginal sex with a man (%)
Sexual Behavior - Females 18+ that ever performed oral sex on a man (%)
Sexual Behavior - Females 18+ that ever had anal sex with a man (%)
Sexual Behavior - Females 18+ that ever had any kind of sex with a woman (%)
Sexual Behavior - Average age people first had sex
Sexual Behavior - Average number of female sex partners in lifetime (males 18+)
Sexual Behavior - Average number of female vaginal sex partners in lifetime (males 18+)
Sexual Behavior - Average age people first performed oral sex on a woman (18+)
Sexual Behavior - Average number of woman performed oral sex on in lifetime (18+)
Sexual Behavior - Average number of male sex partners in lifetime (males 18+)
Sexual Behavior - Average number of male anal sex partners in lifetime (males 18+)
Sexual Behavior - Average age people first performed oral sex on a man (18+)
Sexual Behavior - Average number of male oral sex partners in lifetime (18+)
Sexual Behavior - People using protection when performing oral sex (%)
Sexual Behavior - Average number of times people have vaginal or anal sex a year
Sexual Behavior - People having sex without condom (%)
Sexual Behavior - Average number of male sex partners in lifetime (females 18+)
Sexual Behavior - Average number of male vaginal sex partners in lifetime (females 18+)
Sexual Behavior - Average number of female sex partners in lifetime (females 18+)
Sexual Behavior - Circumcised males 18+ (%)
Sleep Disorders - Average hours sleeping at night
Sleep Disorders - People that has trouble sleeping (%)
Smoking-Cigarette Use - People smoking cigarettes (%)
Taste & Smell - People 40+ having problems with smell (%)
Taste & Smell - People 40+ having problems with taste (%)
Taste & Smell - People 40+ that ever had wisdom teeth removed (%)
Taste & Smell - People 40+ that ever had tonsils teeth removed (%)
Taste & Smell - People 40+ that ever had a loss of consciousness because of a head injury (%)
Taste & Smell - People 40+ that ever had a broken nose or other serious injury to face or skull (%)
Taste & Smell - People 40+ that ever had two or more sinus infections (%)
Weight - Average height (inches)
Weight - Average weight (pounds)
Weight - Average BMI
Weight - People that are obese (%)
Weight - People that ever were obese (%)
Weight - People trying to lose weight (%)
Officers per 1,000 residents here:
1.80Texas average:
2.07
Latest news from Weslaco, TX collected exclusively by city-data.com from local newspapers, TV, and radio stations
Ancestries: American (5.4%).
Current Local Time:
Land area: 12.7 square miles.
Population density: 3,329 people per square mile (average).
6,655 residents are foreign born (14.7% Latin America ).
This city:
16.0%Texas:
17.1%
Median real estate property taxes paid for housing units with mortgages in 2022: $3,512 (2.1%)Median real estate property taxes paid for housing units with no mortgage in 2022: $1,260 (1.7%)
Nearest city with pop. 50,000+: Southeast Hidalgo, TX (0.6 miles
Nearest city with pop. 200,000+: Corpus Christi, TX
Nearest city with pop. 1,000,000+: San Antonio, TX
Nearest cities:
Latitude: 26.16 N, Longitude: 97.99 W
Nickname or alias (official or unofficial): Citrus Capital of Texas
Daytime population change due to commuting: +7,625 (+18.3%)Workers who live and work in this city: 7,113 (42.6%)
Property values in Weslaco, TX
Single-family new house construction building permits:
2022: 256 buildings , average cost: $249,1002021: 657 buildings , average cost: $239,1002020: 229 buildings , average cost: $172,8002019: 215 buildings , average cost: $107,0002018: 187 buildings , average cost: $91,0002017: 191 buildings , average cost: $99,4002016: 187 buildings , average cost: $96,4002015: 159 buildings , average cost: $111,2002014: 143 buildings , average cost: $82,3002013: 136 buildings , average cost: $88,1002012: 113 buildings , average cost: $89,1002011: 99 buildings , average cost: $90,2002010: 119 buildings , average cost: $96,0002009: 125 buildings , average cost: $94,0002008: 151 buildings , average cost: $104,5002007: 296 buildings , average cost: $93,4002006: 343 buildings , average cost: $85,2002005: 286 buildings , average cost: $84,8002004: 234 buildings , average cost: $67,3002003: 244 buildings , average cost: $71,4002002: 352 buildings , average cost: $57,5002001: 284 buildings , average cost: $55,2002000: 269 buildings , average cost: $46,9001999: 261 buildings , average cost: $50,1001998: 332 buildings , average cost: $47,0001997: 142 buildings , average cost: $57,400Unemployment in December 2023:
Population change in the 1990s: +1,231 (+4.8%).
Most common occupations in Weslaco, TX (%)
Both Males Females
Preschool, kindergarten, elementary, and middle school teachers (6.3%)
Nursing, psychiatric, and home health aides (4.3%)
Building and grounds cleaning and maintenance occupations (4.2%)
Other sales and related occupations, including supervisors (4.1%)
Retail sales workers, except cashiers (3.9%)
Secretaries and administrative assistants (3.9%)
Driver/sales workers and truck drivers (3.5%)
Driver/sales workers and truck drivers (6.4%)
Other sales and related occupations, including supervisors (5.9%)
Laborers and material movers, hand (5.2%)
Retail sales workers, except cashiers (4.3%)
Preschool, kindergarten, elementary, and middle school teachers (4.0%)
Sales representatives, services, wholesale and manufacturing (3.9%)
Material recording, scheduling, dispatching, and distributing workers (3.9%)
Preschool, kindergarten, elementary, and middle school teachers (8.8%)
Nursing, psychiatric, and home health aides (8.0%)
Secretaries and administrative assistants (7.9%)
Building and grounds cleaning and maintenance occupations (4.8%)
Information and record clerks, except customer service representatives (4.3%)
Child care workers (4.2%)
Health technologists and technicians (4.1%)
Air pollution and air quality trends(lower is better)
AQI Ozone PM2.5
Tornado activity:
Weslaco-area historical tornado activity is significantly below Texas state average. It is 77% smaller than the overall U.S. average.
On 5/12/1969, a category F3 (max. wind speeds 158-206 mph) tornado 19.5 miles away from the Weslaco city center caused between $5000 and $50,000 in damages.
On 5/12/1969, a category F3 tornado 24.4 miles away from the city center caused between $5000 and $50,000 in damages.
Earthquake activity:
Weslaco-area historical earthquake activity is slightly below Texas state average. It is 81% smaller than the overall U.S. average. On 10/20/2011 at 12:24:41, a magnitude 4.8 (4.8 MW, Depth: 3.1 mi, Class: Light, Intensity: IV - V) earthquake occurred 187.2 miles away from Weslaco center On 11/13/2017 at 11:23:01, a magnitude 3.9 (3.9 MD, Depth: 3.1 mi, Class: Light, Intensity: II - III) earthquake occurred 96.3 miles away from Weslaco center On 4/9/1993 at 12:29:19, a magnitude 4.3 (4.1 MB, 4.3 LG, Depth: 3.1 mi) earthquake occurred 183.6 miles away from the city center On 4/25/2010 at 02:10:42, a magnitude 3.9 (3.9 MB, Depth: 3.1 mi) earthquake occurred 107.5 miles away from Weslaco center On 4/14/1995 at 00:32:56, a magnitude 5.7 (5.6 MB, 5.7 MS, 5.7 MW, Depth: 11.1 mi, Class: Moderate, Intensity: VI - VII) earthquake occurred 434.3 miles away from Weslaco center On 3/24/1997 at 22:31:34, a magnitude 3.8 (3.8 LG, Depth: 3.1 mi) earthquake occurred 107.8 miles away from Weslaco center Magnitude types: regional Lg-wave magnitude (LG), body-wave magnitude (MB), duration magnitude (MD), surface-wave magnitude (MS), moment magnitude (MW) Natural disasters: The number of natural disasters in Hidalgo County (22) is greater than the US average (15).Major Disasters (Presidential) Declared: 12Emergencies Declared: 7Hurricanes: 12, Floods: 7, Storms: 6, Tornadoes: 3, Winds: 3, Fire: 1, Heavy Rain: 1, Tropical Storm: 1, Other: 1 (Note: some incidents may be assigned to more than one category). Hospitals in Weslaco: KNAPP MEDICAL CENTER (Voluntary non-profit - Private, provides emergency services, 1401 EAST EIGHT STREET) KNAPP MEDICAL CENTER HOSPICE CARE SERVICES (1401 EAST EIGHTH STREET) WESLACO REHABILITATION HOSPITAL (906 SOUTH JAMES) Nursing Homes in Weslaco: JOHN KNOX VIL OF THE RIO GRANDE VALLEY (1300 S BORDER AVE) KNAPP MEDICAL CENTER TRANSITIONAL CARE (1401 EAST EIGHTH STREET) RETAMA MANOR NURSING CENTER/WESLACO (721 AIRPORT DR) VALLEY GRANDE MANOR (1212 S BRIDGE) WESLACO NURSING AND REHABILITATION CENTER (422 E 18TH ST) Dialysis Facilities in Weslaco: NRI WESLACO (910 UTAH) US RENAL CARE MID VALLEY WESLACO DIALYSIS (1005 S. AIRPORT DRIVE) WESLACO DIALYSIS CENTER (1614 E COMMERCIAL DR) Home Health Centers in Weslaco: A AND I HEALTHCARE INC (1004 N ILLINOIS) A BEAUTIFUL DAY HEALTH CARE (614 SOUTH TEXAS BLVD) AMIGO HOME HEALTH AGENCY INC (505 ANGELITA SUITE 12, 13, &14) BALLI HOME HEALTH INC (1221 E 10TH STREET SUITE 103) CARE PLUS HOME HEALTH (617 SO TEXAS BLVD STE A) D ORO HOME HEALTH SERVICES (600 ANGELITA DR BLDG A STE 1 AND 2) ESSENTIAL HOME CARE INC (4013 STEFFY DRIVE) IN HOME HEALTH CARE SERVICES (1005 EAST 10TH STREET SUITE B) MILAGROS II HOME CARE INC (1008 NORTH BORDER AVENUE) SALUD EN SU HOGAR (10134 NORTH FM 88) SAMBRITT LLC (716 S TEXAS BLVD) Amtrak stations near Weslaco: 16 miles: MCALLEN (120 S. 16TH ST.) - Bus Station Services: enclosed waiting area, intercity bus service.
19 miles: HARLINGEN (215 E. MONROE ST.) - Bus Station Services: enclosed waiting area, public restrooms, public payphones.
Colleges/Universities in Weslaco: South Texas Vo-Tech Institute Full-time enrollment: 613; Location: 2419 E Haggar Ave; Private, for-profit; Website: www.stvt.edu)
Valley Grande Institute for Academic Studies Full-time enrollment: 508; Location: 345 S. Texas Blvd.; Private, not-for-profit; Website: vgi.edu)
Advanced Barber College and Hair Design Full-time enrollment: 257; Location: 2818 S International; Private, for-profit; Website: advancedbarbercollege.org/)
Colleges/universities with over 2000 students nearest to Weslaco:
The University of Texas-Pan American (about 16 miles; Edinburg, TX ; Full-time enrollment: 16,766)
South Texas College (about 18 miles; McAllen, TX ; FT enrollment: 19,701)
Texas State Technical College-Harlingen (about 21 miles; Harlingen, TX ; FT enrollment: 3,700)
The University of Texas at Brownsville (about 37 miles; Brownsville, TX ; FT enrollment: 9,165)
Texas A & M University-Kingsville (about 95 miles; Kingsville, TX ; FT enrollment: 9,295)
Texas A & M University-Corpus Christi (about 116 miles; Corpus Christi, TX ; FT enrollment: 9,092)
Del Mar College (about 117 miles; Corpus Christi, TX ; FT enrollment: 5,213)
Public high schools in Weslaco: WESLACO H S Students: 2,477, Location: 1005 W PIKE AVE, Grades: 8-12)WESLACO EAST H S Students: 1,982, Location: 810 S PLEASANTVIEW DR, Grades: 8-12)HIDALGO COUNTY BOOT CAMP Students: 35, Location: 1711 N BRIDGE, Grades: 8-12)IGNITE PUBLIC SCH AND COMM SERV CTR AT WESLACO Location: 615 S INTERNATIONAL BLVD, Grades: PK-12, Charter school )
IDEA COLLEGE PREP WESLACO Location: 2931 E SUGAR CANE DR, Grades: 6-9, Charter school )
SANTA MARIA DAEP Location: 811 E PIKE, Grades: 5-9)
HORTON DISCIPLINARY ALTERNATIVE EDUCATION PROGRAM Location: 104 S GARZA, Grades: 6-12)WESLACO 21ST CENTURY CTE EARLY COLLEGE H S Location: 700 S BRIDGE, Grades: 9)
Private high schools in Weslaco: VALLEY GRANDE ADVENTIST ACADEMY Students: 204, Location: 1000 S BRIDGE AVE, Grades: PK-12)
MID VALLEY CHRISTIAN SCHOOL Students: 136, Location: 417 S WESTGATE DR, Grades: PK-12)
Biggest public elementary/middle schools in Weslaco: DR R E MARGO EL Students: 1,195, Location: 1701 S BRIDGE AVE, Grades: PK-5)BEATRIZ G GARZA MIDDLE Students: 1,092, Location: 1111 W SUGAR CANE DR, Grades: 6-8)MARY HOGE MIDDLE Students: 1,019, Location: 2302 N INTERNATIONAL BLVD, Grades: 6-8)A N RICO EL Students: 995, Location: 2202 N INTERNATIONAL BLVD, Grades: PK-5)CLECKLER/HEALD EL Students: 929, Location: 1601 W SUGARCANE, Grades: PK-5)RODOLFO RUDY SILVA JR EL Students: 927, Location: 1001 W MILE 10, Grades: PK-5)RAUL A GONZALEZ JR EL Students: 889, Location: 3801 N 5 1/2 W, Grades: PK-5)AIRPORT EL Students: 850, Location: 410 N AIRPORT DR, Grades: PK-5)NORTH BRIDGE EL Students: 838, Location: 2001 N BRIDGE ST, Grades: PK-5)ARMANDO CUELLAR MIDDLE Students: 706, Location: 1201 S BRIDGE ST, Grades: 6-8)Private elementary/middle school in Weslaco: SAN MARTIN DE PORRES CATHOLIC SCHOOL Students: 59, Location: 905 N TEXAS BLVD, Grades: PK-3)
See full list of schools located in Weslaco Library in Weslaco: WESLACO PUBLIC LIBRARY Operating income: $885,273; Location: 525 S KANSAS AVE; 53,745 books ; 2,523 audio materials ; 1,397 video materials ; 5 local licensed databases ; 50 state licensed databases ; 1 other licensed databases ; 138 print serial subscriptions )
User-submitted facts and corrections:
Weslaco East High School is now a full 4 year high school, South Texas Community College is also located in Weslaco and KTEX and KBQF are now located in Weslaco.
Notable locations in Weslaco: (A) , Weslaco Fire Department and Emergency Medical Services (B) , Weslaco Fire Department Station 3 (C) , Weslaco Police Department (D) , Weslaco Public Library (E) , Weslaco Bicultural Museum (F) , South Star Ambulance Service (G) , Rio Valley Emergency Medical Service (H) , Saint Marys Ambulance Service (I) , Mobile Emergency Medical Service (J) . Display/hide their locations on the map
Churches in Weslaco include: (A) , First Spanish Assembly of God Church (B) , La Santisima Trinidad Methodist Church (C) , Abiding Savior Lutheran Church (D) , Grace Episcopal Church (E) , Church of the Nazarene (F) , Church of Christ (G) , Saint Martin de Porres Catholic Church (H) , Mount Sinai Baptist Church (I) . Display/hide their locations on the map
Cemetery: (1) . Display/hide its location on the map
Parks in Weslaco include: (1) , Weslaco City Park (2) , Barbee Field (3) , Alameda Park (4) , Gibson Park (5) . Display/hide their locations on the map
Hotel:
Birthplace of: Hector Cantú - Writer.
Hidalgo County has a predicted average indoor radon screening level less than 2 pCi/L (pico curies per liter) - Low Potential Average household size: This city:
3.1 peopleTexas:
2.8 people
Percentage of family households: This city:
78.5%Whole state:
69.9%
Percentage of households with unmarried partners: This city:
5.5%Whole state:
6.0%
Likely homosexual households (counted as self-reported same-sex unmarried-partner households)
Lesbian couples: 0.3% of all households Gay men: 0.2% of all households
People in group quarters in Weslaco in 2010:
488 people in nursing facilities/skilled-nursing facilities
102 people in correctional facilities intended for juveniles
47 people in workers' group living quarters and job corps centers
People in group quarters in Weslaco in 2000:
323 people in nursing homes
16 people in halfway houses
2 people in religious group quarters
Banks with branches in Weslaco (2011 data):
Compass Bank: Weslaco 1015 Branch, Weslaco Expressway Branch, Weslaco Main Branch. Info updated 2011/02/24: Bank assets: $63,107.0 mil, Deposits: $46,232.4 mil, headquarters in Birmingham, AL, negative income in the last year , Commercial Lending Specialization, 720 total offices , Holding Company: Banco Bilbao Vizcaya Argentaria, S.A.
Inter National Bank: City National Bank/Branch, Illinois Street Branch, Texas Street Branch. Info updated 2006/11/03: Bank assets: $2,065.7 mil, Deposits: $1,646.7 mil, headquarters in Mcallen, TX, positive income , Commercial Lending Specialization, 20 total offices , Holding Company: Grupo Financiero Banorte, S.A. De C.V.
International Bank of Commerce: Weslaco Branch at 606 South Texas Avenue, branch established on 1996/06/27; Instore - Wal-Mart Weslaco at 1310 N. Texas, branch established on 2005/05/18. Info updated 2007/03/28: Bank assets: $9,621.9 mil, Deposits: $6,548.8 mil, headquarters in Laredo, TX, positive income , Commercial Lending Specialization, 197 total offices , Holding Company: International Bancshares Corporation
First National Bank: Weslaco International Branch at 621 South International Drive, branch established on 1999/11/01; Border Branch at 911 W Expressway 83, branch established on 2003/06/30. Info updated 2007/09/20: Bank assets: $3,517.0 mil, Deposits: $2,598.8 mil, headquarters in Edinburg, TX, negative income in the last year , Commercial Lending Specialization, 58 total offices , Holding Company: First National Bank Group, Inc.
Lone Star National Bank: Weslaco Branch at 214 S. Texas Blvd, branch established on 2004/04/12; Weslaco North Branch at 620 West Expressway 83, branch established on 2011/10/25. Info updated 2010/05/05: Bank assets: $2,174.7 mil, Deposits: $1,815.0 mil, headquarters in Pharr, TX, positive income , Commercial Lending Specialization, 27 total offices , Holding Company: Lone Star National Bancshares--texas, Inc.
The Frost National Bank: Weslaco Branch at 701 North Airport Drive, branch established on 1995/06/01. Info updated 2006/12/21: Bank assets: $20,372.1 mil, Deposits: $16,846.8 mil, headquarters in San Antonio, TX, positive income , Commercial Lending Specialization, 133 total offices , Holding Company: Cullen/Frost Bankers, Inc.
Elsa State Bank and Trust Company: Weslaco Branch at 203 E. Business 83, branch established on 2000/09/05. Info updated 2006/11/03: Bank assets: $167.6 mil, Deposits: $152.7 mil, headquarters in Elsa, TX, positive income , 6 total offices
Rio Bank: Weslaco Branch at 1000 N. Westgate Drive, branch established on 2009/08/17. Info updated 2006/11/03: Bank assets: $206.9 mil, Deposits: $173.8 mil, headquarters in Mcallen, TX, positive income , Commercial Lending Specialization, 7 total offices , Holding Company: Rio Financial Services, Inc.
For population 15 years and over in Weslaco:
Never married: 34.5%Now married: 48.0%Separated: 3.7%Widowed: 5.8%Divorced: 8.0% For population 25 years and over in Weslaco:
High school or higher: 75.5%Bachelor's degree or higher: 23.0%Graduate or professional degree: 7.2%Unemployed: 14.3%Mean travel time to work (commute): 24.3 minutes
Education Gini index (Inequality in education) Here:
16.2Texas average:
14.0
Religion statistics for Weslaco, TX (based on Hidalgo County data)
Religion Adherents Congregations Catholic 269,071 56 Evangelical Protestant 75,327 525 Other 18,510 43 Mainline Protestant 14,394 52 Orthodox 160 1 None 397,307 -
Source: Clifford Grammich, Kirk Hadaway, Richard Houseal, Dale E.Jones, Alexei Krindatch, Richie Stanley and Richard H.Taylor. 2012. 2010 U.S.Religion Census: Religious Congregations & Membership Study. Association of Statisticians of American Religious Bodies. Jones, Dale E., et al. 2002. Congregations and Membership in the United States 2000. Nashville, TN: Glenmary Research Center. Graphs represent county-level data
Food Environment Statistics: Number of grocery stores : 79Here :
1.12 / 10,000 pop.Texas :
1.47 / 10,000 pop.
Number of supercenters and club stores : 6This county :
0.09 / 10,000 pop.State :
0.14 / 10,000 pop.
Number of convenience stores (no gas) : 67Hidalgo County :
0.95 / 10,000 pop.Texas :
1.11 / 10,000 pop.
Number of convenience stores (with gas) : 240Here :
3.40 / 10,000 pop.Texas :
3.95 / 10,000 pop.
Number of full-service restaurants : 337Here :
4.78 / 10,000 pop.Texas :
6.13 / 10,000 pop.
Adult diabetes rate : This county :
9.7%State :
8.9%
Adult obesity rate : Hidalgo County :
28.7%State :
26.6%
Low-income preschool obesity rate : Health and Nutrition:
Average overall health of teeth and gums : People feeling badly about themselves : People not drinking alcohol at all : This city:
10.5%State:
10.3%
Average hours sleeping at night : General health condition : Average condition of hearing : More about Health and Nutrition of Weslaco, TX Residents
Local government employment and payroll (March 2022)
Function
Full-time employees
Monthly full-time payroll
Average yearly full-time wage
Part-time employees
Monthly part-time payroll
Police Protection - Officers
84 $465,760 $66,537 0 $0 Firefighters
75 $477,690 $76,430 0 $0 Other Government Administration
30 $84,792 $33,917 1 $1,532 Solid Waste Management
24 $76,645 $38,323 0 $0 Police - Other
22 $71,329 $38,907 0 $0 Streets and Highways
21 $70,111 $40,063 0 $0 Sewerage
16 $41,695 $31,271 0 $0 Water Supply
14 $38,828 $33,281 0 $0 Financial Administration
13 $55,552 $51,279 1 $1,103 Parks and Recreation
12 $32,840 $32,840 0 $0 Other and Unallocable
12 $32,672 $32,672 0 $0 Local Libraries
11 $34,687 $37,840 7 $5,806 Water Transport and Terminals
5 $26,195 $62,868 1 $1,774 Health
4 $9,865 $29,595 0 $0 Judicial and Legal
3 $9,050 $36,200 2 $2,781 Fire - Other
2 $6,043 $36,258 1 $1,796
Totals for Government
348 $1,533,752 $52,888 13 $14,791
Weslaco government finances - Expenditure in 2017 (per resident):
Construction - Air Transportation: $1,220,000 ($28.89)
Parks and Recreation: $826,000 ($19.56)Current Operations - Police Protection: $6,596,000 ($156.19)
Local Fire Protection: $5,595,000 ($132.49)Solid Waste Management: $4,148,000 ($98.22)Sewerage: $3,158,000 ($74.78)Water Utilities: $2,870,000 ($67.96)Central Staff Services: $2,047,000 ($48.47)Regular Highways: $1,827,000 ($43.26)General - Other: $1,085,000 ($25.69)Judicial and Legal Services: $1,071,000 ($25.36)General Public Buildings: $902,000 ($21.36)Libraries: $717,000 ($16.98)Parks and Recreation: $710,000 ($16.81)Financial Administration: $697,000 ($16.50)Air Transportation: $688,000 ($16.29)Other Capital Outlay - Regular Highways: $350,000 ($8.29)
Water Utilities: $226,000 ($5.35)General - Other: $198,000 ($4.69)Local Fire Protection: $166,000 ($3.93)Sewerage: $161,000 ($3.81)Parks and Recreation: $157,000 ($3.72)Air Transportation: $63,000 ($1.49)Police Protection: $58,000 ($1.37)Central Staff Services: $34,000 ($0.81)Total Salaries and Wages: $12,195,000 ($288.77)
Water Utilities - Interest on Debt: $2,616,000 ($61.95)
Weslaco government finances - Revenue in 2017 (per resident):
Charges - Solid Waste Management: $4,666,000 ($110.49)
Sewerage: $4,365,000 ($103.36)Other: $1,611,000 ($38.15)Air Transportation: $182,000 ($4.31)Miscellaneous Commercial Activities: $48,000 ($1.14)Parks and Recreation: $13,000 ($0.31)Federal Intergovernmental - Other: $157,000 ($3.72)
Miscellaneous - Fines and Forfeits: $677,000 ($16.03)
General Revenue - Other: $171,000 ($4.05)Rents: $112,000 ($2.65)Interest Earnings: $36,000 ($0.85)Donations From Private Sources: $25,000 ($0.59)Revenue - Water Utilities: $5,531,000 ($130.97)
State Intergovernmental - Other: $1,548,000 ($36.66)
General Local Government Support: $100,000 ($2.37)Tax - Property: $10,642,000 ($251.99)
General Sales and Gross Receipts: $8,683,000 ($205.61)Public Utilities Sales: $1,566,000 ($37.08)Other License: $334,000 ($7.91)Other Selective Sales: $223,000 ($5.28)Occupation and Business License - Other: $156,000 ($3.69)Amusements License: $3,000 ($0.07)Amusements Sales: $3,000 ($0.07)
Weslaco government finances - Debt in 2017 (per resident):
Long Term Debt - Beginning Outstanding - Unspecified Public Purpose: $84,121,000 ($1991.93)
Outstanding Unspecified Public Purpose: $76,161,000 ($1803.44)Retired Unspecified Public Purpose: $7,960,000 ($188.49)Beginning Outstanding - Public Debt for Private Purpose: $4,965,000 ($117.57)Outstanding Nonguaranteed - Industrial Revenue: $4,335,000 ($102.65)Retired Nonguaranteed - Public Debt for Private Purpose: $630,000 ($14.92)
Weslaco government finances - Cash and Securities in 2017 (per resident):
Other Funds - Cash and Securities: $15,217,000 ($360.33)
Sinking Funds - Cash and Securities: $6,088,000 ($144.16)
2.90% of this county's 2021 resident taxpayers lived in other counties in 2020 ($46,406 average adjusted gross income )
Here:
2.90%Texas average:
8.12%
0.01% of residents moved from foreign countries ($200 average AGI )Hidalgo County:
0.01%Texas average:
0.04%
Top counties from which taxpayers relocated into this county between 2020 and 2021:
2.73% of this county's 2020 resident taxpayers moved to other counties in 2021 ($45,511 average adjusted gross income )
Here:
2.73%Texas average:
7.40%
0.01% of residents moved to foreign countries ($147 average AGI )Hidalgo County:
0.01%Texas average:
0.03%
Top counties to which taxpayers relocated from this county between 2020 and 2021:
Businesses in Weslaco, TX
Name Count Name Count
AT&T 1 Long John Silver's 1 Academy Sports + Outdoors 1 Lowe's 1 Ace Hardware 1 Marriott 1 Advance Auto Parts 1 MasterBrand Cabinets 1 AutoZone 1 McDonald's 3 Best Western 1 Nike 2 Blockbuster 1 Office Depot 1 Burger King 2 Olive Garden 1 CVS 1 Payless 1 Chevrolet 1 Penske 1 Church's Chicken 3 Pizza Hut 2 Cricket Wireless 10 Quiznos 1 Curves 1 RadioShack 1 Dairy Queen 1 SONIC Drive-In 1 Dennys 1 Sears 1 Discount Tire 1 Sephora 1 Domino's Pizza 1 Sprint Nextel 1 FedEx 8 Starbucks 1 Firestone Complete Auto Care 1 Subway 3 GNC 1 Super 8 1 GameStop 1 T-Mobile 3 H&R Block 2 T.J.Maxx 1 Holiday Inn 1 Taco Bell 1 Home Depot 1 True Value 1 IHOP 1 U-Haul 1 JCPenney 1 UPS 5 Jack In The Box 1 Vans 1 KFC 1 Walgreens 1 La-Z-Boy 1 Walmart 1 Little Caesars Pizza 1 Wendy's 1
Strongest AM radio stations in Weslaco:
KGBT (1530 AM; 50 kW; HARLINGEN, TX; Owner: TICHENOR LICENSE CORPORATION)
KRGE (1290 AM; 5 kW; WESLACO, TX; Owner: CHRISTIAN MINISTRIES OF THE VALLEY)
KUBR (1210 AM; 10 kW; SAN JUAN, TX; Owner: PAULINO BERNAL)
KURV (710 AM; 10 kW; EDINBURG, TX; Owner: VOICE OF VALLEY AGRICULTURE, INC.)
KVJY (840 AM; 5 kW; PHARR, TX; Owner: RADIO UNICA OF MCALLEN LICENSE CORP.)
KRIO (910 AM; 5 kW; MCALLEN, TX; Owner: RIO GRANDE BIBLE INSTITUTE, INC.)
KQXX (1700 AM; 10 kW; BROWNSVILLE, TX; Owner: LA NUEVA KBOR, INC.)
KBOR (1600 AM; 10 kW; BROWNSVILLE, TX; Owner: LA NUEVA KBOR, INC.)
KCTA (1030 AM; 50 kW; CORPUS CHRISTI, TX; Owner: BROADCASTING CORPORATION OF THE SOUTHWEST)
KSOX (1240 AM; 1 kW; RAYMONDVILLE, TX; Owner: VOICE OF VALLEY AGRICULTURE, INC.)
KKYX (680 AM; 50 kW; SAN ANTONIO, TX; Owner: CXR HOLDINGS, INC.)
KTKR (760 AM; 50 kW; SAN ANTONIO, TX; Owner: CCB TEXAS LICENSES, L.P.)
KIRT (1580 AM; 1 kW; MISSION, TX; Owner: BRAVO BROADCASTING COMPANY, INC.)
Strongest FM radio stations in Weslaco:
KVLY (107.9 FM; EDINBURG, TX; Owner: ENTRAVISION HOLDINGS, L.L.C.)
KTEX (100.3 FM; BROWNSVILLE, TX; Owner: CAPSTAR TX LIMITED PARTNERSHIP)
KBFM (104.1 FM; EDINBURG, TX; Owner: CAPSTAR TX LIMITED PARTNERSHIP)
KFRQ (94.5 FM; HARLINGEN, TX; Owner: ENTRAVISION HOLDINGS, L.L.C.)
KGBT-FM (98.5 FM; MCALLEN, TX; Owner: TICHENOR LICENSE CORPORATION ("TLC"))
KVMV (96.9 FM; MCALLEN, TX; Owner: WORLD RADIO NETWORK, INC.)
KBTQ (96.1 FM; HARLINGEN, TX; Owner: TICHENOR LICENSE CORPORATION ("TLC"))
KKPS (99.5 FM; BROWNSVILLE, TX; Owner: ENTRAVISION HOLDINGS, L.L.C.)
KMAZ (106.3 FM; MERCEDES, TX; Owner: LA NUEVA KBOR, INC.)
KJAV (104.9 FM; ALAMO, TX; Owner: PAULINO BERNAL)
KOIR (88.5 FM; EDINBURG, TX; Owner: RIO GRANDE BIBLE INSTITUTE, INC.)
KILM (102.1 FM; RAYMONDVILLE, TX; Owner: BMP 102.1 FM, LP)
KBIC (105.7 FM; RAYMONDVILLE, TX; Owner: CHRISTIAN MINISTRIES OF THE VALLEY)
KQXX-FM (105.5 FM; MISSION, TX; Owner: LA NUEVA KBOR, INC.)
K206BP (89.1 FM; WESLACO, TX; Owner: WORLD RADIO NETWORK, INC.)
TV broadcast stations around Weslaco:
KRGV-TV (Channel 5; WESLACO, TX; Owner: MOBILE VIDEO TAPES, INC.)
KTLM (Channel 40; RIO GRANDE CITY, TX; Owner: SUNBELT MULTIMEDIA CO.)
KNVO (Channel 48; Mc ALLEN, TX; Owner: ENTRAVISION HOLDINGS, LLC)
KVEO (Channel 23; BROWNSVILLE, TX; Owner: COMCORP OF TEXAS LICENSE CORP.)
KGBT-TV (Channel 4; HARLINGEN, TX; Owner: LIBCO, INC.)
KMBH (Channel 60; HARLINGEN, TX; Owner: RGV EDUCATIONAL BROADCASTING, INC.)
KLUJ (Channel 44; HARLINGEN, TX; Owner: COMMUNITY EDUCATIONAL TELEVISION)
KFTN-LP (Channel 30; La FERIA, TX; Owner: ORTIZ BROADCASTING CORPORATION)
KSFE-LP (Channel 67; McALLEN, TX; Owner: ORTIZ BROADCASTING CORPORATION)
KLIA-LP (Channel 32; McALLEN, TX; Owner: ORTIZ BROADCASTING CORPORATION)
KTIZ-LP (Channel 52; HARLINGEN, TX; Owner: ORTIZ BROADCASTING CORPORATION)
K57FE (Channel 57; MCALLEN, TX; Owner: CHANNEL 57, INC.)
KZMC-LP (Channel 35; McALLEN, TX; Owner: ZAVALETTA BROADCASTING OF THE RIO GRANDE VALLEY, LLC)
KSTI-LP (Channel 69; McALLEN, TX; Owner: FAITH PLEASES GOD CHURCH CORPORATION)
KJST-LP (Channel 28; McALLEN, TX; Owner: FAITH PLEASES GOD CHURCH CORPORATION)
National Bridge Inventory (NBI) Statistics 27 Number of bridges600ft / 183m Total length $8,000 Total costs460,618 Total average daily traffic45,229 Total average daily truck traffic
New bridges - historical statistics
1 1940-1949 1 1950-1959 2 1960-1969 2 1980-1989 1 1990-1999 20 2000-2009
See full National Bridge Inventory statistics for Weslaco, TX
Home Mortgage Disclosure Act Aggregated Statistics For Year 2009(Based on 2 full and 5 partial tracts) A) FHA, FSA/RHS & VA B) Conventional C) Refinancings D) Home Improvement Loans F) Non-occupant Loans on G) Loans On Manufactured Number Average Value Number Average Value Number Average Value Number Average Value Number Average Value Number Average Value
LOANS ORIGINATED 72 $111,767 41 $118,454 94 $128,119 12 $29,181 8 $114,490 8 $39,321 APPLICATIONS APPROVED, NOT ACCEPTED 3 $68,063 4 $187,945 30 $107,864 10 $32,335 2 $40,140 0 $0 APPLICATIONS DENIED 10 $123,600 21 $105,193 117 $102,557 61 $24,362 8 $69,972 4 $32,848 APPLICATIONS WITHDRAWN 5 $119,488 4 $240,945 36 $114,703 9 $43,943 1 $35,980 2 $30,200 FILES CLOSED FOR INCOMPLETENESS 1 $71,470 1 $40,000 23 $97,286 10 $42,337 1 $17,950 0 $0
Aggregated Statistics For Year 2008(Based on 2 full and 5 partial tracts) A) FHA, FSA/RHS & VA B) Conventional C) Refinancings D) Home Improvement Loans E) Loans on Dwellings For 5+ Families F) Non-occupant Loans on G) Loans On Manufactured Number Average Value Number Average Value Number Average Value Number Average Value Number Average Value Number Average Value Number Average Value
LOANS ORIGINATED 63 $122,547 91 $114,980 97 $99,276 45 $33,642 1 $146,580 21 $94,449 5 $25,132 APPLICATIONS APPROVED, NOT ACCEPTED 5 $93,414 19 $92,083 37 $103,654 15 $41,742 0 $0 5 $97,816 5 $53,254 APPLICATIONS DENIED 11 $127,073 51 $91,112 195 $93,434 123 $32,929 0 $0 21 $66,960 11 $35,487 APPLICATIONS WITHDRAWN 6 $136,155 15 $131,575 36 $127,825 10 $62,771 0 $0 4 $85,270 0 $0 FILES CLOSED FOR INCOMPLETENESS 2 $213,375 3 $181,573 21 $116,611 12 $32,734 0 $0 3 $64,163 0 $0
Aggregated Statistics For Year 2007(Based on 2 full and 5 partial tracts) A) FHA, FSA/RHS & VA B) Conventional C) Refinancings D) Home Improvement Loans E) Loans on Dwellings For 5+ Families F) Non-occupant Loans on G) Loans On Manufactured Number Average Value Number Average Value Number Average Value Number Average Value Number Average Value Number Average Value Number Average Value
LOANS ORIGINATED 34 $106,091 205 $103,951 138 $94,039 61 $27,372 1 $43,600 33 $97,059 13 $35,628 APPLICATIONS APPROVED, NOT ACCEPTED 3 $92,883 43 $89,328 54 $89,679 17 $31,936 1 $468,240 15 $72,571 3 $32,833 APPLICATIONS DENIED 9 $108,081 93 $86,474 261 $95,688 144 $34,628 1 $545,090 34 $57,978 11 $34,070 APPLICATIONS WITHDRAWN 1 $133,710 49 $96,007 95 $95,368 17 $51,222 0 $0 15 $118,831 1 $41,010 FILES CLOSED FOR INCOMPLETENESS 0 $0 11 $79,910 34 $151,487 10 $57,899 0 $0 5 $64,796 0 $0
Aggregated Statistics For Year 2006(Based on 2 full and 5 partial tracts) A) FHA, FSA/RHS & VA B) Conventional C) Refinancings D) Home Improvement Loans E) Loans on Dwellings For 5+ Families F) Non-occupant Loans on G) Loans On Manufactured Number Average Value Number Average Value Number Average Value Number Average Value Number Average Value Number Average Value Number Average Value
LOANS ORIGINATED 26 $101,587 223 $91,460 178 $100,177 60 $28,179 5 $754,196 50 $71,025 9 $32,733 APPLICATIONS APPROVED, NOT ACCEPTED 3 $118,233 62 $105,853 57 $97,291 22 $28,487 0 $0 9 $67,681 5 $46,888 APPLICATIONS DENIED 9 $111,902 114 $86,680 201 $89,519 135 $31,091 1 $109,010 35 $79,524 22 $35,455 APPLICATIONS WITHDRAWN 5 $107,504 52 $104,541 109 $99,883 18 $35,312 0 $0 11 $53,248 2 $42,865 FILES CLOSED FOR INCOMPLETENESS 1 $77,000 12 $95,361 27 $118,861 9 $65,706 1 $583,270 1 $36,070 0 $0
Aggregated Statistics For Year 2005(Based on 2 full and 5 partial tracts) A) FHA, FSA/RHS & VA B) Conventional C) Refinancings D) Home Improvement Loans E) Loans on Dwellings For 5+ Families F) Non-occupant Loans on G) Loans On Manufactured Number Average Value Number Average Value Number Average Value Number Average Value Number Average Value Number Average Value Number Average Value
LOANS ORIGINATED 22 $98,315 206 $80,223 177 $83,995 71 $49,933 4 $133,762 44 $81,039 15 $31,133 APPLICATIONS APPROVED, NOT ACCEPTED 3 $115,547 42 $57,963 56 $73,181 19 $33,464 0 $0 6 $47,302 10 $31,589 APPLICATIONS DENIED 5 $95,502 122 $68,680 271 $75,650 105 $29,884 0 $0 14 $68,714 23 $28,443 APPLICATIONS WITHDRAWN 3 $125,340 46 $87,821 117 $97,512 38 $128,402 0 $0 9 $119,147 2 $21,765 FILES CLOSED FOR INCOMPLETENESS 1 $103,690 12 $98,239 52 $132,087 1 $138,390 0 $0 2 $43,745 0 $0
Aggregated Statistics For Year 2004(Based on 2 full and 5 partial tracts) A) FHA, FSA/RHS & VA B) Conventional C) Refinancings D) Home Improvement Loans E) Loans on Dwellings For 5+ Families F) Non-occupant Loans on G) Loans On Manufactured Number Average Value Number Average Value Number Average Value Number Average Value Number Average Value Number Average Value Number Average Value
LOANS ORIGINATED 31 $96,369 159 $81,958 212 $87,540 55 $32,010 5 $332,592 29 $62,849 16 $19,269 APPLICATIONS APPROVED, NOT ACCEPTED 3 $82,283 32 $86,081 55 $80,293 15 $36,331 0 $0 4 $37,355 3 $33,753 APPLICATIONS DENIED 18 $98,046 68 $57,496 221 $73,432 89 $30,792 0 $0 22 $65,244 31 $27,258 APPLICATIONS WITHDRAWN 6 $79,838 26 $93,930 126 $94,722 17 $33,065 0 $0 4 $51,102 3 $23,877 FILES CLOSED FOR INCOMPLETENESS 0 $0 2 $52,820 46 $104,489 3 $47,803 0 $0 1 $133,730 0 $0
Aggregated Statistics For Year 2003(Based on 2 full and 5 partial tracts) A) FHA, FSA/RHS & VA B) Conventional C) Refinancings D) Home Improvement Loans F) Non-occupant Loans on Number Average Value Number Average Value Number Average Value Number Average Value Number Average Value
LOANS ORIGINATED 32 $87,707 138 $79,100 260 $84,711 44 $23,102 38 $66,737 APPLICATIONS APPROVED, NOT ACCEPTED 2 $43,910 32 $84,783 65 $80,376 9 $34,914 5 $37,708 APPLICATIONS DENIED 9 $76,280 70 $63,314 247 $65,535 72 $17,072 19 $66,803 APPLICATIONS WITHDRAWN 8 $52,869 21 $70,052 114 $74,068 8 $13,210 8 $42,394 FILES CLOSED FOR INCOMPLETENESS 1 $109,160 2 $64,675 10 $80,041 1 $76,300 1 $71,940
Aggregated Statistics For Year 2002(Based on 1 full and 4 partial tracts) A) FHA, FSA/RHS & VA B) Conventional C) Refinancings D) Home Improvement Loans E) Loans on Dwellings For 5+ Families F) Non-occupant Loans on Number Average Value Number Average Value Number Average Value Number Average Value Number Average Value Number Average Value
LOANS ORIGINATED 34 $81,750 129 $78,024 164 $82,715 38 $17,376 3 $229,100 32 $54,453 APPLICATIONS APPROVED, NOT ACCEPTED 5 $69,684 24 $68,697 36 $74,377 7 $21,767 0 $0 3 $36,150 APPLICATIONS DENIED 9 $76,613 60 $50,465 126 $63,685 57 $20,218 0 $0 10 $26,477 APPLICATIONS WITHDRAWN 0 $0 12 $84,381 56 $78,832 3 $12,087 0 $0 1 $42,130 FILES CLOSED FOR INCOMPLETENESS 3 $62,520 5 $32,464 12 $72,427 2 $14,040 0 $0 1 $16,000
Aggregated Statistics For Year 2001(Based on 1 full and 4 partial tracts) A) FHA, FSA/RHS & VA B) Conventional C) Refinancings D) Home Improvement Loans E) Loans on Dwellings For 5+ Families F) Non-occupant Loans on Number Average Value Number Average Value Number Average Value Number Average Value Number Average Value Number Average Value
LOANS ORIGINATED 26 $83,600 112 $60,554 114 $80,527 37 $10,045 4 $173,475 23 $75,160 APPLICATIONS APPROVED, NOT ACCEPTED 7 $68,837 27 $38,884 32 $70,197 2 $9,990 0 $0 2 $43,110 APPLICATIONS DENIED 4 $65,958 91 $37,449 91 $57,144 36 $12,188 0 $0 10 $31,446 APPLICATIONS WITHDRAWN 4 $78,858 21 $57,452 31 $58,128 4 $12,735 1 $343,000 5 $62,178 FILES CLOSED FOR INCOMPLETENESS 2 $63,600 4 $75,205 10 $81,380 1 $12,150 0 $0 1 $7,270
Aggregated Statistics For Year 2000(Based on 1 full and 4 partial tracts) A) FHA, FSA/RHS & VA B) Conventional C) Refinancings D) Home Improvement Loans F) Non-occupant Loans on Number Average Value Number Average Value Number Average Value Number Average Value Number Average Value
LOANS ORIGINATED 19 $78,414 127 $53,368 60 $65,458 40 $7,749 24 $42,271 APPLICATIONS APPROVED, NOT ACCEPTED 3 $39,537 45 $48,178 14 $90,840 9 $19,078 4 $67,540 APPLICATIONS DENIED 6 $56,365 152 $41,710 56 $62,336 45 $7,266 11 $32,763 APPLICATIONS WITHDRAWN 1 $64,680 16 $43,431 24 $50,470 4 $7,535 4 $42,790 FILES CLOSED FOR INCOMPLETENESS 1 $67,550 5 $58,664 11 $76,333 1 $9,240 0 $0
Aggregated Statistics For Year 1999(Based on 1 full and 6 partial tracts) A) FHA, FSA/RHS & VA B) Conventional C) Refinancings D) Home Improvement Loans E) Loans on Dwellings For 5+ Families F) Non-occupant Loans on Number Average Value Number Average Value Number Average Value Number Average Value Number Average Value Number Average Value
LOANS ORIGINATED 29 $59,197 152 $53,492 93 $70,918 55 $10,066 2 $1,544,910 26 $45,972 APPLICATIONS APPROVED, NOT ACCEPTED 0 $0 50 $34,609 23 $53,813 5 $33,560 0 $0 2 $47,110 APPLICATIONS DENIED 6 $64,473 253 $40,448 64 $55,007 60 $7,312 0 $0 15 $39,961 APPLICATIONS WITHDRAWN 3 $88,327 28 $53,635 33 $47,624 6 $7,958 0 $0 2 $44,930 FILES CLOSED FOR INCOMPLETENESS 3 $60,563 6 $82,922 13 $63,133 1 $48,380 0 $0 0 $0
Detailed HMDA statistics for the following Tracts:
0222.02
, 0223.00 , 0224.00 , 0225.02 , 0226.00 , 0227.01 , 0227.02
Private Mortgage Insurance Companies Aggregated Statistics For Year 2009(Based on 2 full and 4 partial tracts) A) Conventional B) Refinancings Number Average Value Number Average Value
LOANS ORIGINATED 7 $186,547 7 $224,437 APPLICATIONS APPROVED, NOT ACCEPTED 4 $263,238 0 $0 APPLICATIONS DENIED 5 $202,160 0 $0 APPLICATIONS WITHDRAWN 2 $231,390 0 $0 FILES CLOSED FOR INCOMPLETENESS 1 $417,000 0 $0
Aggregated Statistics For Year 2008(Based on 2 full and 5 partial tracts) A) Conventional B) Refinancings C) Non-occupant Loans on Number Average Value Number Average Value Number Average Value
LOANS ORIGINATED 35 $136,629 9 $178,617 5 $94,088 APPLICATIONS APPROVED, NOT ACCEPTED 12 $127,784 2 $167,280 0 $0 APPLICATIONS DENIED 3 $134,027 2 $169,000 2 $169,000 APPLICATIONS WITHDRAWN 1 $33,430 1 $216,560 1 $33,430 FILES CLOSED FOR INCOMPLETENESS 0 $0 0 $0 0 $0
Aggregated Statistics For Year 2007(Based on 2 full and 5 partial tracts) A) Conventional B) Refinancings C) Non-occupant Loans on Number Average Value Number Average Value Number Average Value
LOANS ORIGINATED 70 $116,907 15 $136,515 7 $81,649 APPLICATIONS APPROVED, NOT ACCEPTED 11 $101,185 6 $190,008 1 $70,600 APPLICATIONS DENIED 4 $192,078 1 $278,000 0 $0 APPLICATIONS WITHDRAWN 1 $124,000 0 $0 0 $0 FILES CLOSED FOR INCOMPLETENESS 0 $0 0 $0 0 $0
Aggregated Statistics For Year 2006(Based on 2 full and 5 partial tracts) A) Conventional B) Refinancings C) Non-occupant Loans on Number Average Value Number Average Value Number Average Value
LOANS ORIGINATED 35 $107,356 8 $166,999 3 $103,177 APPLICATIONS APPROVED, NOT ACCEPTED 7 $125,957 3 $135,083 1 $22,600 APPLICATIONS DENIED 1 $37,790 0 $0 0 $0 APPLICATIONS WITHDRAWN 0 $0 1 $219,460 0 $0 FILES CLOSED FOR INCOMPLETENESS 0 $0 0 $0 0 $0
Aggregated Statistics For Year 2005(Based on 2 full and 5 partial tracts) A) Conventional B) Refinancings C) Non-occupant Loans on Number Average Value Number Average Value Number Average Value
LOANS ORIGINATED 36 $93,307 14 $124,532 3 $97,137 APPLICATIONS APPROVED, NOT ACCEPTED 5 $122,236 4 $142,132 0 $0 APPLICATIONS DENIED 0 $0 1 $161,000 0 $0 APPLICATIONS WITHDRAWN 0 $0 2 $128,955 0 $0 FILES CLOSED FOR INCOMPLETENESS 1 $35,000 0 $0 0 $0
Aggregated Statistics For Year 2004(Based on 2 full and 5 partial tracts) A) Conventional B) Refinancings C) Non-occupant Loans on Number Average Value Number Average Value Number Average Value
LOANS ORIGINATED 42 $85,488 32 $115,778 3 $63,090 APPLICATIONS APPROVED, NOT ACCEPTED 5 $112,498 8 $115,151 0 $0 APPLICATIONS DENIED 0 $0 0 $0 0 $0 APPLICATIONS WITHDRAWN 1 $39,290 2 $227,745 0 $0 FILES CLOSED FOR INCOMPLETENESS 0 $0 0 $0 0 $0
Aggregated Statistics For Year 2003(Based on 2 full and 5 partial tracts) A) Conventional B) Refinancings C) Non-occupant Loans on Number Average Value Number Average Value Number Average Value
LOANS ORIGINATED 42 $92,077 38 $104,465 5 $65,704 APPLICATIONS APPROVED, NOT ACCEPTED 7 $71,814 6 $129,638 0 $0 APPLICATIONS DENIED 0 $0 1 $196,850 0 $0 APPLICATIONS WITHDRAWN 1 $224,550 1 $115,060 0 $0 FILES CLOSED FOR INCOMPLETENESS 0 $0 0 $0 0 $0
Aggregated Statistics For Year 2002(Based on 1 full and 4 partial tracts) A) Conventional B) Refinancings C) Non-occupant Loans on Number Average Value Number Average Value Number Average Value
LOANS ORIGINATED 37 $91,410 28 $112,689 4 $72,912 APPLICATIONS APPROVED, NOT ACCEPTED 2 $99,885 4 $104,742 1 $68,050 APPLICATIONS DENIED 1 $54,510 0 $0 0 $0 APPLICATIONS WITHDRAWN 1 $84,300 0 $0 0 $0 FILES CLOSED FOR INCOMPLETENESS 0 $0 0 $0 0 $0
Aggregated Statistics For Year 2001(Based on 4 partial tracts) A) Conventional B) Refinancings C) Non-occupant Loans on Number Average Value Number Average Value Number Average Value
LOANS ORIGINATED 25 $74,442 12 $123,552 2 $58,535 APPLICATIONS APPROVED, NOT ACCEPTED 2 $104,260 2 $61,570 0 $0 APPLICATIONS DENIED 0 $0 1 $81,820 0 $0 APPLICATIONS WITHDRAWN 0 $0 1 $106,820 0 $0 FILES CLOSED FOR INCOMPLETENESS 0 $0 0 $0 0 $0
Aggregated Statistics For Year 2000(Based on 1 full and 4 partial tracts) A) Conventional B) Refinancings C) Non-occupant Loans on Number Average Value Number Average Value Number Average Value
LOANS ORIGINATED 15 $80,988 7 $76,200 1 $67,910 APPLICATIONS APPROVED, NOT ACCEPTED 1 $74,850 3 $131,933 0 $0 APPLICATIONS DENIED 1 $207,110 0 $0 0 $0 APPLICATIONS WITHDRAWN 0 $0 1 $66,130 0 $0 FILES CLOSED FOR INCOMPLETENESS 2 $62,100 0 $0 1 $56,710
Aggregated Statistics For Year 1999(Based on 1 full and 6 partial tracts) A) Conventional B) Refinancings Number Average Value Number Average Value
LOANS ORIGINATED 26 $84,115 20 $102,150 APPLICATIONS APPROVED, NOT ACCEPTED 3 $97,587 4 $70,410 APPLICATIONS DENIED 1 $109,370 2 $75,225 APPLICATIONS WITHDRAWN 0 $0 1 $52,100 FILES CLOSED FOR INCOMPLETENESS 0 $0 1 $51,380
Detailed PMIC statistics for the following Tracts:
0222.02
, 0223.00 , 0224.00 , 0225.02 , 0226.00 , 0227.01 , 0227.02 Fire-safe hotels and motels in Weslaco, Texas:
Best Western Palm Aire Hotel & Suites, 415 S International Blvd, Weslaco, Texas 78596 Phone: (956) 969-2411, Fax: (956) 969-2211
Fairfield Inn And Suites Weslaco, 1005 Fairfield Blvd At Expy 83, Weslaco, Texas 78596 Phone: (956) 968-6700, Fax: (956) 968-6701
Americas Best Value Inn, 3021 E Expwy 83, Weslaco, Texas 78599 Phone: (956) 447-8088, Fax: (956) 447-9340
Holiday Inn Express Hotel & Suites, 421 S International Blvd, Weslaco, Texas 78596 Phone: (956) 973-2222, Fax: (956) 968-9222
Texas Inn, 1818 N Texas Blvd, Weslaco, Texas 78599 Phone: (956) 351-5657, Fax: (956) 351-5657
Super 8 by Wyndham Weslaco, 1702 E Expy 83, Weslaco, Texas 78596 Phone: (956) 351-6203
All 6 fire-safe hotels and motels in Weslaco, Texas
Most common first names in Weslaco, TX among deceased individuals Name Count Lived (average)
Maria 256 77.3 years Jose 174 73.2 years Juan 111 69.5 years Guadalupe 109 76.7 years Mary 79 80.0 years William 79 79.2 years John 72 77.9 years James 66 76.9 years Pedro 63 74.6 years Manuel 61 77.1 years
Most common last names in Weslaco, TX among deceased individuals Last name Count Lived (average)
Garcia 147 72.1 years Gonzalez 135 77.3 years Martinez 134 75.4 years Garza 133 71.6 years Rodriguez 127 74.8 years Hernandez 108 74.5 years Lopez 84 72.6 years Perez 69 75.7 years Sanchez 58 75.0 years Pena 57 71.9 years
Weslaco compared to Texas state average:
Median house value significantly below state average. Black race population percentage significantly below state average. Hispanic race population percentage significantly above state average. Length of stay since moving in significantly above state average.
#64 on the list of "Top 101 cities with the largest city-data.com crime index per police officer (population 5,000+)"
#89 on the list of "Top 101 cities with the highest number of thefts per 100,000 residents, excludes tourist destinations and others with a lot of outsiders visiting based on city industries data (population 5,000+)"
#90 on the list of "Top 101 cities with the largest city-data.com crime index increase from 2011 to 2012 (population 5,000+)"
#91 on the list of "Top 101 cities with the largest positive percentage difference between never married females and males (15+ years) (with at least 1,000 females never married)"
#4 on the list of "Top 101 counties with the worst general health status score of residents (1-5), 3 years of data"
#4 on the list of "Top 101 counties with the highest number of births per 1000 residents 2007-2013"
#5 on the list of "Top 101 counties with the lowest percentage of residents relocating to other counties in 2011"
#7 on the list of "Top 101 counties with the lowest percentage of residents that smoked 100+ cigarettes in their lives"
#8 on the list of "Top 101 counties with the lowest percentage of residents that exercised in the past month"
Top Patent Applicants
Mona Damaj (2)
Abraham Tanus (2)
Eunice Delia Reyes (2)
Eunice D. Reyes (1)
David R. Rivera (1)
Sonia C. Irigoyen (1)
Juan Huerta (1)
Kranthi Mandadi (1)
Sonia Irigoyen (1)
Manikandan Ramasamy (1)
Total of 12 patent applications in 2008-2024.


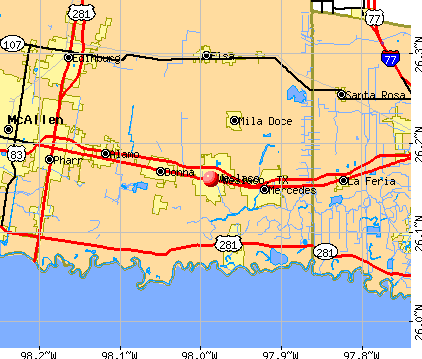


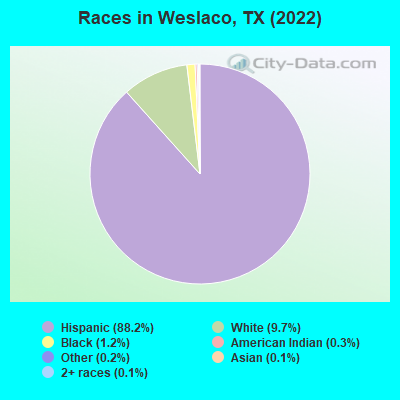
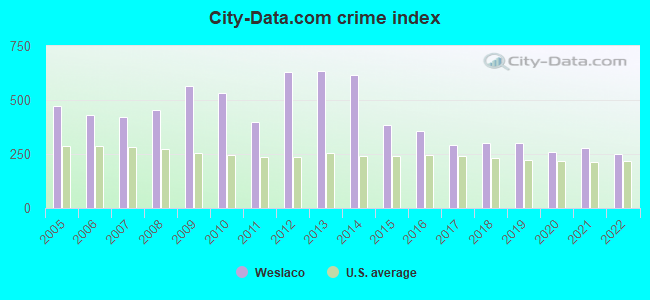
 Recent articles from our blog. Our writers, many of them Ph.D. graduates or candidates, create easy-to-read articles on a wide variety of topics.

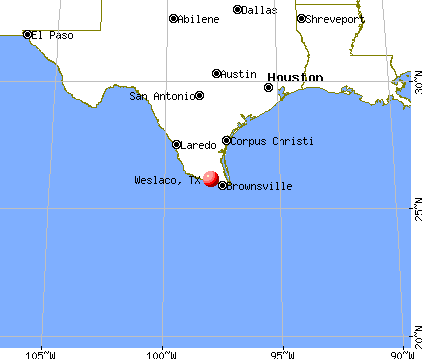
 , pop. 102,051).
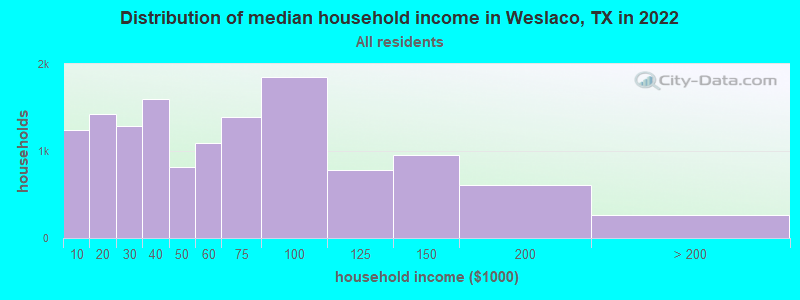


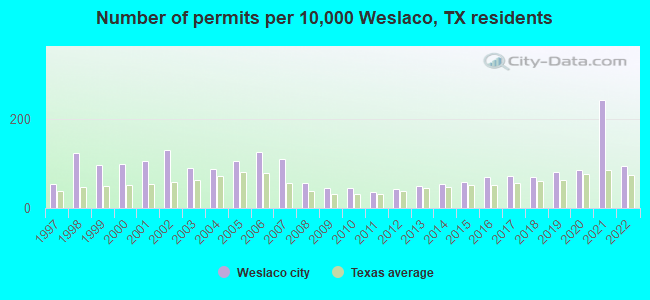
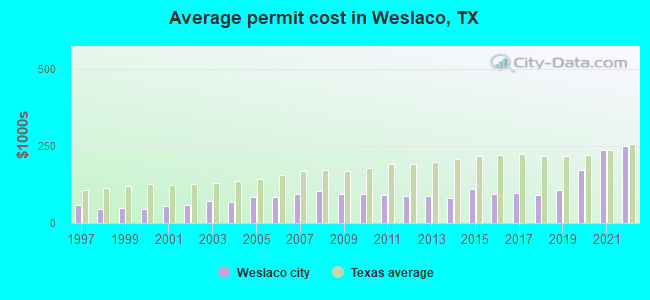
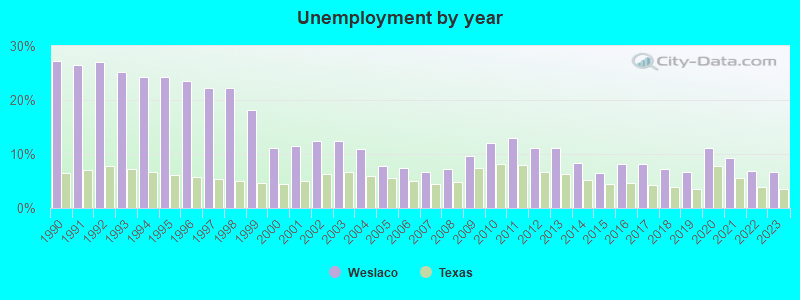
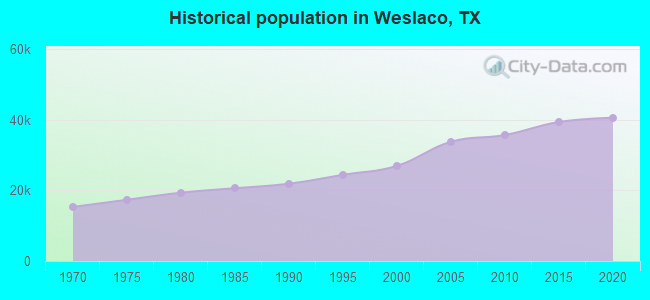
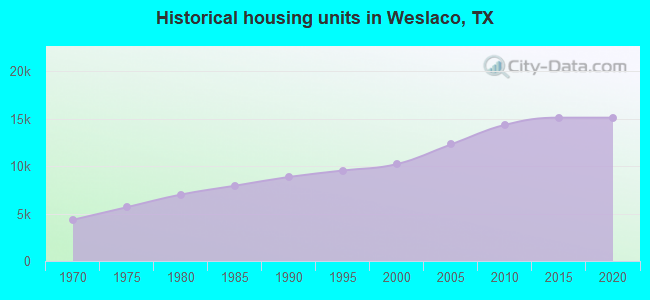

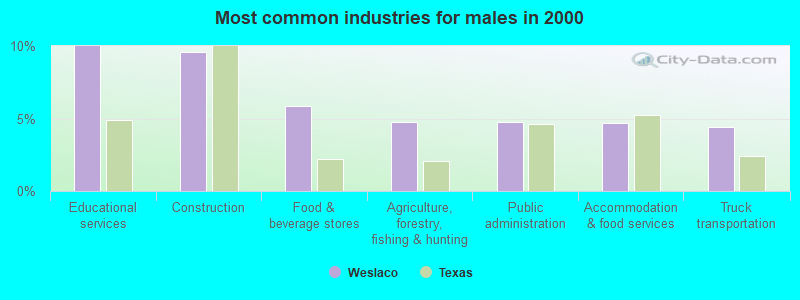
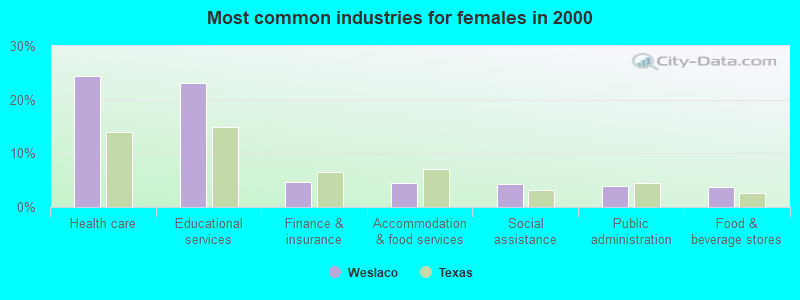
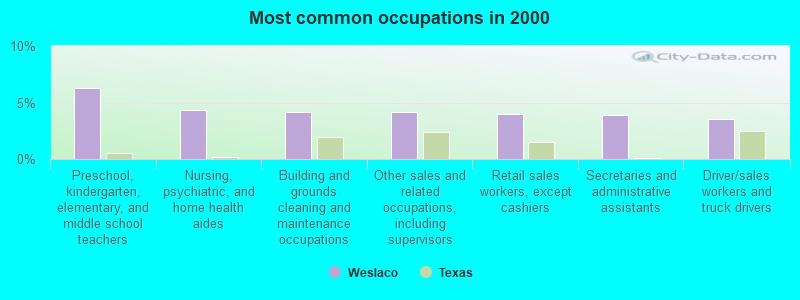
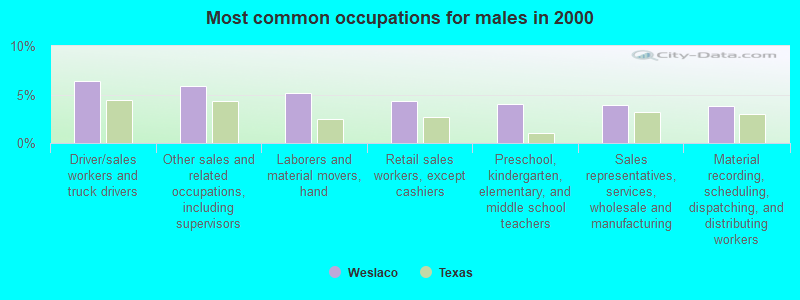
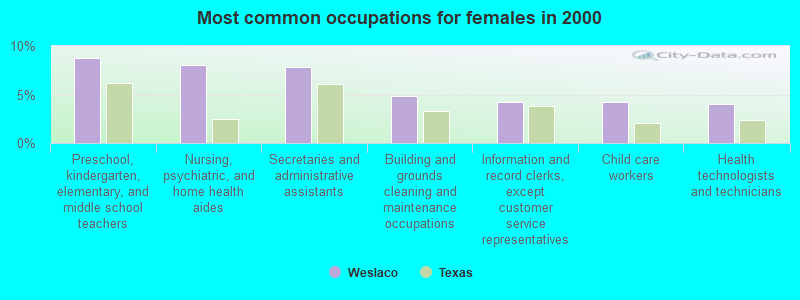


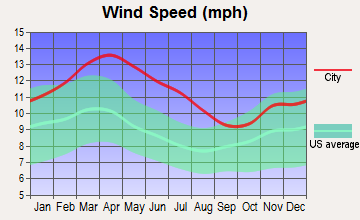


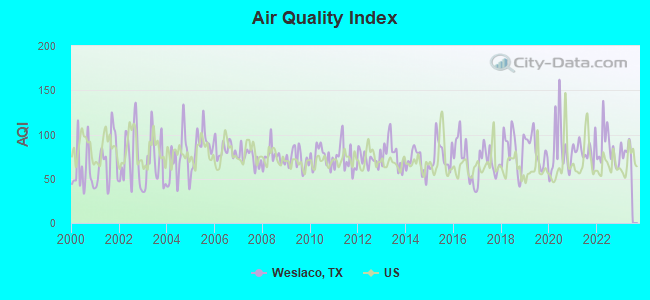
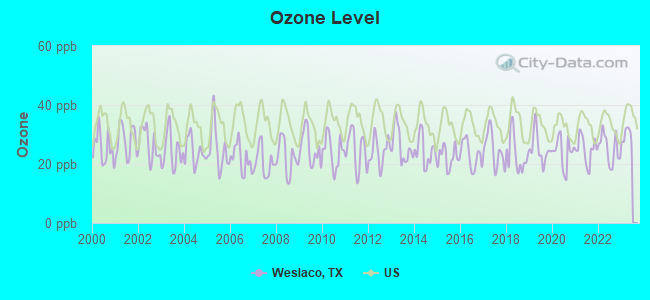
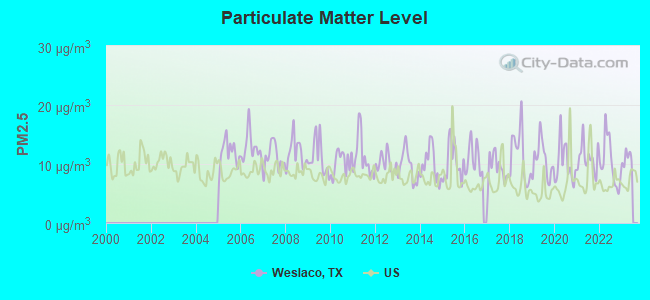

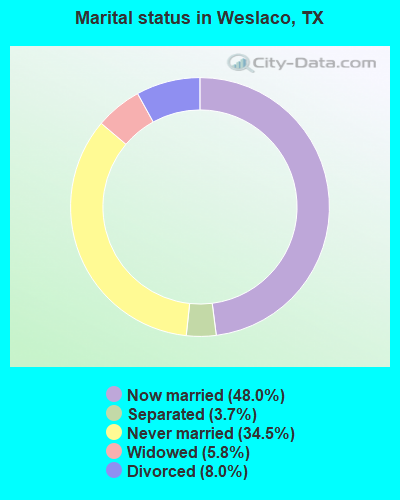
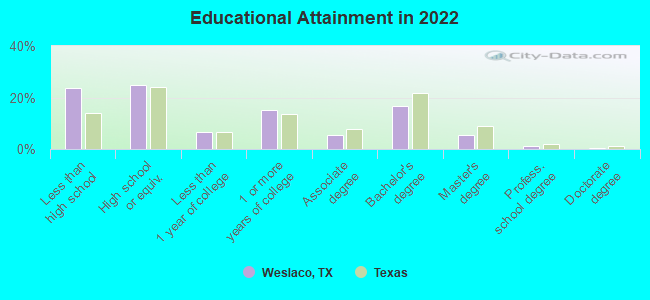
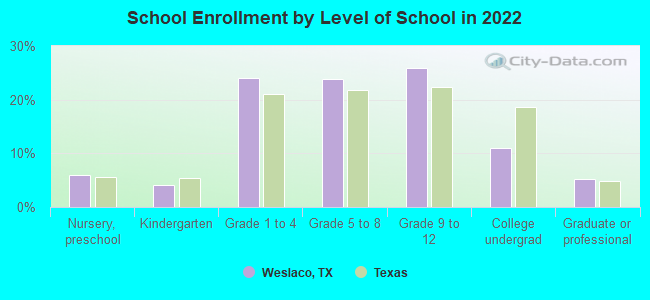
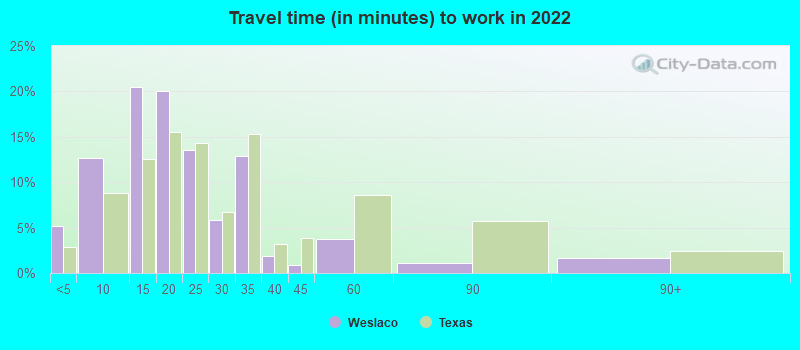
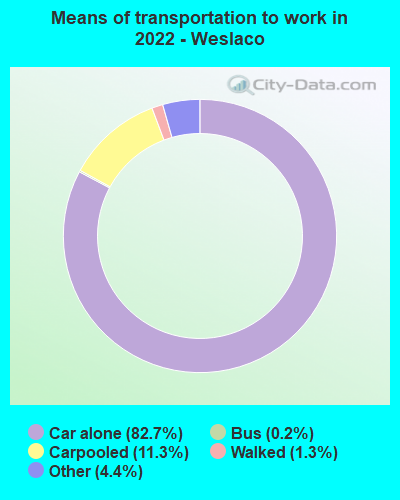
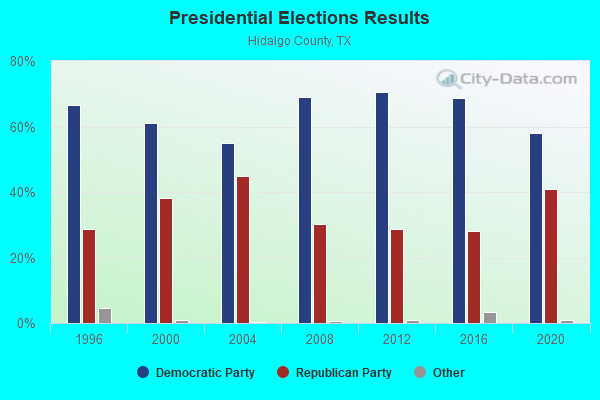
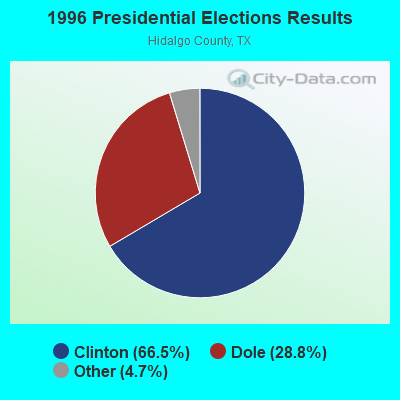
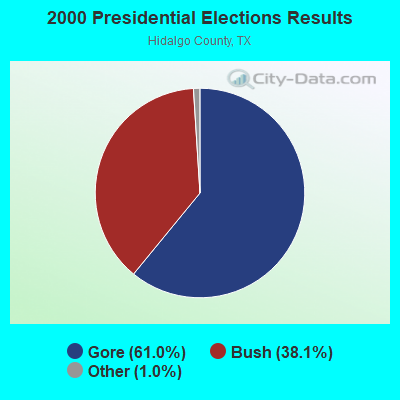
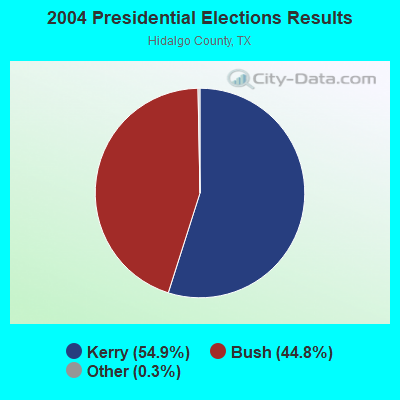
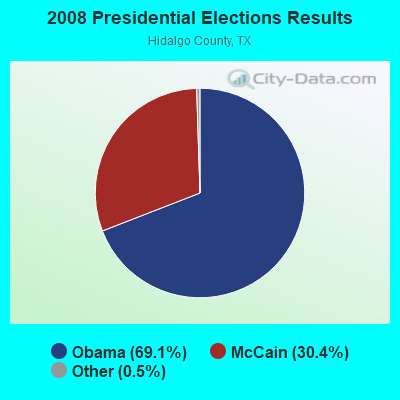
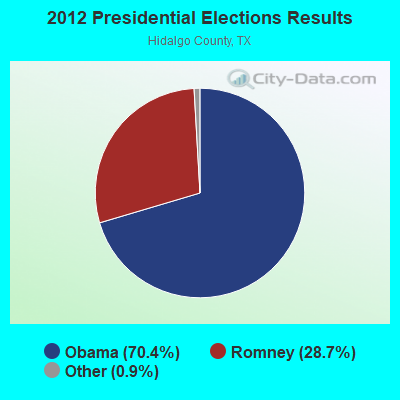
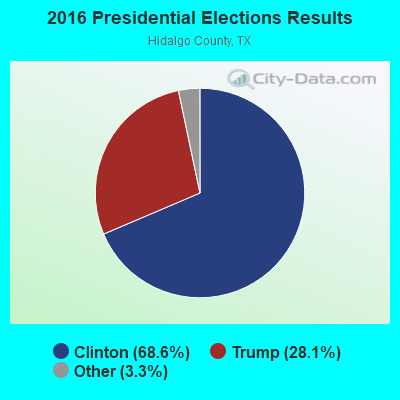
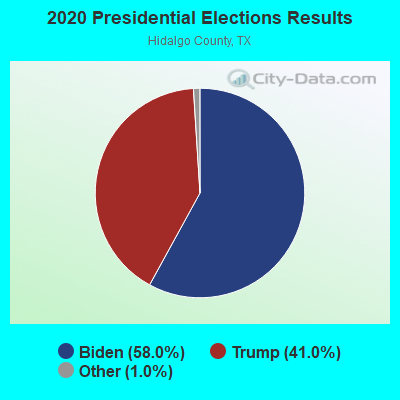
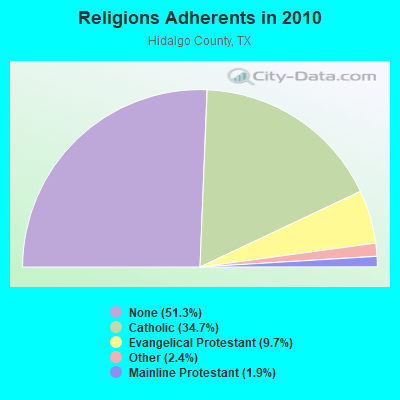
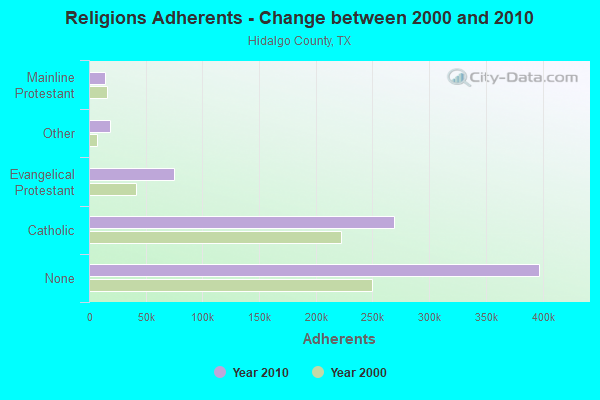
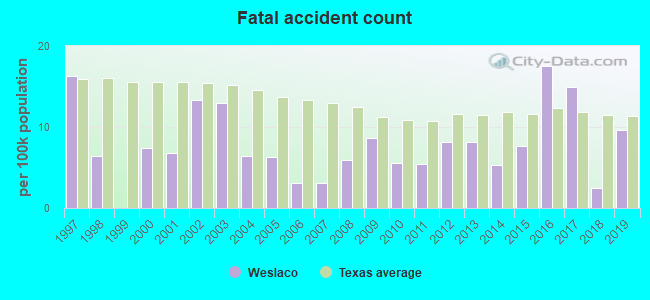
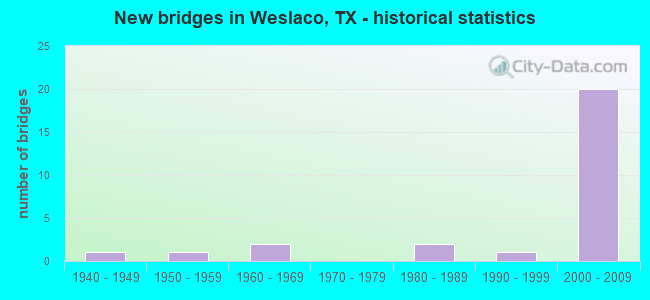
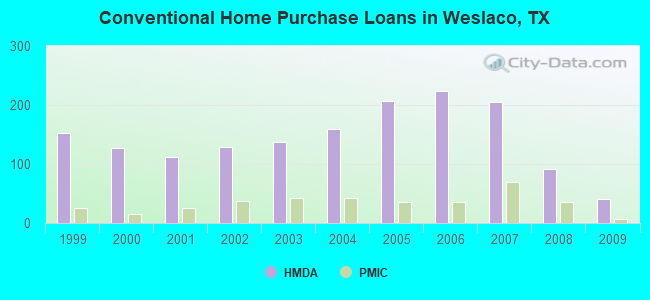
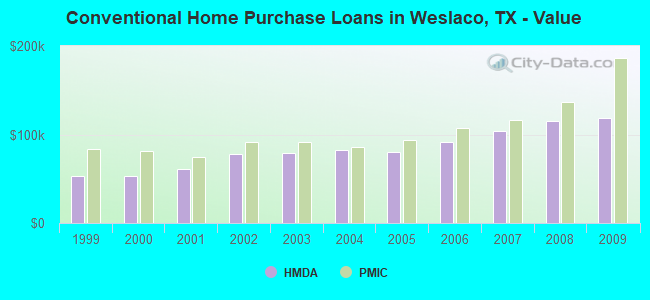
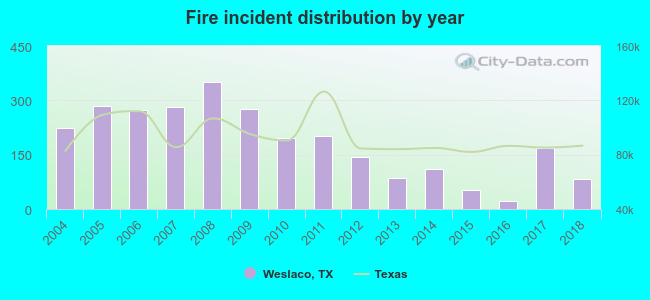 According to the data from the years 2004 - 2018 the average number of fire incidents per year is 183. The highest number of reported fire incidents - 350 took place in 2008, and the least - 22 in 2016. The data has a decreasing trend.
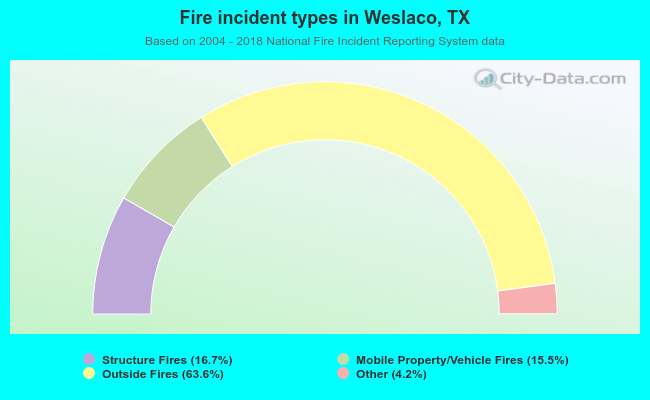 When looking into fire subcategories, the most reports belonged to: Outside Fires (63.6%), and Structure Fires (16.7%).