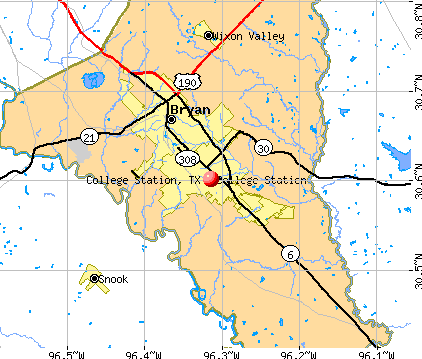
College Station, Texas
College Station: Red, White, And Blue Out Aggie Football (after 9/11)
College Station

College Station: College Station - Downtown

College Station: Bonfire Memorial
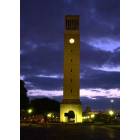
College Station: The Albritton Bell Tower - This 138-foot tower contains 49 carillon bells that were cast in France with total weight of 17 tons, with largest weighing 6,500 pounds.
College Station: College Station (Texas Ave @ New Main)
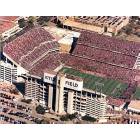
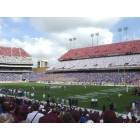
College Station: Kyle Field in College Station (Largest Crowd 87,555)
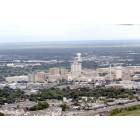
College Station: Downtown College Station
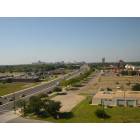
College Station: college station downtown

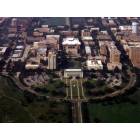
College Station: Aerial View
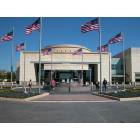
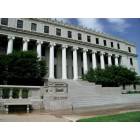
College Station: George Bush Presidential Library at Texas A&M University
- see
20
more - add
your
Submit your own pictures of this city and show them to the world
- OSM Map
- General Map
- Google Map
- MSN Map
Population change since 2000: +83.1%
| Males: 64,334 | |
| Females: 59,985 |
| Median resident age: | 22.9 years |
| Texas median age: | 35.6 years |
Zip codes: 77840.
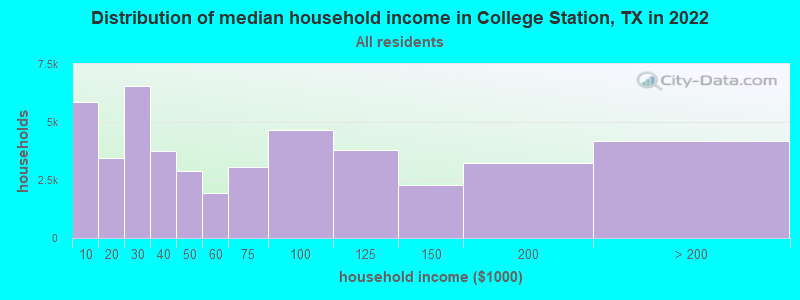
| College Station: | $51,228 |
| TX: | $72,284 |
Estimated per capita income in 2022: $30,542 (it was $15,170 in 2000)
College Station city income, earnings, and wages data
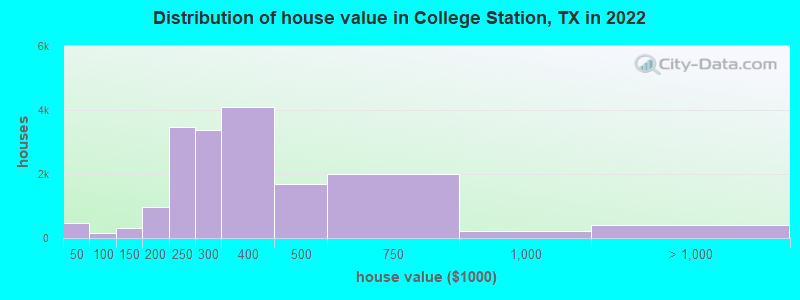
Estimated median house or condo value in 2022: $326,000 (it was $114,000 in 2000)
| College Station: | $326,000 |
| TX: | $275,400 |
Mean prices in 2022: all housing units: $409,871; detached houses: $425,363; townhouses or other attached units: $255,203; in 2-unit structures: $284,053; in 3-to-4-unit structures: $239,007; in 5-or-more-unit structures: $341,349; mobile homes: $111,672
Median gross rent in 2022: $1,134.
College Station, TX residents, houses, and apartments details
(28.8% for White Non-Hispanic residents, 29.7% for Black residents, 32.1% for Hispanic or Latino residents, 43.5% for American Indian residents, 35.2% for other race residents, 24.9% for two or more races residents)
Detailed information about poverty and poor residents in College Station, TX


Compare current foreclosures near College Station, TX:
| Photo | Address | Area | Beds / Baths | Price | Details |
|---|---|---|---|---|---|

|
#1
Baker Meadow Loop
College Station, TX 77845
|
- sq. feet
|
2 baths 4 beds |
show details | |

|
#2
Winged Foot Dr
College Station, TX 77845
|
2,561 sq. feet
|
3 baths 4 beds |
show details | |

|
#3
Maplewood Ct
College Station, TX 77845
|
2,616 sq. feet
|
2 baths 4 beds |
show details | |

|
#4
Strasburg Cir
College Station, TX 77845
|
1,738 sq. feet
|
2 baths 4 beds |
show details | |

|
#5
Marta St
College Station, TX 77845
|
2,307 sq. feet
|
3 baths 4 beds |
show details | |

|
#6
Belsay Ave
College Station, TX 77845
|
1,860 sq. feet
|
2 baths 4 beds |
show details | |

|
#7
Cherry St
College Station, TX 77840
|
- sq. feet
|
- baths - beds |
show details | |

|
#8
Holleman Dr Apt 72
College Station, TX 77840
|
- sq. feet
|
- baths - beds |
show details | |

|
#9
Woodview Dr
College Station, TX 77845
|
- sq. feet
|
- baths - beds |
show details | |

|
#10
Decatur Dr, Apt 2105
College Station, TX 77845
|
- sq. feet
|
- baths - beds |
show details |
| Photo | Address | Area | Beds / Baths | Price | Details |
|---|---|---|---|---|---|

|
#11
Roans Chapel Rd
College Station, TX 77845
|
- sq. feet
|
- baths - beds |
show details | |

|
#12
Roans Chapel Rd
College Station, TX 77845
|
- sq. feet
|
- baths - beds |
show details | |

|
#13
Vincent Rd
College Station, TX 77845
|
- sq. feet
|
- baths - beds |
show details | |

|
#14
Portland Ave
College Station, TX 77845
|
- sq. feet
|
- baths - beds |
show details | |

|
#15
Holleman Dr Apt 1908
College Station, TX 77840
|
- sq. feet
|
- baths - beds |
show details | |

|
#16
Kinnersly Ln
College Station, TX 77845
|
- sq. feet
|
- baths - beds |
show details | |

|
#17
Karten Ln
College Station, TX 77845
|
- sq. feet
|
- baths - beds |
show details | |

|
#18
Sterling St
College Station, TX 77840
|
1,872 sq. feet
|
- baths - beds |
show details | |

|
#19
University Oaks Blvd Apt 1606
College Station, TX 77840
|
- sq. feet
|
- baths - beds |
show details | |

|
#20
Harvey Mitchell Pkwy S # 11304
College Station, TX 77845
|
- sq. feet
|
- baths - beds |
show details |
| Photo | Address | Area | Beds / Baths | Price | Details |
|---|---|---|---|---|---|

|
#21
White Creek Rd
College Station, TX 77845
|
- sq. feet
|
- baths - beds |
show details | |

|
#22
Pintail Loop
College Station, TX 77845
|
1,474 sq. feet
|
- baths - beds |
show details | |

|
#23
Yellowhouse Cir Apt B
College Station, TX 77840
|
- sq. feet
|
- baths - beds |
show details | |

|
#24
Walnut Nook Ct
College Station, TX 77845
|
- sq. feet
|
- baths - beds |
show details | |

|
#25
Mountain Wind Loop
Bryan, TX 77807
|
1,180 sq. feet
|
2 baths 3 beds |
show details | |

|
#26
E 31st St
Bryan, TX 77802
|
1,233 sq. feet
|
1 baths 2 beds |
show details | |

|
#27
E 28th St
Bryan, TX 77802
|
1,054 sq. feet
|
1 baths 2 beds |
show details | |

|
#28
Homestead St
Bryan, TX 77803
|
1,449 sq. feet
|
1 baths 2 beds |
show details | |

|
#29
Midwest Dr
Bryan, TX 77802
|
1,902 sq. feet
|
2 baths 4 beds |
show details | |

|
#30
Windsor Dr
Bryan, TX 77802
|
2,038 sq. feet
|
2 baths 3 beds |
show details |
| Photo | Address | Area | Beds / Baths | Price | Details |
|---|---|---|---|---|---|

|
#31
S Pioneer Trl
Bryan, TX 77808
|
1,750 sq. feet
|
2 baths 3 beds |
show details | |

|
#32
Cliff Rd
Bryan, TX 77808
|
1,943 sq. feet
|
- baths - beds |
show details | |

|
#33
Tabor Rd
Bryan, TX 77808
|
2,500 sq. feet
|
- baths - beds |
show details | |

|
#34
Hedley Pl
Bryan, TX 77807
|
- sq. feet
|
- baths - beds |
show details | |

|
#35
Douglas St
Bryan, TX 77808
|
- sq. feet
|
- baths - beds |
show details | |

|
#36
Mariposa Ct
Bryan, TX 77808
|
- sq. feet
|
- baths - beds |
show details | |

|
#37
County Road 172
Iola, TX 77861
|
- sq. feet
|
- baths - beds |
show details | |

|
#38
Old Reliance Rd
Bryan, TX 77808
|
- sq. feet
|
- baths - beds |
show details | |

|
#39
Cliff Rd
Bryan, TX 77808
|
1,943 sq. feet
|
- baths - beds |
show details | |

|
#40
Gopher Ln
Bryan, TX 77808
|
1,792 sq. feet
|
- baths - beds |
show details |
| Photo | Address | Area | Beds / Baths | Price | Details |
|---|---|---|---|---|---|

|
#41
Mount Hope
Bryan, TX 77807
|
- sq. feet
|
- baths - beds |
show details | |

|
#42
Castle Ave
Bryan, TX 77808
|
- sq. feet
|
- baths - beds |
show details | |

|
#43
New York St
Bryan, TX 77803
|
- sq. feet
|
- baths - beds |
show details | |

|
#44
Franklin Dr
Bryan, TX 77801
|
- sq. feet
|
- baths - beds |
show details | |

|
#45
Archer Cir
Bryan, TX 77808
|
- sq. feet
|
- baths - beds |
show details | |

|
#46
Agee Ct
Bryan, TX 77808
|
- sq. feet
|
- baths - beds |
show details | |

|
#47
Hazel St
Bryan, TX 77803
|
984 sq. feet
|
- baths - beds |
show details | |

|
#48
Marquis Dr
Bryan, TX 77803
|
- sq. feet
|
- baths - beds |
show details | |

|
#49
Markley Dr
Bryan, TX 77807
|
- sq. feet
|
- baths - beds |
show details | |

|
Check over 1 million property listings on Foreclosure.com!
|
browse all offers | |||


- 72,43858.3%White alone
- 22,40218.0%Hispanic
- 11,4159.2%Asian alone
- 10,8248.7%Black alone
- 6,2865.1%Two or more races
- 5320.4%American Indian alone
- 3700.3%Other race alone
- 590.05%Native Hawaiian and Other
Pacific Islander alone
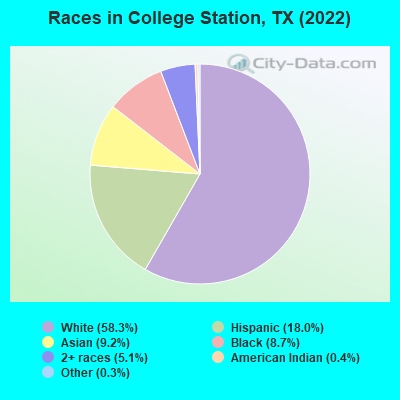
Races in College Station detailed stats: ancestries, foreign born residents, place of birth
According to our research of Texas and other state lists, there were 73 registered sex offenders living in College Station, Texas as of June 12, 2024.
The ratio of all residents to sex offenders in College Station is 1,506 to 1.
The ratio of registered sex offenders to all residents in this city is much lower than the state average.
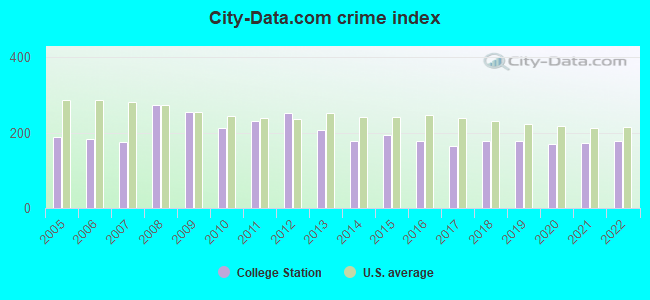
The City-Data.com crime index weighs serious crimes and violent crimes more heavily. Higher means more crime, U.S. average is 246.1. It adjusts for the number of visitors and daily workers commuting into cities.
- means the value is smaller than the state average.- means the value is about the same as the state average.
- means the value is bigger than the state average.
- means the value is much bigger than the state average.
Crime rate in College Station detailed stats: murders, rapes, robberies, assaults, burglaries, thefts, arson
Full-time law enforcement employees in 2021, including police officers: 201 (146 officers - 134 male; 12 female).
| Officers per 1,000 residents here: | 1.20 |
| Texas average: | 2.07 |
 Recent articles from our blog. Our writers, many of them Ph.D. graduates or candidates, create easy-to-read articles on a wide variety of topics.


Latest news from College Station, TX collected exclusively by city-data.com from local newspapers, TV, and radio stations
Ancestries: German (10.5%), English (7.1%), Irish (5.2%), American (4.4%), European (3.9%), Italian (1.9%).
Current Local Time: CST time zone
Land area: 40.3 square miles.
Population density: 3,088 people per square mile (average).
15,241 residents are foreign born (7.4% Asia, 3.2% Latin America).
| This city: | 12.3% |
| Texas: | 17.1% |
Median real estate property taxes paid for housing units with mortgages in 2022: $5,762 (1.7%)
Median real estate property taxes paid for housing units with no mortgage in 2022: $5,071 (1.6%)
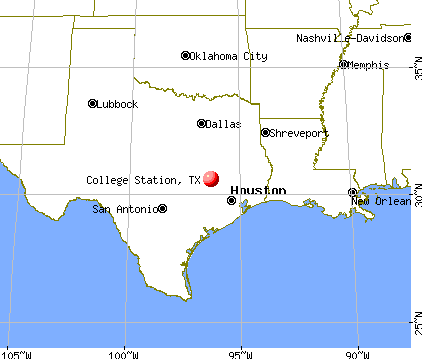
Nearest city with pop. 200,000+: Northwest Harris, TX (60.6 miles  , pop. 405,444).
Nearest city with pop. 1,000,000+: Houston, TX (80.4 miles , pop. 1,953,631).
Nearest cities:
), ), ), ), ), )Latitude: 30.60 N, Longitude: 96.31 W
Daytime population change due to commuting: +5,101 (+4.1%)
Workers who live and work in this city: 41,651 (67.4%)
Area code commonly used in this area: 979

College Station tourist attractions:
College Station, Texas accommodation & food services, waste management - Economy and Business Data
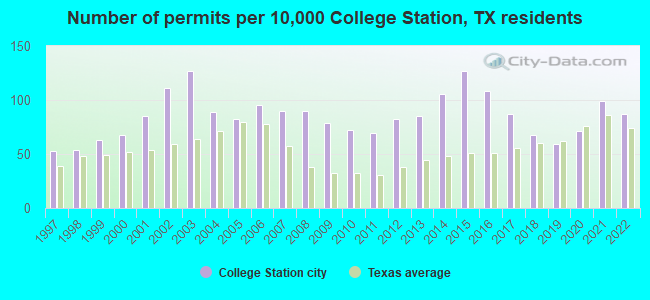
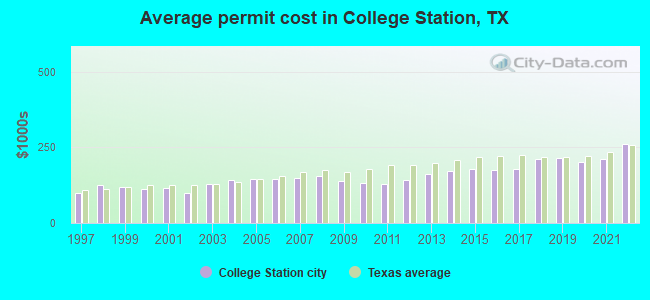
Single-family new house construction building permits:
- 2022: 592 buildings, average cost: $260,900
- 2021: 674 buildings, average cost: $212,900
- 2020: 484 buildings, average cost: $201,200
- 2019: 398 buildings, average cost: $214,000
- 2018: 459 buildings, average cost: $211,800
- 2017: 594 buildings, average cost: $177,500
- 2016: 735 buildings, average cost: $175,900
- 2015: 860 buildings, average cost: $179,300
- 2014: 722 buildings, average cost: $173,300
- 2013: 575 buildings, average cost: $162,700
- 2012: 555 buildings, average cost: $142,000
- 2011: 466 buildings, average cost: $129,700
- 2010: 491 buildings, average cost: $132,000
- 2009: 534 buildings, average cost: $139,200
- 2008: 614 buildings, average cost: $154,000
- 2007: 614 buildings, average cost: $150,000
- 2006: 646 buildings, average cost: $145,000
- 2005: 559 buildings, average cost: $147,300
- 2004: 604 buildings, average cost: $140,500
- 2003: 860 buildings, average cost: $128,200
- 2002: 753 buildings, average cost: $100,400
- 2001: 577 buildings, average cost: $117,000
- 2000: 461 buildings, average cost: $113,600
- 1999: 431 buildings, average cost: $120,400
- 1998: 370 buildings, average cost: $124,700
- 1997: 361 buildings, average cost: $99,600
| Here: | 2.6% |
| Texas: | 3.5% |

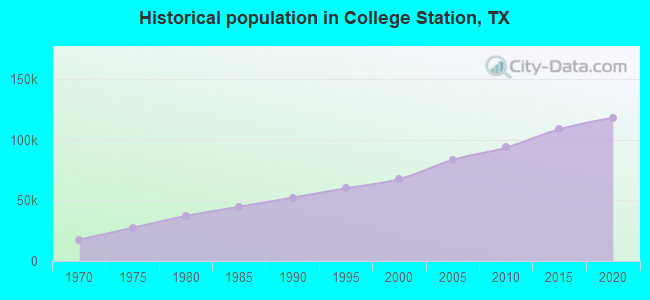
Population change in the 1990s: +14,865 (+28.0%).
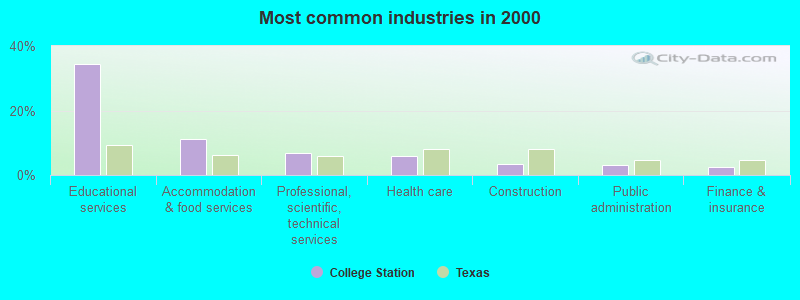
- Educational services (34.4%)
- Accommodation & food services (11.2%)
- Professional, scientific, technical services (7.0%)
- Health care (5.9%)
- Construction (3.5%)
- Public administration (3.1%)
- Finance & insurance (2.5%)
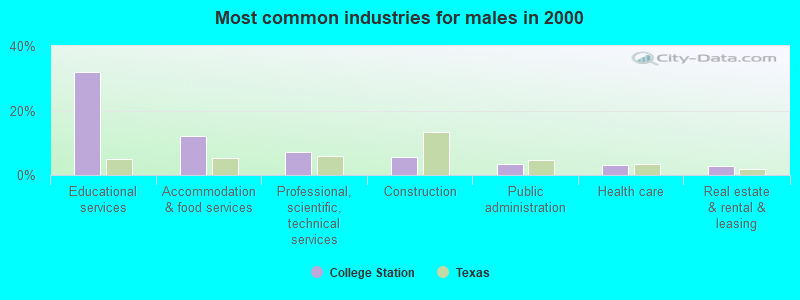
- Educational services (32.1%)
- Accommodation & food services (12.2%)
- Professional, scientific, technical services (7.3%)
- Construction (5.7%)
- Public administration (3.5%)
- Health care (3.2%)
- Real estate & rental & leasing (2.8%)
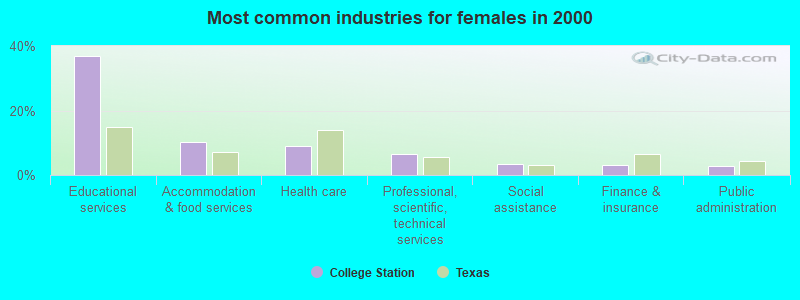
- Educational services (37.1%)
- Accommodation & food services (10.1%)
- Health care (9.1%)
- Professional, scientific, technical services (6.6%)
- Social assistance (3.4%)
- Finance & insurance (3.0%)
- Public administration (2.7%)

- Postsecondary teachers (10.8%)
- Cooks and food preparation workers (7.2%)
- Other management occupations, except farmers and farm managers (6.6%)
- Retail sales workers, except cashiers (3.8%)
- Building and grounds cleaning and maintenance occupations (3.8%)
- Information and record clerks, except customer service representatives (3.5%)
- Computer specialists (3.4%)
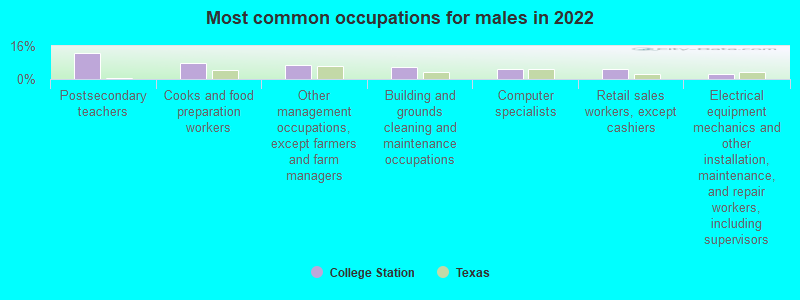
- Postsecondary teachers (12.4%)
- Cooks and food preparation workers (7.9%)
- Other management occupations, except farmers and farm managers (6.9%)
- Building and grounds cleaning and maintenance occupations (5.7%)
- Computer specialists (4.9%)
- Retail sales workers, except cashiers (4.7%)
- Electrical equipment mechanics and other installation, maintenance, and repair workers, including supervisors (2.4%)
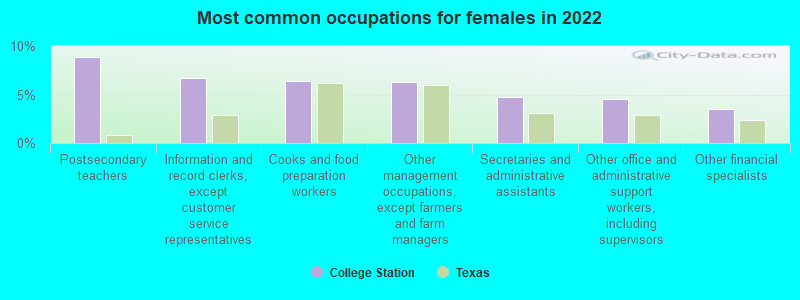
- Postsecondary teachers (8.9%)
- Information and record clerks, except customer service representatives (6.7%)
- Cooks and food preparation workers (6.3%)
- Other management occupations, except farmers and farm managers (6.2%)
- Secretaries and administrative assistants (4.7%)
- Other office and administrative support workers, including supervisors (4.6%)
- Other financial specialists (3.6%)
Average climate in College Station, Texas
Based on data reported by over 4,000 weather stations


|
|


(lower is better)
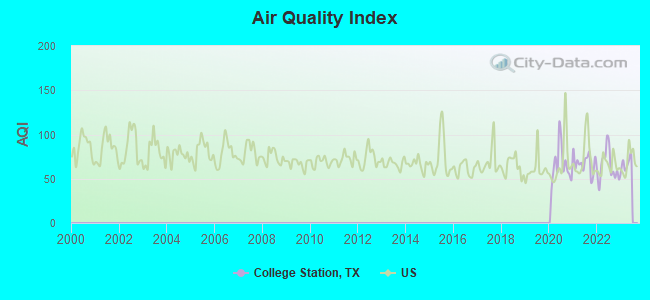
Air Quality Index (AQI) level in 2022 was 63.9. This is about average.
| City: | 63.9 |
| U.S.: | 72.6 |
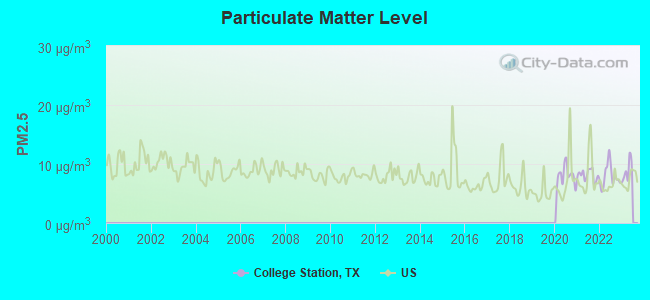
Particulate Matter (PM2.5) [µg/m3] level in 2022 was 7.93. This is about average. Closest monitor was 3.4 miles away from the city center.
| City: | 7.93 |
| U.S.: | 8.11 |
Tornado activity:
College Station-area historical tornado activity is near Texas state average. It is 29% greater than the overall U.S. average.
On 4/5/1956, a category F3 (max. wind speeds 158-206 mph) tornado 5.8 miles away from the College Station city center caused between $50,000 and $500,000 in damages.
On 3/10/2000, a category F3 tornado 14.1 miles away from the city center injured 2 people and caused $1 million in damages.
Earthquake activity:
College Station-area historical earthquake activity is significantly above Texas state average. It is 21% smaller than the overall U.S. average.On 5/17/2012 at 08:12:00, a magnitude 4.8 (4.8 MW, Depth: 3.1 mi, Class: Light, Intensity: IV - V) earthquake occurred 147.0 miles away from the city center
On 10/20/2011 at 12:24:41, a magnitude 4.8 (4.8 MW, Depth: 3.1 mi) earthquake occurred 160.2 miles away from the city center
On 6/16/1978 at 11:46:54, a magnitude 5.3 (4.4 MB, 4.6 UK, 5.3 ML, Class: Moderate, Intensity: VI - VII) earthquake occurred 310.9 miles away from College Station center
On 9/2/2013 at 23:51:15, a magnitude 4.3 (4.3 MW, Depth: 2.9 mi) earthquake occurred 143.6 miles away from College Station center
On 9/2/2013 at 21:52:38, a magnitude 4.2 (4.2 MW, Depth: 3.0 mi) earthquake occurred 141.7 miles away from the city center
On 4/9/1993 at 12:29:19, a magnitude 4.3 (4.1 MB, 4.3 LG, Depth: 3.1 mi) earthquake occurred 164.8 miles away from the city center
Magnitude types: regional Lg-wave magnitude (LG), body-wave magnitude (MB), local magnitude (ML), moment magnitude (MW)
Natural disasters:
The number of natural disasters in Brazos County (13) is near the US average (15).Major Disasters (Presidential) Declared: 5
Emergencies Declared: 7
Causes of natural disasters: Hurricanes: 6, Fires: 3, Storms: 3, Floods: 2, Other: 1 (Note: some incidents may be assigned to more than one category).

Main business address for: OI CORP (LABORATORY ANALYTICAL INSTRUMENTS).
Hospitals in College Station:
- COLLEGE STATION MEDICAL CENTER (Proprietary, provides emergency services, 1604 ROCK PRAIRIE ROAD)
- HCA GREENLEAF HOSPITAL (200 GREENS PRAIRIE ROAD)
- SOUTHERN CARE COLLEGE STATION (3206 LONGMIRE DRIVE SUITE # C)
- ST JOSEPH MENTAL HEALTH SERVICES (4201 TEXAS AVE S)
Nursing Homes in College Station:
- BRAZOS VALLEY GERIATRIC CENTER (1115 ANDERSON)
- FORTRESS HEALTH AND REHAB OF ROCK PRAIRIE LLC (1105 ROCK PRAIRIE RD)
- MAGNIFIED HEALTH AND REHAB OF ANDERSON LLC (1115 ANDERSON)
- SOUTHWOOD (1105 ROCK PRAIRIE ROAD)
Dialysis Facilities in College Station:
- COLLEGE STATION DIALYSIS (701 UNIVERSITY DR E STE 401)
- GAMBRO HEALTHCARE ROCK PRAIRIE ROAD (1605 ROCK PRAIRIE RD)
- LIBERTY DIALYSIS COLLEGE STATION (3314 LONGMIRE DRIVE)
Home Health Centers in College Station:
- A CARING SOLUTION HOME HEALTH CARE SERVICES LLC (2005 OLD MAY COURT)
- BRAZOS VALLEY HOME HEALTH SERVICES (3900 S HWY 6 #109 B)
- TEXAS HOME HEALTH SKILLED SERVICES (1605 ROCK PRAIRIE ROAD SUITE #206)
- THRIVE HOME HEALTH CARE INC (505 UNIVERSITY DR EAST SUITE 603)
- TRADITIONS HEALTH CARE (1862 ROCK PRAIRIE RD SUITE 202)
Airports and heliports located in College Station:
- Easterwood Field Airport (CLL) (Runways: 3, Commercial Ops: 125, Air Taxi Ops: 5,848, Itinerant Ops: 19,661, Local Ops: 14,291, Military Ops: 4,551)
- Scott & White Memorial Hospital Heliport (XS73)
- Texas World Speedway Helistop Nr 1 Heliport (0TE8)
- Texas World Speedway Helistop Nr 2 Heliport (0TE9)
Colleges/Universities in College Station:
Other colleges/universities with over 2000 students near College Station:
- Blinn College (about 32 miles; Brenham, TX; Full-time enrollment: 8,959)
- Prairie View A & M University (about 40 miles; Prairie View, TX; FT enrollment: 7,517)
- Sam Houston State University (about 47 miles; Huntsville, TX; FT enrollment: 16,233)
- Lone Star College System (about 57 miles; The Woodlands, TX; FT enrollment: 45,205)
- Universal Technical Institute of Texas Inc. (about 69 miles; Houston, TX; FT enrollment: 3,236)
- Temple College (about 70 miles; Temple, TX; FT enrollment: 3,796)
- University of Mary Hardin-Baylor (about 76 miles; Belton, TX; FT enrollment: 2,885)
Public high schools in College Station:
- A & M CONS H S (Students: 2,730, Location: 1801 HARVEY MITCHELL PKWY S, Grades: 9-12)
- CENTER FOR ALTERNATIVE LEARNING (Students: 71, Location: 105 TIMBER ST, Grades: 9-12)
- COLLEGE STATION H S (Location: 1812 WELSH AVE, Grades: 9-12)
Private high school in College Station:
Biggest public elementary/middle schools in College Station:
- CYPRESS GROVE INT (Students: 833, Location: 900 GRAHAM RD, Grades: 5-6)
- COLLEGE STATION MIDDLE (Students: 794, Location: 900 ROCK PRAIRIE RD, Grades: 7-8)
- PEBBLE CREEK EL (Students: 682, Location: 200 PARKVIEW DR, Grades: PK-4)
- OAKWOOD INT (Students: 674, Location: 106 HOLIK DR, Grades: 5-6)
- CREEK VIEW EL (Students: 665, Location: 1001 EAGLE AVE, Grades: PK-4)
- ROCK PRAIRIE EL (Students: 656, Location: 3400 WELSH AVE, Grades: PK-4)
- A & M CONSOLIDATED MIDDLE (Students: 638, Location: 105 HOLIK DR, Grades: 7-8)
- FOREST RIDGE (Students: 631, Location: 1950 GREENS PRAIRIE RD W, Grades: PK-4)
- COLLEGE HILLS EL (Students: 628, Location: 1101 WILLIAMS ST, Grades: PK-4)
- SOUTH KNOLL EL (Students: 593, Location: 1220 BOSWELL ST, Grades: PK-4)
Private elementary/middle school in College Station:
Points of interest:
Notable locations in College Station: Kyle Field (A), MSC Forsyth Center (B), George Bush Museum at College Station (C), College Station Fire Department Ambulance Station 1 (D), College Station Fire Department Station 2 (E), College Station Fire Department Ambulance Station 4 (F), South Brazos County Fire Department Station 3 (G), College Station Fire Department Ambulance Station 3 (H), College Station Fire Department Ambulance Station 5 (I), Texas A&M University Emergency Medical Services (J), George Bush Library at College Station (K), J Wayne Stark University Center Galleries (L). Display/hide their locations on the map
Main business address in College Station: OI CORP (A). Display/hide its location on the map
Churches in College Station include: Rock Prairie Church (A), Washington Church (B). Display/hide their locations on the map
Cemetery: College Station Cemetery (1). Display/hide its location on the map
Reservoir: Texas A and M University Lake Number 1 (A). Display/hide its location on the map
Creek: Burton Creek (A). Display/hide its location on the map
Parks in College Station include: Lemon Tree Park (1), Hensel Park (2), Southwood Park (3), Raintree Park (4), Oaks Park (5), Thomas Park (6), Hensel Park (7), G Rollie White Coliseum (8), Aggie Soccer Complex (9). Display/hide their locations on the map
Tourist attractions: Post Oak Pets (Aquariums; 1500 Harvey Road) (1), Costa Rican Specialties (Tourism Consultants; 1001 Pershing Drive) (2), Bryan-College Station Convention & Visitors Bureau (715 University Drive East) (3), Action Sports (Tours & Charters; 202 Holleman Dr E) (4). Display/hide their approximate locations on the map
Hotels: Bell Ranch Steakhouse (801 University Drive) (1), A Vineyard Court Designer Suites Hotel (1500 George Bush Drive East) (2), Amerisuites Hotel (1100 University Dr E) (3), Aggieland Kiva Inn (104 Texas Ave) (4), Best Western Inn Chimney Hill (901 East University Drive) (5), Aggieland Knights Inn (104 Texas Ave) (6), 7-F Lodge Bed & Breakfast (16611 Royder Rd) (7). Display/hide their approximate locations on the map
Courts: College Station City - Municipal Court- Prosecutor (2611B Texas South) (1), College Station City - Municipal Court- Tickets (2611B Texas Avenue South) (2). Display/hide their approximate locations on the map
Birthplace of: Larry Fedora - Football player and coach, Tiffany Thornton - Female singer, David Nixon (American football) - Football player, Ray Prewitt - Film actor, Rico Rodriguez (actor) - Actor, Cody Hopkins - College basketball player (Centenary Gentlemen), Gina Gaston - Journalist, Jordan Russell (golfer) - Amateur golfer, Marcus Watkins - College basketball player (Missouri Tigers).
Drinking water stations with addresses in College Station and their reported violations in the past:
WHEELOCK EXPRESS (Population served: 1,000, Groundwater):Past monitoring violations:BENCHLEY OAKS SUBDIVISION (Population served: 360, Groundwater):
- Monitoring, Source Water (GWR) - In DEC-01-2013, Contaminant: E. COLI. Follow-up actions: St Violation/Reminder Notice (MAR-07-2014), St Public Notif requested (MAR-07-2014)
- 2 minor monitoring violations
Past health violations:APACHE HILLS (Population served: 129, Groundwater):Past monitoring violations:
- MCL, Monthly (TCR) - In JUL-2008, Contaminant: Coliform. Follow-up actions: St Compliance achieved (JUL-31-2008), St Public Notif requested (AUG-25-2008), St Violation/Reminder Notice (2 times from AUG-25-2008 to JAN-26-2011)
- Monitoring and Reporting (DBP) - Between JAN-2007 and MAR-2007, Contaminant: Chlorine. Follow-up actions: St Public Notif requested (JUL-19-2007), St Violation/Reminder Notice (JUL-19-2007), St Compliance achieved (JAN-21-2011)
- Monitoring and Reporting (DBP) - Between OCT-2006 and DEC-2006, Contaminant: Chlorine. Follow-up actions: St Public Notif requested (JUL-19-2007), St Violation/Reminder Notice (JUL-19-2007), St Compliance achieved (JAN-21-2011)
- Monitoring and Reporting (DBP) - Between JUL-2006 and SEP-2006, Contaminant: Chlorine. Follow-up actions: St Public Notif requested (JUL-19-2007), St Violation/Reminder Notice (JUL-19-2007), St Compliance achieved (JAN-21-2011)
- Monitoring and Reporting (DBP) - Between APR-2006 and JUN-2006, Contaminant: Chlorine. Follow-up actions: St Public Notif requested (JUL-19-2007), St Violation/Reminder Notice (JUL-19-2007), St Compliance achieved (JAN-21-2011)
- Monitoring and Reporting (DBP) - Between JAN-2006 and MAR-2006, Contaminant: Chlorine. Follow-up actions: St Public Notif requested (JUL-19-2007), St Violation/Reminder Notice (JUL-19-2007), St Compliance achieved (JAN-21-2011)
- 2 minor monitoring violations
- 4 other older monitoring violations
Past health violations:CHAPLINES MOBILE HOME PARK (Address: TRLR 119 , Population served: 60, Groundwater):Past monitoring violations:
- MCL, Monthly (TCR) - In AUG-2011, Contaminant: Coliform. Follow-up actions: St Violation/Reminder Notice (AUG-12-2011), St Public Notif requested (AUG-12-2011)
- Monitoring, Source Water (GWR) - In AUG-01-2011, Contaminant: E. COLI. Follow-up actions: St Violation/Reminder Notice (SEP-22-2011), St Public Notif requested (SEP-22-2011)
- Monitoring and Reporting (DBP) - Between OCT-2008 and DEC-2008, Contaminant: Chlorine. Follow-up actions: St Public Notif requested (MAR-27-2009), St Violation/Reminder Notice (MAR-27-2009), St Compliance achieved (FEB-02-2012)
- One routine major monitoring violation
Past monitoring violations:CAROUSEL MOBILE HOME PARK (Population served: 45, Groundwater):
- Initial Tap Sampling for Pb and Cu - In JUL-01-2014, Contaminant: Lead and Copper Rule
- Initial Tap Sampling for Pb and Cu - In JAN-01-2014, Contaminant: Lead and Copper Rule
- Initial Tap Sampling for Pb and Cu - In JUL-01-2013, Contaminant: Lead and Copper Rule
- Monitoring and Reporting (DBP) - Between JAN-2013 and MAR-2013, Contaminant: Chlorine. Follow-up actions: St Public Notif requested (NOV-13-2013), St Violation/Reminder Notice (NOV-13-2013), St Compliance achieved (JAN-15-2014)
- Initial Tap Sampling for Pb and Cu - In JAN-01-2013, Contaminant: Lead and Copper Rule
- 4 routine major monitoring violations
- 4 minor monitoring violations
- 3 regular monitoring violations
- 27 other older monitoring violations
Past monitoring violations:
- Initial Tap Sampling for Pb and Cu - In JUL-01-2014, Contaminant: Lead and Copper Rule
- Initial Tap Sampling for Pb and Cu - In JAN-01-2014, Contaminant: Lead and Copper Rule
- Initial Tap Sampling for Pb and Cu - In JUL-01-2013, Contaminant: Lead and Copper Rule
- Initial Tap Sampling for Pb and Cu - In JAN-01-2013, Contaminant: Lead and Copper Rule
- Initial Tap Sampling for Pb and Cu - In JAN-01-2012, Contaminant: Lead and Copper Rule
- 13 other older monitoring violations
| This city: | 2.4 people |
| Texas: | 2.8 people |
| This city: | 42.5% |
| Whole state: | 69.9% |
| This city: | 4.4% |
| Whole state: | 6.0% |
Likely homosexual households (counted as self-reported same-sex unmarried-partner households)
- Lesbian couples: 0.2% of all households
- Gay men: 0.2% of all households
People in group quarters in College Station in 2010:
- 10,143 people in college/university student housing
- 201 people in nursing facilities/skilled-nursing facilities
- 3 people in group homes intended for adults
People in group quarters in College Station in 2000:
- 10,402 people in college dormitories (includes college quarters off campus)
- 217 people in nursing homes
- 44 people in other group homes
- 33 people in agriculture workers' dormitories on farms
- 6 people in other noninstitutional group quarters
Banks with most branches in College Station (2011 data):
- Prosperity Bank: Greens Prairie Branch, Rock Prairie, Wellborn Branch, College Station Branch. Info updated 2012/01/05: Bank assets: $9,816.2 mil, Deposits: $8,064.8 mil, headquarters in El Campo, TX, positive income, Mortgage Lending Specialization, 187 total offices, Holding Company: Prosperity Bancshares, Inc.
- First Victoria National Bank: College Station Branch, College Station - Crescent Pointe Br, College Station - Tower Point Branch. Info updated 2006/11/03: Bank assets: $1,911.3 mil, Deposits: $1,700.2 mil, headquarters in Victoria, TX, positive income, Commercial Lending Specialization, 27 total offices, Holding Company: Mow/Rpw Ii, Ltd.
- First National Bank Texas: Aggieland Banking Center - Rc 589 Br, Longmire Banking Center - Rc 361, Traditions Banking Center - Rc 449 B. Info updated 2006/11/03: Bank assets: $944.3 mil, Deposits: $815.9 mil, headquarters in Killeen, TX, positive income, Mortgage Lending Specialization, 250 total offices, Holding Company: First Community Bancshares, Inc.
- Lubbock National Bank: Fitch Branch, Welsh Branch, College Station Office. Info updated 2006/11/03: Bank assets: $738.3 mil, Deposits: $641.9 mil, headquarters in Lubbock, TX, positive income, Commercial Lending Specialization, 12 total offices, Holding Company: Commerce National Financial Services, Inc.
- Wells Fargo Bank, National Association: Northgate Branch, College Station Rock Prairie Branch, College Station Southwest Pkwy Branc. Info updated 2011/04/05: Bank assets: $1,161,490.0 mil, Deposits: $905,653.0 mil, headquarters in Sioux Falls, SD, positive income, 6395 total offices, Holding Company: Wells Fargo & Company
- JPMorgan Chase Bank, National Association: Holleman And Texas Banking Center Br at 2000 Texas Avenue, branch established on 2005/12/15; College Station South Branch at 919 William D Fitch Pkwy, branch established on 2010/12/07. Info updated 2011/11/10: Bank assets: $1,811,678.0 mil, Deposits: $1,190,738.0 mil, headquarters in Columbus, OH, positive income, International Specialization, 5577 total offices, Holding Company: Jpmorgan Chase & Co.
- Brazos Valley Bank, National Association: Messenger Service at 4030 Highway 6 South, branch established on 2004/11/09; at 4030 Highway 6 South, branch established on 2004/07/26. Info updated 2006/11/03: Bank assets: $111.6 mil, Deposits: $98.7 mil, local headquarters, positive income, Commercial Lending Specialization, 3 total offices
- Citibank, National Association: South College Station Branch at 2717 Texas Avenue South, branch established on 1988/02/01; College Station Branch at 711 University Drive, branch established on 1946/07/01. Info updated 2012/01/10: Bank assets: $1,288,658.0 mil, Deposits: $882,541.0 mil, headquarters in Sioux Falls, SD, positive income, International Specialization, 1048 total offices, Holding Company: Citigroup Inc.
- Bank of America, National Association: A&M Branch at 111 University Drive East, branch established on 1963/07/13. Info updated 2009/11/18: Bank assets: $1,451,969.3 mil, Deposits: $1,077,176.8 mil, headquarters in Charlotte, NC, positive income, 5782 total offices, Holding Company: Bank Of America Corporation
- 7 other banks with 7 local branches
For population 15 years and over in College Station:
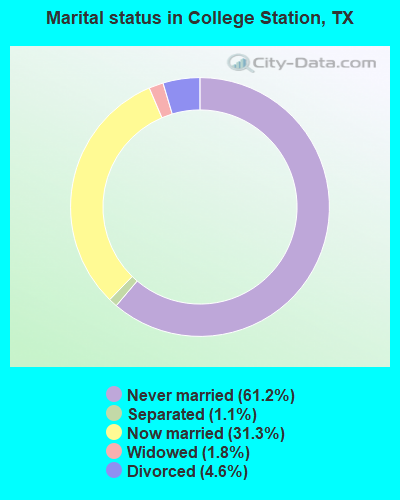
- Never married: 61.2%
- Now married: 31.3%
- Separated: 1.1%
- Widowed: 1.8%
- Divorced: 4.6%
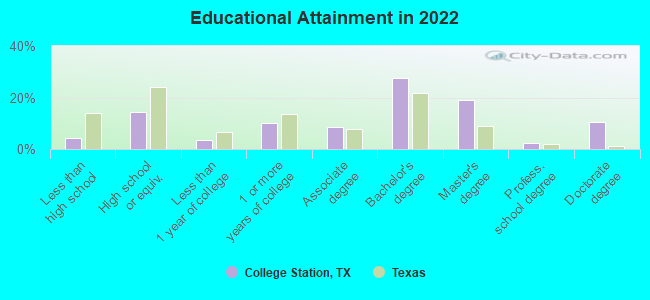
For population 25 years and over in College Station:
- High school or higher: 95.9%
- Bachelor's degree or higher: 59.5%
- Graduate or professional degree: 31.9%
- Unemployed: 12.8%
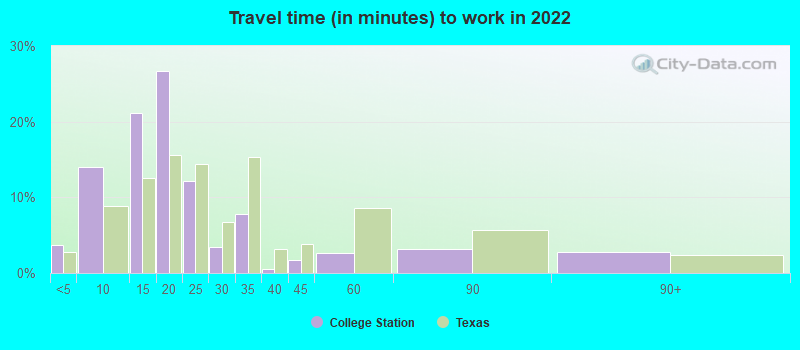
- Mean travel time to work (commute): 15.3 minutes
| Here: | 12.2 |
| Texas average: | 14.0 |
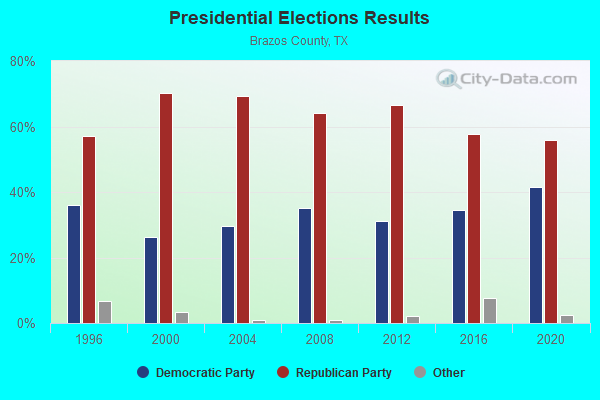
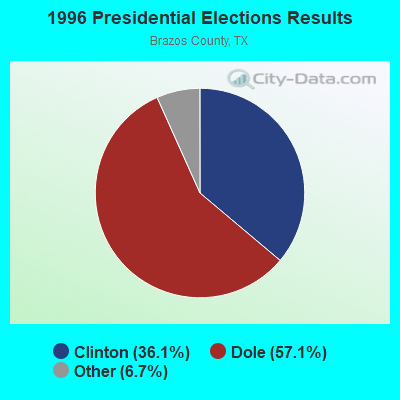
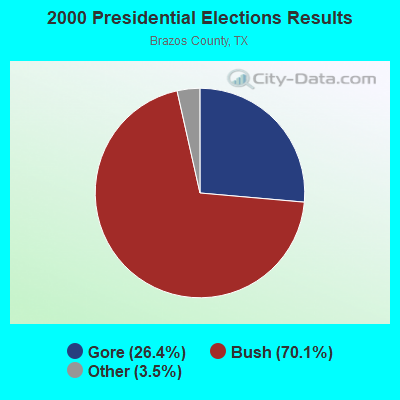
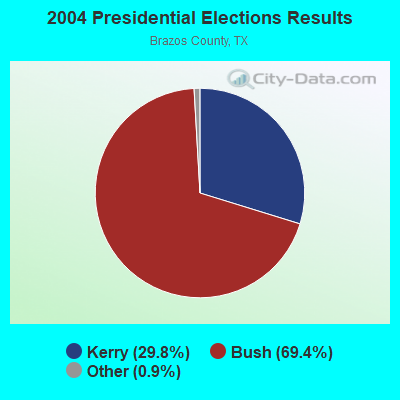
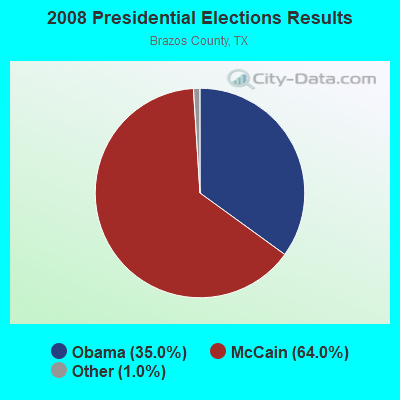

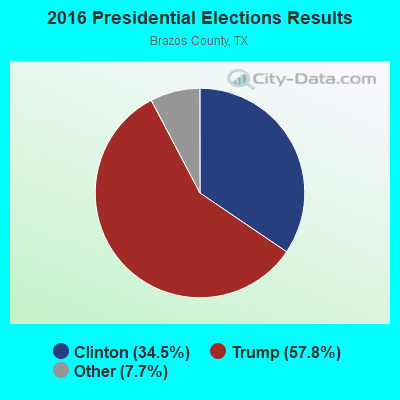
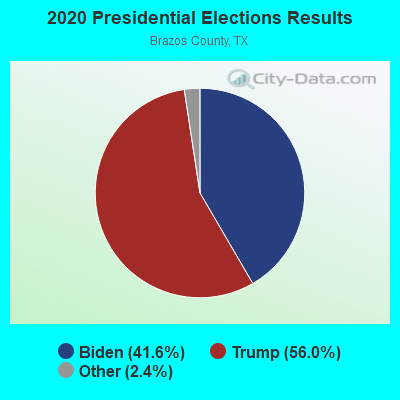
Graphs represent county-level data. Detailed 2008 Election Results
Political contributions by individuals in College Station, TX
Neighborhoods in College Station:
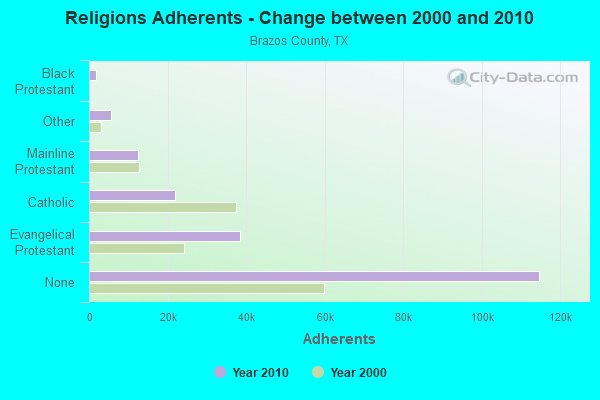
(College Station, Texas Neighborhood Map)Religion statistics for College Station, TX (based on Brazos County data)

| Religion | Adherents | Congregations |
|---|---|---|
| Evangelical Protestant | 38,472 | 98 |
| Catholic | 21,925 | 6 |
| Mainline Protestant | 12,430 | 26 |
| Other | 5,604 | 16 |
| Black Protestant | 1,674 | 7 |
| Orthodox | 92 | 3 |
| None | 114,654 | - |
Food Environment Statistics:
| Brazos County: | 1.23 / 10,000 pop. |
| Texas: | 1.47 / 10,000 pop. |
| Brazos County: | 0.12 / 10,000 pop. |
| Texas: | 0.14 / 10,000 pop. |
| Brazos County: | 1.29 / 10,000 pop. |
| State: | 1.11 / 10,000 pop. |
| Brazos County: | 4.10 / 10,000 pop. |
| Texas: | 3.95 / 10,000 pop. |
| Brazos County: | 6.38 / 10,000 pop. |
| State: | 6.13 / 10,000 pop. |
| This county: | 7.4% |
| State: | 8.9% |
| Brazos County: | 26.4% |
| Texas: | 26.6% |
| This county: | 15.7% |
| State: | 15.7% |
Health and Nutrition:
| College Station: | 50.4% |
| Texas: | 48.6% |
| Here: | 55.0% |
| Texas: | 47.4% |
| College Station: | 26.8 |
| State: | 28.5 |
| Here: | 18.4% |
| Texas: | 20.6% |
| This city: | 10.2% |
| Texas: | 10.3% |
| College Station: | 6.9 |
| State: | 6.8 |
| College Station: | 24.5% |
| State: | 33.1% |
| College Station: | 63.2% |
| Texas: | 56.2% |
| College Station: | 84.6% |
| State: | 80.7% |
More about Health and Nutrition of College Station, TX Residents
| Local government employment and payroll (March 2022) | |||||
| Function | Full-time employees | Monthly full-time payroll | Average yearly full-time wage | Part-time employees | Monthly part-time payroll |
|---|---|---|---|---|---|
| Firefighters | 152 | $1,173,850 | $92,672 | 0 | $0 |
| Police Protection - Officers | 146 | $1,042,125 | $85,654 | 0 | $0 |
| Other Government Administration | 109 | $770,336 | $84,808 | 3 | $3,354 |
| Financial Administration | 68 | $362,676 | $64,002 | 3 | $4,201 |
| Parks and Recreation | 65 | $296,839 | $54,801 | 32 | $16,126 |
| Electric Power | 60 | $417,054 | $83,411 | 0 | $0 |
| Police - Other | 55 | $222,751 | $48,600 | 11 | $4,837 |
| Water Supply | 48 | $212,857 | $53,214 | 0 | $0 |
| Streets and Highways | 46 | $200,554 | $52,318 | 0 | $0 |
| Other and Unallocable | 45 | $208,914 | $55,710 | 1 | $793 |
| Solid Waste Management | 33 | $138,539 | $50,378 | 0 | $0 |
| Sewerage | 27 | $133,016 | $59,118 | 0 | $0 |
| Judicial and Legal | 27 | $167,740 | $74,551 | 2 | $1,412 |
| Housing and Community Development (Local) | 14 | $70,932 | $60,799 | 3 | $2,578 |
| Fire - Other | 7 | $47,632 | $81,655 | 0 | $0 |
| Totals for Government | 902 | $5,465,813 | $72,716 | 55 | $33,301 |
College Station government finances - Expenditure in 2021 (per resident):
- Construction - Parks and Recreation: $3,331,000 ($26.79)
Housing and Community Development: $165,000 ($1.33)
Sewerage: $31,000 ($0.25)
Electric Utilities: $17,000 ($0.14)
- Current Operations - Regular Highways: $72,222,000 ($580.94)
Electric Utilities: $64,417,000 ($518.16)
Local Fire Protection: $15,232,000 ($122.52)
Central Staff Services: $8,494,000 ($68.32)
Solid Waste Management: $7,561,000 ($60.82)
General Public Buildings: $7,222,000 ($58.09)
Parks and Recreation: $7,114,000 ($57.22)
Water Utilities: $5,354,000 ($43.07)
Sewerage: $3,454,000 ($27.78)
Financial Administration: $3,299,000 ($26.54)
Protective Inspection and Regulation - Other: $3,047,000 ($24.51)
Judicial and Legal Services: $2,338,000 ($18.81)
Housing and Community Development: $1,622,000 ($13.05)
Libraries: $1,207,000 ($9.71)
Miscellaneous Commercial Activities - Other: $557,000 ($4.48)
Parking Facilities: $535,000 ($4.30)
- Electric Utilities - Interest on Debt: $2,072,000 ($16.67)
- General - Interest on Debt: $2,530,000 ($20.35)
- Other Capital Outlay - Electric Utilities: $11,082,000 ($89.14)
General - Other: $4,370,000 ($35.15)
Water Utilities: $4,032,000 ($32.43)
Parks and Recreation: $888,000 ($7.14)
Police Protection: $61,000 ($0.49)
Libraries: $60,000 ($0.48)
Miscellaneous Commercial Activities - Other: $20,000 ($0.16)
- Total Salaries and Wages: $87,389,000 ($702.94)
- Water Utilities - Interest on Debt: $2,304,000 ($18.53)
College Station government finances - Revenue in 2021 (per resident):
- Charges - Sewerage: $19,176,000 ($154.25)
Solid Waste Management: $11,078,000 ($89.11)
Other: $7,121,000 ($57.28)
Parking Facilities: $702,000 ($5.65)
Miscellaneous Commercial Activities: $510,000 ($4.10)
Parks and Recreation: $125,000 ($1.01)
- Federal Intergovernmental - Other: $1,919,000 ($15.44)
Water Utilities: $1,843,000 ($14.82)
- Local Intergovernmental - Other: $469,000 ($3.77)
- Miscellaneous - Interest Earnings: $5,097,000 ($41.00)
Special Assessments: $2,865,000 ($23.05)
Fines and Forfeits: $1,971,000 ($15.85)
Sale of Property: $1,521,000 ($12.23)
General Revenue - Other: $269,000 ($2.16)
Rents: $102,000 ($0.82)
Royalties: $1,000 ($0.01)
- Revenue - Electric Utilities: $105,998,000 ($852.63)
Water Utilities: $18,316,000 ($147.33)
- State Intergovernmental - General Local Government Support: $585,000 ($4.71)
Other: $59,000 ($0.47)
- Tax - Property: $51,339,000 ($412.96)
General Sales and Gross Receipts: $29,479,000 ($237.12)
Other Selective Sales: $3,831,000 ($30.82)
Other: $2,631,000 ($21.16)
Other License: $1,857,000 ($14.94)
Alcoholic Beverage License: $76,000 ($0.61)
Occupation and Business License - Other: $47,000 ($0.38)
College Station government finances - Debt in 2021 (per resident):
- Long Term Debt - Beginning Outstanding - Unspecified Public Purpose: $215,193,000 ($1730.97)
Outstanding Unspecified Public Purpose: $203,273,000 ($1635.09)
Outstanding Nonguaranteed - Industrial Revenue: $196,676,000 ($1582.03)
Beginning Outstanding - Public Debt for Private Purpose: $190,202,000 ($1529.95)
Issue, Nonguaranteed - Public Debt for Private Purpose: $28,457,000 ($228.90)
Retired Unspecified Public Purpose: $25,973,000 ($208.92)
Retired Nonguaranteed - Public Debt for Private Purpose: $21,983,000 ($176.83)
Issue, Unspecified Public Purpose: $14,053,000 ($113.04)
College Station government finances - Cash and Securities in 2021 (per resident):
- Other Funds - Cash and Securities: $323,704,000 ($2603.82)
- Sinking Funds - Cash and Securities: $202,952,000 ($1632.51)
| Businesses in College Station, TX | ||||
| Name | Count | Name | Count | |
|---|---|---|---|---|
| AT&T | 3 | Knights Inn | 1 | |
| Abercrombie & Fitch | 1 | Kohl's | 1 | |
| Academy Sports + Outdoors | 1 | Kroger | 2 | |
| Advance Auto Parts | 1 | La Quinta | 1 | |
| Aeropostale | 1 | Lane Bryant | 1 | |
| Albertsons | 1 | Lane Furniture | 1 | |
| American Eagle Outfitters | 1 | LensCrafters | 1 | |
| Applebee's | 1 | Little Caesars Pizza | 1 | |
| Arby's | 1 | Lowe's | 1 | |
| Ashley Furniture | 1 | Macy's | 1 | |
| AutoZone | 1 | Marriott | 2 | |
| Avenue | 1 | McDonald's | 5 | |
| Barnes & Noble | 1 | Men's Wearhouse | 1 | |
| Bath & Body Works | 1 | Motel 6 | 1 | |
| Bed Bath & Beyond | 1 | Motherhood Maternity | 2 | |
| Ben & Jerry's | 1 | New Balance | 2 | |
| Blockbuster | 2 | New York & Co | 1 | |
| Burger King | 1 | Nike | 13 | |
| CVS | 2 | Nissan | 1 | |
| Catherines | 1 | Office Depot | 1 | |
| Charlotte Russe | 1 | OfficeMax | 1 | |
| Chick-Fil-A | 5 | Old Navy | 1 | |
| Chico's | 1 | Olive Garden | 1 | |
| Chipotle | 2 | On The Border | 1 | |
| Chuck E. Cheese's | 1 | Outback | 1 | |
| Church's Chicken | 1 | Outback Steakhouse | 1 | |
| Cinnabon | 2 | Pac Sun | 1 | |
| Cold Stone Creamery | 1 | Panda Express | 1 | |
| Coldwater Creek | 1 | Papa John's Pizza | 2 | |
| Comfort Suites | 2 | Payless | 1 | |
| Cricket Wireless | 3 | Penske | 2 | |
| DHL | 1 | PetSmart | 1 | |
| Days Inn | 1 | Pier 1 Imports | 1 | |
| Dennys | 1 | Pizza Hut | 2 | |
| Discount Tire | 1 | Plato's Closet | 1 | |
| Express | 1 | Popeyes | 1 | |
| FedEx | 17 | Quality | 1 | |
| Finish Line | 1 | Quiznos | 1 | |
| Firestone Complete Auto Care | 1 | RadioShack | 1 | |
| Foot Locker | 1 | Ramada | 1 | |
| Ford | 1 | Red Lobster | 1 | |
| Forever 21 | 1 | SAS Shoes | 1 | |
| GNC | 2 | SONIC Drive-In | 6 | |
| GameStop | 2 | Sam's Club | 1 | |
| Gap | 1 | Shoe Carnival | 1 | |
| Goodwill | 1 | Spencer Gifts | 1 | |
| Gymboree | 1 | Sprint Nextel | 1 | |
| H&R Block | 1 | Starbucks | 5 | |
| Hawthorn | 1 | Subway | 9 | |
| Hilton | 2 | Super 8 | 1 | |
| Hobby Lobby | 1 | T-Mobile | 2 | |
| Holiday Inn | 2 | T.G.I. Driday's | 1 | |
| Hollister Co. | 1 | T.J.Maxx | 1 | |
| Home Depot | 1 | Taco Bell | 2 | |
| Honda | 1 | Talbots | 1 | |
| Hot Topic | 1 | Target | 1 | |
| Howard Johnson | 1 | Toys"R"Us | 2 | |
| Hyatt | 1 | True Value | 1 | |
| IHOP | 1 | U-Haul | 2 | |
| JCPenney | 1 | UPS | 25 | |
| Jamba Juice | 1 | Vans | 2 | |
| Jimmy John's | 2 | Verizon Wireless | 2 | |
| JoS. A. Bank | 1 | Victoria's Secret | 1 | |
| Jones New York | 2 | Walgreens | 2 | |
| Journeys | 1 | Walmart | 1 | |
| Justice | 1 | Wendy's | 2 | |
| KFC | 1 | Wet Seal | 1 | |
Strongest AM radio stations in College Station:
- KZNE (1150 AM; 10 kW; COLLEGE STATION, TX; Owner: BRYAN BROADCASTING LICENSE SUBSIDIARY, INC.)
- WTAW (1620 AM; 10 kW; COLLEGE STATION, TX; Owner: BRYAN BROADCASTING LICENSE SUBSIDIARY, INC.)
- KTAM (1240 AM; 0 kW; BRYAN, TX; Owner: EQUICOM, INC)
- KAGC (1510 AM; daytime; 0 kW; BRYAN, TX; Owner: DIVCON ASSOCIATES, INC.)
- KGOL (1180 AM; 50 kW; HUMBLE, TX; Owner: ENTRAVISION HOLDINGS, LLC)
- KWBC (1550 AM; 5 kW; NAVASOTA, TX)
- KSEV (700 AM; 15 kW; TOMBALL, TX; Owner: LIBERMAN BROADCASTING OF HOUSTON LICENSE CORP.)
- KTRH (740 AM; 50 kW; HOUSTON, TX; Owner: AMFM TEXAS LICENSES LIMITED PARTNERSHIP)
- KJOJ (880 AM; 10 kW; CONROE, TX; Owner: LIBERMAN BROADCASTING OF HOUSTON LICENSE CORP.)
- KILE (1560 AM; 50 kW; BELLAIRE, TX; Owner: THE RAFTT CORPORATION)
- KTKR (760 AM; 50 kW; SAN ANTONIO, TX; Owner: CCB TEXAS LICENSES, L.P.)
- WBAP (820 AM; 50 kW; FORT WORTH, TX; Owner: WBAP-KSCS OPERATING, LTD.)
- KKYX (680 AM; 50 kW; SAN ANTONIO, TX; Owner: CXR HOLDINGS, INC.)
Strongest FM radio stations in College Station:
- KAMU-FM (90.9 FM; COLLEGE STATION, TX; Owner: TEXAS A & M UNIVERSITY)
- KORA-FM (98.3 FM; BRYAN, TX; Owner: EQUICOM, INC)
- KNFX-FM (99.5 FM; BRYAN, TX; Owner: CCB TEXAS LICENSES, L.P.)
- K227AI (93.3 FM; COLLEGE STATION, TX; Owner: KSBJ EDUCATIONAL FOUNDATION)
- K265DH (100.9 FM; BRYAN, TX; Owner: HOUSTON CHRISTIAN BROADCASTERS, INC.)
- KEOS (89.1 FM; COLLEGE STATION, TX; Owner: BRAZOS EDUCATIONAL RADIO)
- KNDE (95.1 FM; COLLEGE STATION, TX; Owner: BRYAN BROADCASTING LICENSE SUBSIDIARY, INC.)
- KMBV (92.5 FM; NAVASOTA, TX; Owner: FORT BEND BROADCASTING COMPANY)
- KKYS (104.7 FM; BRYAN, TX; Owner: CCB TEXAS LICENSES, L.P.)
- KLTR (107.3 FM; CALDWELL, TX; Owner: ROY E. HENDERSON)
- KAGG (96.1 FM; MADISONVILLE, TX; Owner: CCB TEXAS LICENSES, L.P.)
- KVJM (103.1 FM; HEARNE, TX; Owner: EQUAL ACCESS MEDIA, INC.)
- KTTX (106.1 FM; BRENHAM, TX; Owner: TOM S. WHITEHEAD, INC.)
- KXCS (103.9 FM; CAMERON, TX; Owner: EQUICOM, INC)
- KULF (94.1 FM; BRENHAM, TX; Owner: FORT BEND BROADCASTING COMPANY)
- KEZB (105.3 FM; HEMPSTEAD, TX; Owner: FARMERS COMMUNICATIONS)
TV broadcast stations around College Station:
- KAMU-TV (Channel 15; COLLEGE STATION, TX; Owner: TEXAS A & M UNIVERSITY)
- KYLE (Channel 28; BRYAN, TX; Owner: COMCORP OF BRYAN LICENSE CORP.)
- KMAY-LP (Channel 23; BRYAN, TX; Owner: CHANNEL 6, INC.)
- K28AK (Channel 28; COLLEGE STATION, TX; Owner: CLEAR CHANNEL BROADCASTING LICENSES, INC.)
- KRHD-LP (Channel 34; BRYAN, TX; Owner: CENTEX TELEVISION LIMITED PARTNERSHIP)
- KSCM-LP (Channel 12; BRYAN, TX; Owner: R.D. HARRIS)
- K47ED (Channel 47; COLLEGE STATION, TX; Owner: TRINITY BROADCASTING NETWORK)
- KBTX-TV (Channel 3; BRYAN, TX; Owner: KWTX-KBTX LICENSEE CORP.)
- K35DI (Channel 35; SOMERVILLE, TX; Owner: GERALD BENAVIDES)
- National Bridge Inventory (NBI) Statistics
- 137Number of bridges
- 1,614ft / 492mTotal length
- $848,000Total costs
- 1,785,298Total average daily traffic
- 174,818Total average daily truck traffic
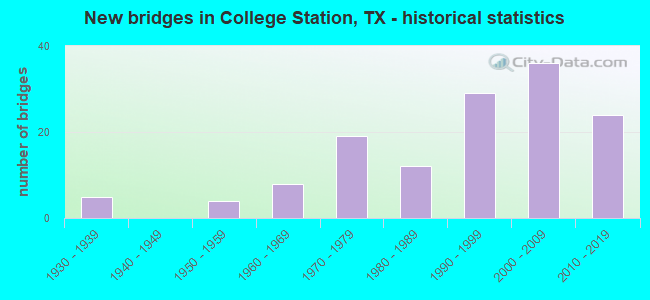
- New bridges - historical statistics
- 51930-1939
- 41950-1959
- 81960-1969
- 191970-1979
- 121980-1989
- 291990-1999
- 362000-2009
- 242010-2019
FCC Registered Antenna Towers: 473 (See the full list of FCC Registered Antenna Towers)
FCC Registered Private Land Mobile Towers: 4 (See the full list of FCC Registered Private Land Mobile Towers in College Station, TX)
FCC Registered Broadcast Land Mobile Towers: 66 (See the full list of FCC Registered Broadcast Land Mobile Towers)
FCC Registered Microwave Towers: 119 (See the full list of FCC Registered Microwave Towers in this town)
FCC Registered Paging Towers: 4 (See the full list of FCC Registered Paging Towers)
FCC Registered Maritime Coast & Aviation Ground Towers: 6 (See the full list of FCC Registered Maritime Coast & Aviation Ground Towers)
FCC Registered Amateur Radio Licenses: 639 (See the full list of FCC Registered Amateur Radio Licenses in College Station)
FAA Registered Aircraft Manufacturers and Dealers: 2 (See the full list of FAA Registered Manufacturers and Dealers in College Station)
FAA Registered Aircraft: 115 (See the full list of FAA Registered Aircraft)
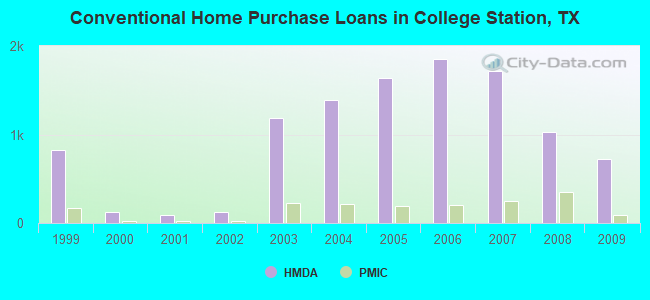
| Home Mortgage Disclosure Act Aggregated Statistics For Year 2009 (Based on 11 full and 3 partial tracts) | ||||||||||||||
| A) FHA, FSA/RHS & VA Home Purchase Loans | B) Conventional Home Purchase Loans | C) Refinancings | D) Home Improvement Loans | E) Loans on Dwellings For 5+ Families | F) Non-occupant Loans on < 5 Family Dwellings (A B C & D) | G) Loans On Manufactured Home Dwelling (A B C & D) | ||||||||
|---|---|---|---|---|---|---|---|---|---|---|---|---|---|---|
| Number | Average Value | Number | Average Value | Number | Average Value | Number | Average Value | Number | Average Value | Number | Average Value | Number | Average Value | |
| LOANS ORIGINATED | 438 | $163,299 | 724 | $153,389 | 834 | $175,931 | 40 | $74,479 | 5 | $3,275,616 | 349 | $128,526 | 8 | $34,100 |
| APPLICATIONS APPROVED, NOT ACCEPTED | 11 | $172,685 | 38 | $157,909 | 51 | $150,265 | 6 | $130,678 | 0 | $0 | 25 | $104,612 | 0 | $0 |
| APPLICATIONS DENIED | 25 | $148,766 | 88 | $115,370 | 207 | $164,057 | 35 | $52,409 | 1 | $7,100,000 | 58 | $130,384 | 10 | $55,557 |
| APPLICATIONS WITHDRAWN | 28 | $138,771 | 57 | $157,001 | 126 | $173,618 | 9 | $65,743 | 2 | $1,983,635 | 42 | $118,889 | 0 | $0 |
| FILES CLOSED FOR INCOMPLETENESS | 5 | $146,900 | 17 | $202,606 | 25 | $153,143 | 3 | $52,000 | 0 | $0 | 12 | $104,893 | 1 | $23,900 |
Detailed mortgage data for all 14 tracts in College Station, TX
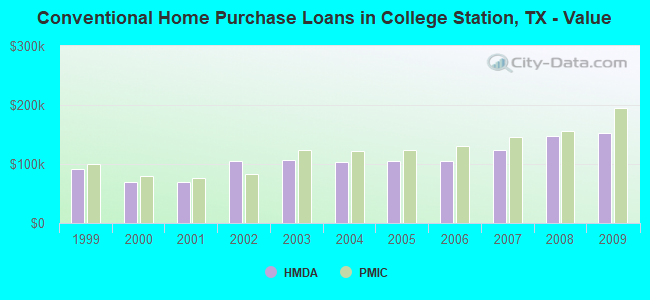
| Private Mortgage Insurance Companies Aggregated Statistics For Year 2009 (Based on 9 full and 3 partial tracts) | ||||||
| A) Conventional Home Purchase Loans | B) Refinancings | C) Non-occupant Loans on < 5 Family Dwellings (A & B) | ||||
|---|---|---|---|---|---|---|
| Number | Average Value | Number | Average Value | Number | Average Value | |
| LOANS ORIGINATED | 96 | $194,499 | 39 | $213,373 | 11 | $143,356 |
| APPLICATIONS APPROVED, NOT ACCEPTED | 13 | $176,032 | 3 | $212,317 | 4 | $111,200 |
| APPLICATIONS DENIED | 14 | $227,933 | 5 | $161,384 | 5 | $180,232 |
| APPLICATIONS WITHDRAWN | 7 | $212,553 | 16 | $226,726 | 2 | $161,045 |
| FILES CLOSED FOR INCOMPLETENESS | 3 | $172,480 | 0 | $0 | 2 | $112,740 |
2002 - 2018 National Fire Incident Reporting System (NFIRS) incidents
- Fire incident types reported to NFIRS in College Station, TX
- 1,82543.3%Outside Fires
- 1,46734.8%Structure Fires
- 70016.6%Mobile Property/Vehicle Fires
- 2275.4%Other
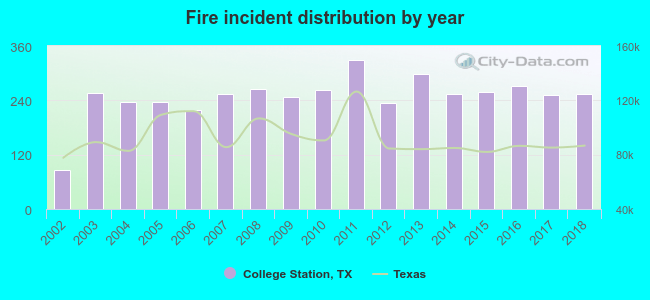 According to the data from the years 2002 - 2018 the average number of fire incidents per year is 248. The highest number of reported fire incidents - 329 took place in 2011, and the least - 86 in 2002. The data has a growing trend.
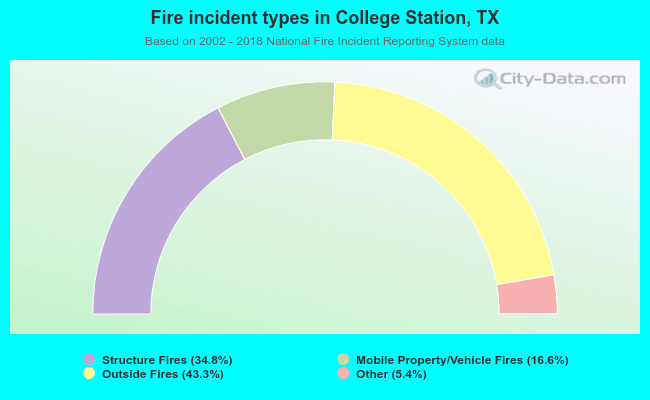 When looking into fire subcategories, the most incidents belonged to: Outside Fires (43.3%), and Structure Fires (34.8%).
Fire-safe hotels and motels in College Station, Texas:
- Comfort Inn College Station, 104 S Texas Ave, College Station, Texas 77840 , Phone: (979) 846-7333, Fax: (979) 846-5479
- Days Inn, 2514 Texas Ave S, College Station, Texas 77840 , Phone: (979) 696-6988, Fax: (979) 693-1174
- Hilton College Station, 801 University Dr E, College Station, Texas 77840 , Phone: (979) 693-7500, Fax: (979) 694-4923
- La Quinta Motor Inn #539 College Station, 607 Texas Ave S, College Station, Texas 77840 , Phone: (979) 696-7777, Fax: (979) 696-0531
- Ramada Inn, 1502 S Texas Ave, College Station, Texas 77840 , Phone: (979) 693-9891, Fax: (979) 696-1334
- Hampton Inn, 320 S Texas Ave, College Station, Texas 77840 , Phone: (979) 846-0184, Fax: (979) 268-5807
- Vineyard Court Executive Suites, 216 Dominik, College Station, Texas 77840 , Phone: (979) 693-1220
- Hawthorn Suites, 1010 University E, College Station, Texas 77840 , Phone: (979) 695-9500, Fax: (979) 695-9501
- 25 other hotels and motels
| Most common first names in College Station, TX among deceased individuals | ||
| Name | Count | Lived (average) |
|---|---|---|
| Mary | 108 | 80.6 years |
| James | 106 | 71.0 years |
| John | 76 | 76.6 years |
| William | 72 | 74.2 years |
| Robert | 69 | 72.9 years |
| Charles | 47 | 71.3 years |
| Helen | 45 | 83.3 years |
| Dorothy | 38 | 76.5 years |
| George | 36 | 76.9 years |
| Richard | 32 | 69.5 years |
| Most common last names in College Station, TX among deceased individuals | ||
| Last name | Count | Lived (average) |
|---|---|---|
| Smith | 71 | 77.8 years |
| Jones | 31 | 79.6 years |
| Williams | 30 | 72.4 years |
| Johnson | 28 | 68.9 years |
| Thompson | 26 | 77.6 years |
| Miller | 23 | 75.0 years |
| Brown | 23 | 80.0 years |
| Wilson | 21 | 76.2 years |
| Anderson | 21 | 75.9 years |
| Taylor | 20 | 72.9 years |
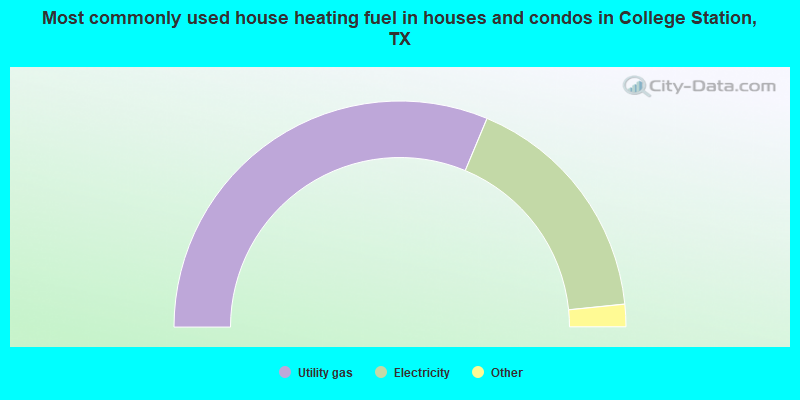
- 62.6%Utility gas
- 34.2%Electricity
- 2.3%Bottled, tank, or LP gas
- 0.5%No fuel used
- 0.3%Wood
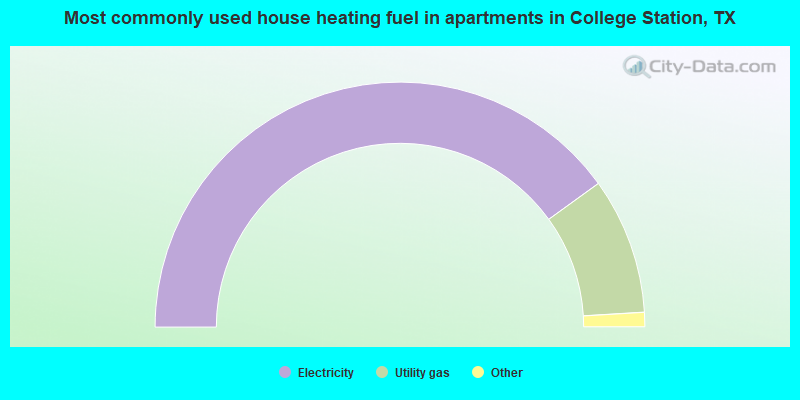
- 80.0%Electricity
- 18.0%Utility gas
- 1.1%Bottled, tank, or LP gas
- 0.8%No fuel used
College Station compared to Texas state average:
- Median age significantly below state average.
- Renting percentage above state average.
- Length of stay since moving in significantly below state average.
- House age below state average.
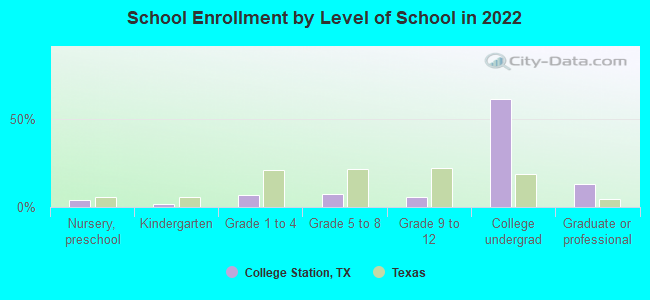
- Number of college students significantly above state average.
- Percentage of population with a bachelor's degree or higher significantly above state average.
College Station on our top lists:
- #2 on the list of "Top 101 cities with the largest household incomes disparities (population 50,000+)"
- #2 on the list of "Top 101 cities with the lowest number of arson incidents per 100,000 residents (population 50,000+)"
- #2 on the list of "Top 100 cities with youngest residents (pop. 50,000+)"
- #8 on the list of "Top 101 cities with largest percentage of males in occupations: life, physical, and social science occupations (population 50,000+)"
- #10 on the list of "Top 101 cities where the highest percentage of females (15+ years) which never married (with at least 10,000 females in this group)"
- #11 on the list of "Top 101 cities with largest percentage of females in industries: educational services (population 50,000+)"
- #11 on the list of "Top 101 cities with the lowest percentage of family households, population 100,000+"
- #12 on the list of "Top 101 cities with largest percentage of females in occupations: sales and related occupations (population 50,000+)"
- #13 on the list of "Top 101 cities with the smallest percentage of likely homosexual households (counted as self-reported same-sex unmarried-partner households) (population 50,000+)"
- #15 on the list of "Top 101 cities where the highest percentage of males (15+ years) which never married (with at least 10,000 males in this group)"
- #16 on the list of "Top 100 cities with highest percentage of college students (pop. 50,000+)"
- #17 on the list of "Top 101 cities with largest percentage of males in industries: educational services (population 50,000+)"
- #18 on the list of "Top 101 cities with the most people having Doctorate degrees (population 50,000+)"
- #23 on the list of "Top 101 cities with largest percentage of females in occupations: farming, fishing, and forestry occupations (population 50,000+)"
- #25 on the list of "Top 100 cities with highest percentage of renters (pop. 50,000+)"
- #25 on the list of "Top 101 cities with largest percentage of males in occupations: education, training, and library occupations (population 50,000+)"
- #26 on the list of "Top 101 cities with largest percentage of females in industries: agriculture, forestry, fishing and hunting (population 50,000+)"
- #28 on the list of "Top 101 cities with largest percentage of females in occupations: education, training, and library occupations (population 50,000+)"
- #28 on the list of "Top 101 larger cities with the highest increase in household income from 2000 (population 50,000+)"
- #28 on the list of "Top 101 cities with largest percentage of workers with very short commute times (9 minutes or less) (population 50,000+)"
- #71 (77840) on the list of "Top 101 zip codes with the smallest percentage of taxpayers using paid preparers for 2012 taxes (pop 5,000+)"
- #16 on the list of "Top 101 counties with the lowest number of deaths per 1000 residents 2007-2013 (pop. 50,000+)"
- #38 on the list of "Top 101 counties with the highest percentage of residents relocating to other counties in 2011 (pop. 50,000+)"
- #39 on the list of "Top 101 counties with the largest decrease in the number of deaths per 1000 residents 2000-2006 to 2007-2013 (pop. 50,000+)"
- #45 on the list of "Top 101 counties with the largest number of people moving out compared to moving in (pop. 50,000+)"
- #49 on the list of "Top 101 counties with the largest number of children under 18 without health insurance coverage in 2000 (pop. 50,000+)"

|
|
Total of 1362 patent applications in 2008-2024.