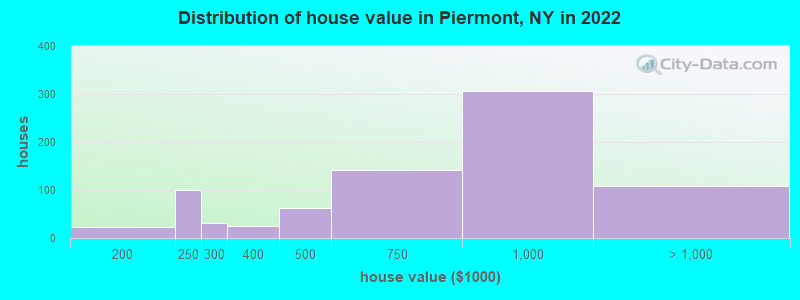
Estimated median house or condo value in 2022: $726,847 (it was $300,600 in 2000)
Piermont:
$726,847
NY:
$400,400
Mean prices in 2022:all housing units: $869,703; detached houses: over $1,000,000; townhouses or other attached units: over $1,000,000; in 2-unit structures: $799,037; in 5-or-more-unit structures: $461,107
Median gross rent in 2022: $1,920.
March 2022 cost of living index in Piermont: 144.0 (very high, U.S. average is 100)
Percentage of residents living in poverty in 2022: 1.1%
(1.0% for White Non-Hispanic residents, 3.4% for Black residents, 3.6% for two or more races residents)
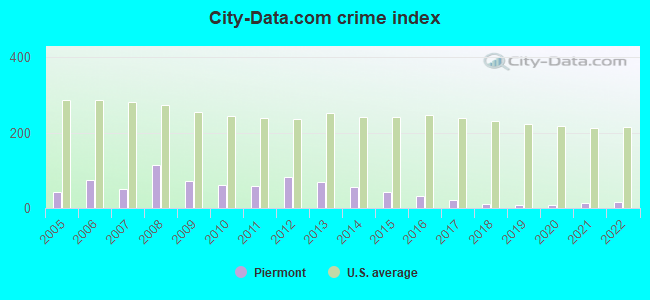
The City-Data.com crime index weighs serious crimes and violent crimes more heavily. Higher means more crime, U.S. average is 246.1. It adjusts for the number of visitors and daily workers commuting into cities.
Latest news from Piermont, NY collected exclusively by city-data.com from local newspapers, TV, and radio stations
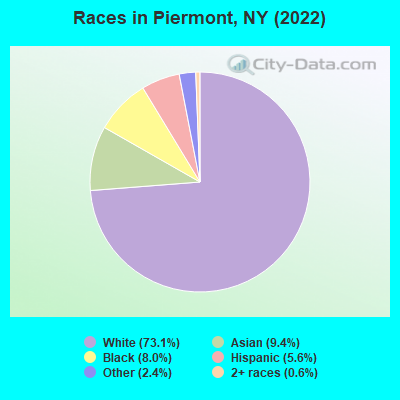
Ancestries: Irish (20.8%), Ghanaian (9.6%), Italian (9.5%), Eastern European (9.3%), German (3.6%), American (3.3%).
Current Local Time: EST time zone
Incorporated in 1850
Land area: 0.67 square miles.
Population density: 3,718 people per square mile (average).
381 residents are foreign born (7.9% Asia, 3.8% Africa, 2.2% Europe).
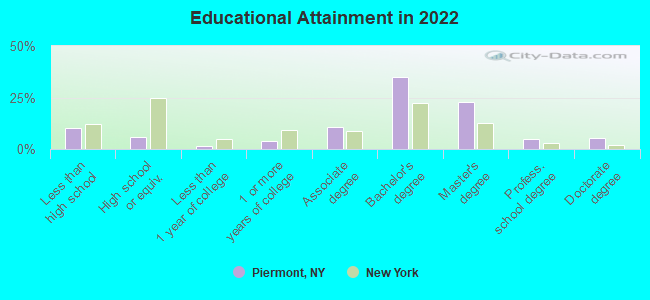
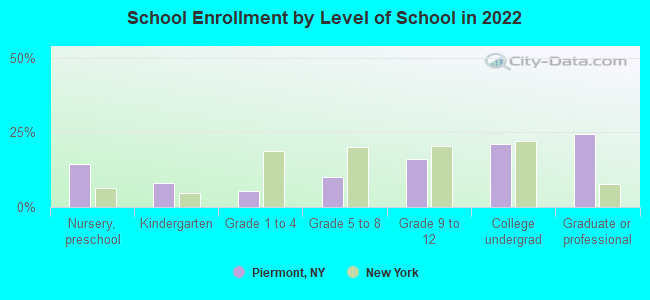
This village:
15.1%
New York:
22.6%
Median real estate property taxes paid for housing units with mortgages in 2022: $10,001 (1.4%) Median real estate property taxes paid for housing units with no mortgage in 2022: $10,001 (1.4%)
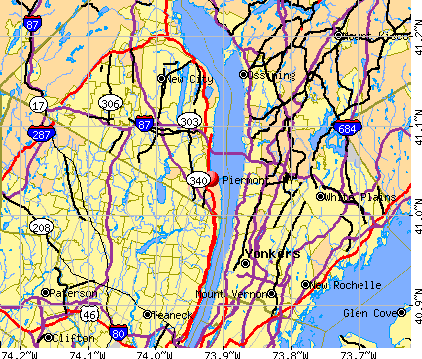
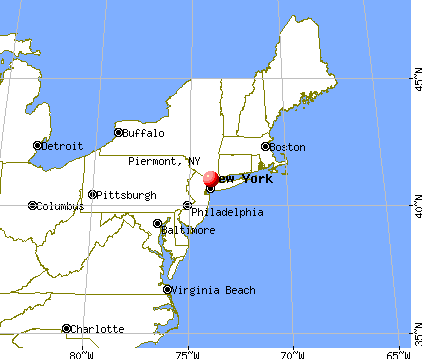
Nearest city with pop. 50,000+: Greenburgh, NY (4.5 miles , pop. 86,764).
Nearest city with pop. 200,000+: Bronx, NY (13.6 miles , pop. 1,332,650).
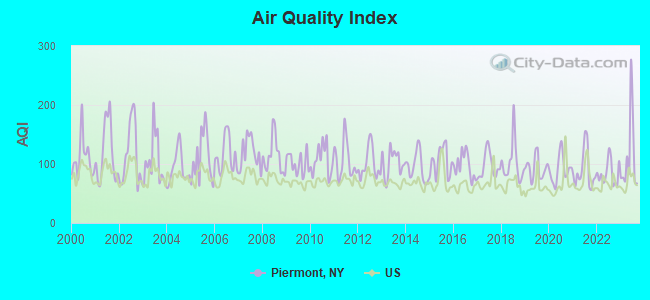
Air Quality Index (AQI) level in 2023 was 112. This is significantly worse than average.
City:
112
U.S.:
73
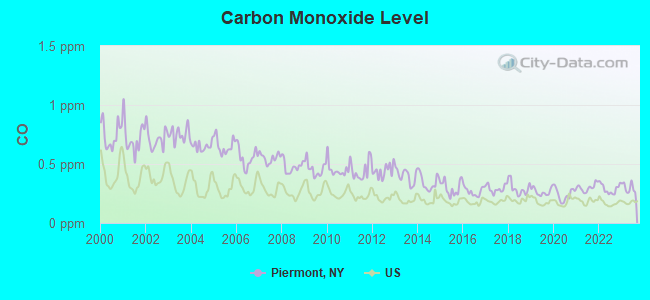
Carbon Monoxide (CO) [ppm] level in 2023 was 0.298. This is about average.Closest monitor was 11.0 miles away from the city center.
City:
0.298
U.S.:
0.251
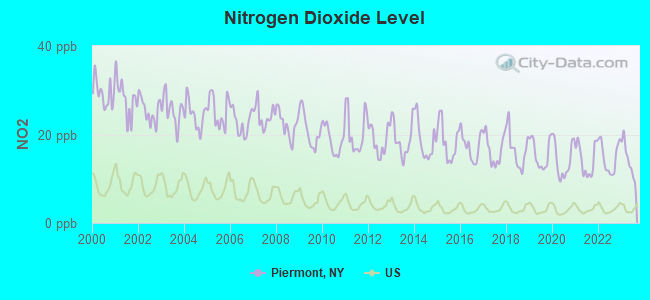
Nitrogen Dioxide (NO2) [ppb] level in 2023 was 14.3. This is significantly worse than average.Closest monitor was 7.6 miles away from the city center.
City:
14.3
U.S.:
5.1
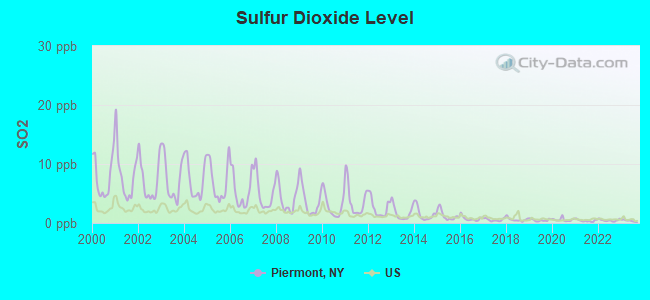
Sulfur Dioxide (SO2) [ppb] level in 2023 was 0.403. This is significantly better than average.Closest monitor was 4.2 miles away from the city center.
City:
0.403
U.S.:
1.515
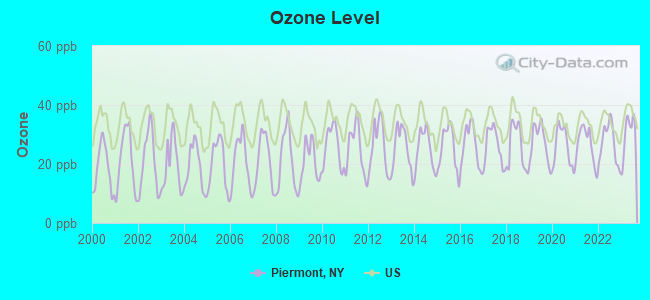
Ozone [ppb] level in 2023 was 30.2. This is about average.Closest monitor was 8.2 miles away from the city center.
City:
30.2
U.S.:
33.3
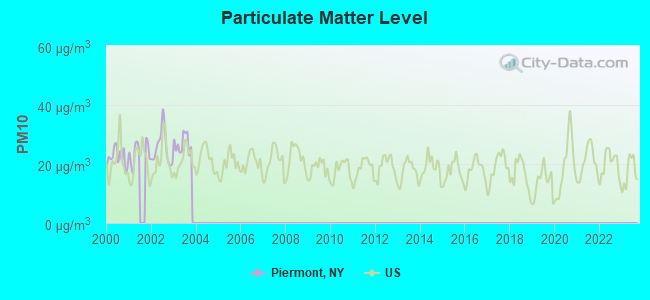
Particulate Matter (PM10) [µg/m3] level in 2003 was 26.9. This is worse than average.Closest monitor was 8.8 miles away from the city center.
City:
26.9
U.S.:
19.2
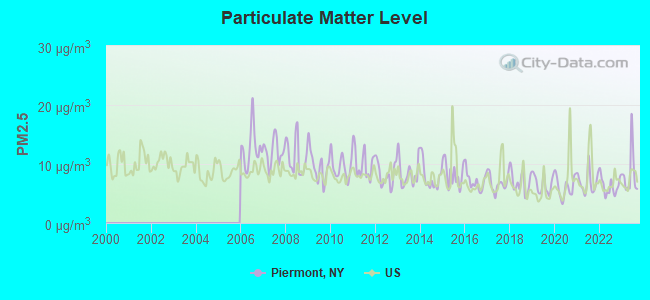
Particulate Matter (PM2.5) [µg/m3] level in 2023 was 8.31. This is about average.Closest monitor was 11.0 miles away from the city center.
City:
8.31
U.S.:
8.11
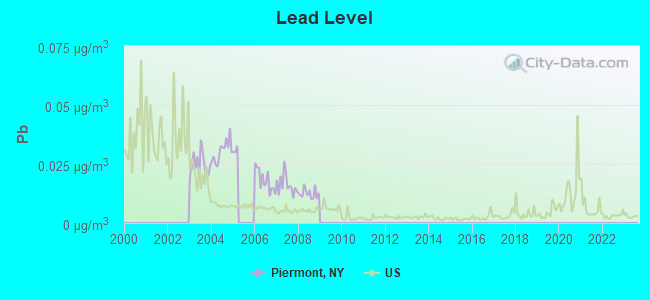
Lead (Pb) [µg/m3] level in 2008 was 0.0125. This is worse than average.Closest monitor was 7.6 miles away from the city center.
City:
0.0125
U.S.:
0.0093
Tornado activity:
Piermont-area historical tornado activity is above New York state average. It is 37% smaller than the overall U.S. average.
On 7/12/2006, a category F2 (max. wind speeds 113-157 mph) tornado 3.3 miles away from the Piermont village center injured 6 peopleand caused $12 million in damages.
On 7/12/2006, a category F2 tornado 3.3 miles away from the village center injured 6 peopleand caused $10 million in damages.
Earthquake activity:
Piermont-area historical earthquake activity is significantly above New York state average. It is 69% smaller than the overall U.S. average.
On 10/7/1983 at 10:18:46, a magnitude 5.3 (5.1 MB, 5.3 LG, 5.1 ML, Class: Moderate, Intensity: VI - VII) earthquake occurred 202.6 miles away from Piermont center On 8/23/2011 at 17:51:04, a magnitude 5.8 (5.8 MW, Depth: 3.7 mi) earthquake occurred 304.7 miles away from Piermont center On 4/20/2002 at 10:50:47, a magnitude 5.3 (5.3 ML, Depth: 3.0 mi) earthquake occurred 240.4 miles away from the city center On 4/20/2002 at 10:50:47, a magnitude 5.2 (5.2 MB, 4.2 MS, 5.2 MW, 5.0 MW) earthquake occurred 238.6 miles away from the city center On 1/16/1994 at 01:49:16, a magnitude 4.6 (4.6 MB, 4.6 LG, Depth: 3.1 mi, Class: Light, Intensity: IV - V) earthquake occurred 121.5 miles away from the city center On 1/19/1982 at 00:14:42, a magnitude 4.7 (4.5 MB, 4.7 MD, 4.5 LG) earthquake occurred 207.4 miles away from the city center Magnitude types: regional Lg-wave magnitude (LG), body-wave magnitude (MB), duration magnitude (MD), local magnitude (ML), surface-wave magnitude (MS), moment magnitude (MW)
Natural disasters:
The number of natural disasters in Rockland County (23) is greater than the US average (15). Major Disasters (Presidential) Declared: 14 Emergencies Declared: 8
Causes of natural disasters: Hurricanes: 7, Floods: 6, Storms: 6, Blizzards: 2, Heavy Rains: 2, Tropical Storms: 2, Landslide: 1, Power Outage: 1, Snowstorm: 1, Water Shortage: 1, Other: 3 (Note: some incidents may be assigned to more than one category).
Hospitals and medical centers near Piermont:
NYACK HOSP HOME CARE CHHA (Home Health Center, about 2 miles away; ORANGEBURG, NY)
JEWISH HOME AT ROCKLEIGH (Nursing Home, about 3 miles away; ROCKLEIGH, NJ)
ST. DOMINIC'S HOME (Hospital, about 3 miles away; BLAUVELT, NY)
ROCKLAND PSYCH CTR (Hospital, about 3 miles away; ORANGEBURG, NY)
ST CABRINI NURSING HOME (Nursing Home, about 4 miles away; DOBBS FERRY, NY)
COMMUNITY HOSPITAL AT DOBBS FERRY (Hospital, about 4 miles away; DOBBS FERRY, NY)
QUEENS DIALYSIS CENTER (Dialysis Facility, about 4 miles away; JAMAICA, NY)
Amtrak stations near Piermont:
8 miles: YONKERS (FOOT OF DOCK ST. & WELLS AVE.) . Services: fully wheelchair accessible, enclosed waiting area, public restrooms, public payphones, snack bar, paid short-term parking, paid long-term parking, call for car rental service, taxi stand, public transit connection.
11 miles: CROTON-HARMON (CROTON-ON-HUDSON, CROTON POINT AVE.) . Services: partially wheelchair accessible, enclosed waiting area, public restrooms, public payphones, snack bar, paid short-term parking, paid long-term parking, call for car rental service, call for taxi service, public transit connection.
12 miles: NEW ROCHELLE (DEPOT PLAZA NORTH) . Services: enclosed waiting area, public restrooms, public payphones, paid short-term parking, paid long-term parking, call for car rental service, taxi stand, public transit connection.
Operable nuclear power plants near Piermont:
16 miles: Indian Point 2 and 3 in Buchanan, NY.
Colleges/universities with over 2000 students nearest to Piermont:
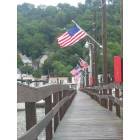
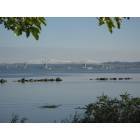
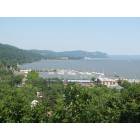
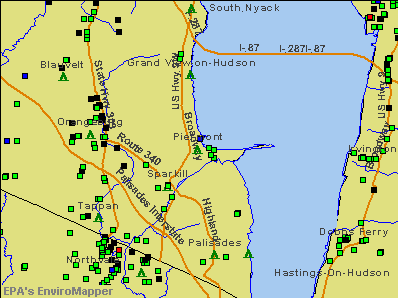
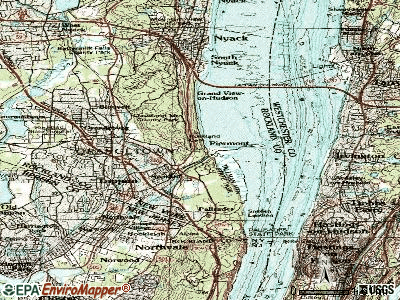
Notable locations in Piermont: Piermont Pier (A), Dennis P. McHugh Piermont Public Library (B), Empire Hose Company 1 (C). Display/hide their locations on the map
Churches in Piermont include: Reformed Church of Piermont (A), Saint Johns Catholic Church (B), Macedonia Baptist Church (C). Display/hide their locations on the map
Birthplace of: Albert Journeay - Football player.
Rockland County has a predicted average indoor radon screening level less than 2 pCi/L (pico curies per liter) - Low Potential
Average household size:
This village:
2.0 people
New York:
2.6 people
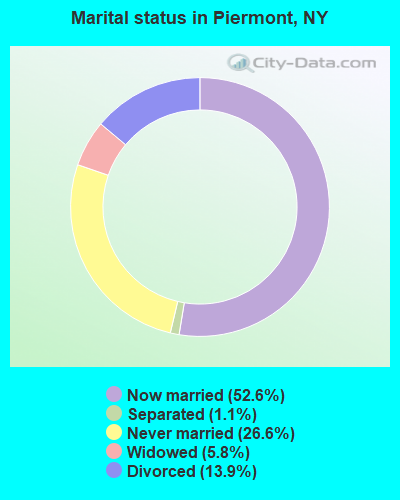
Percentage of family households:
This village:
52.6%
Whole state:
63.5%
Percentage of households with unmarried partners:
This village:
7.8%
Whole state:
6.8%
Likely homosexual households (counted as self-reported same-sex unmarried-partner households)
Lesbian couples: 0.9% of all households
Gay men: 0.6% of all households
3 people in other noninstitutional facilities in 2010
Banks with branches in Piermont (2011 data):
Manufacturers and Traders Trust Company: Piermont Branch at 527 Piermont Avenue, branch established on 1964/01/27. Info updated 2011/08/08: Bank assets: $76,887.1 mil, Deposits: $60,064.2 mil, headquarters in Buffalo, NY, positive income, Commercial Lending Specialization, 808 total offices, Holding Company: M&T Bank Corporation
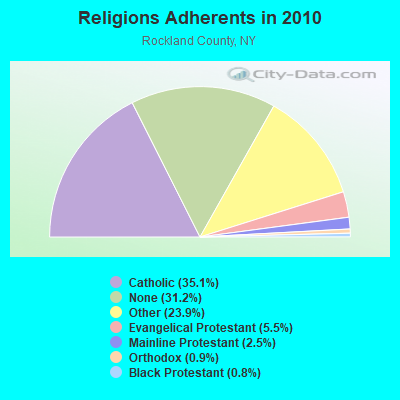
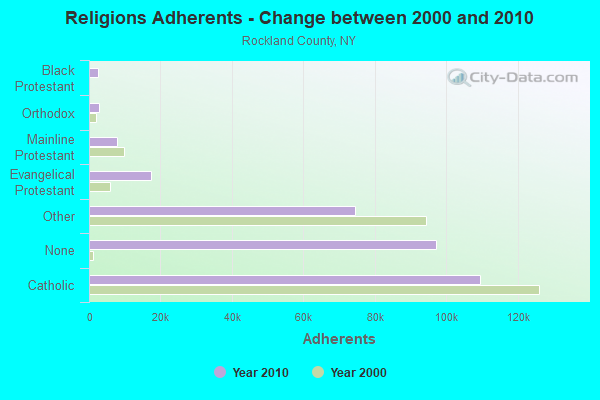
Religion statistics for Piermont, NY (based on Rockland County data)
Religion
Adherents
Congregations
Catholic
109,386
21
Other
74,477
136
Evangelical Protestant
17,221
84
Mainline Protestant
7,852
48
Orthodox
2,909
14
Black Protestant
2,640
8
None
97,202
-
Source: Clifford Grammich, Kirk Hadaway, Richard Houseal, Dale E.Jones, Alexei Krindatch, Richie Stanley and Richard H.Taylor. 2012. 2010 U.S.Religion Census: Religious Congregations & Membership Study. Association of Statisticians of American Religious Bodies. Jones, Dale E., et al. 2002. Congregations and Membership in the United States 2000. Nashville, TN: Glenmary Research Center. Graphs represent county-level data
Piermont Ave Fire House (Lat: 41.044528 Lon: -73.917639), Call Sign: KNGV609, Assigned Frequencies: 46.0800 MHz, 46.1800 MHz, Grant Date: 05/01/2003, Expiration Date: 06/15/2013, Cancellation Date: 08/17/2013, Registrant: Business Radio Licensing, 26941 Cabot Road #134, Laguna Hills, CA 92653, Phone: (949) 348-8510
FCC Registered Amateur Radio Licenses:
7
Call Sign: N2DML, Licensee ID: L01207001, Grant Date: 10/27/2006, Expiration Date: 01/22/2017, Cancellation Date: 02/12/2019, Certifier: Robert M Cone, Registrant: Robert M Cone, 44 Franklin St, Piermont, NY 10968
Call Sign: N2RTE, Licensee ID: L00542357, Grant Date: 05/31/2012, Expiration Date: 07/08/2022, Certifier: Mario Pellegrino, Registrant: Mario Pellegrino, 87 Ash St, Piermont, NY 10968-1041
Call Sign: N2SWL, Licensee ID: L00542939, Grant Date: 03/06/2024, Expiration Date: 03/06/2034, Registrant: Joseph G Gottlieb, 302 Giar St, Piermont, NY 10968
Call Sign: KD2HAQ, Licensee ID: L00419869, Grant Date: 08/13/2014, Expiration Date: 08/13/2024, Certifier: Joseph L Palkozic, Registrant: Joseph L Palkozic, 66 Ash Street, Piermont, NY 10968
Call Sign: KD2RGS, Licensee ID: L02239045, Grant Date: 01/31/2019, Expiration Date: 01/31/2029, Certifier: Thomas Brady Nelson, Registrant: Thomas Brady Nelson, 730 Piermont Ave, Piermont, NY 10968
Call Sign: KD2ZQV, Licensee ID: L02568206, Grant Date: 06/10/2022, Expiration Date: 06/10/2032, Certifier: Richard T Lee, Registrant: Richard T Lee, 154 Hudson Terrace, Piermont, NY 10968
FAA Registered Aircraft:
1
Aircraft: LIBERTY AEROSPACE INCORPORATED LIBERTY XL-2 (Category: Land, Seats: 2, Weight: Up to 12,499 Pounds), Engine: CONT MOTOR IO-240-B (125 HP) (Reciprocating) N-Number: 57NY, N57NY, N-57NY, Serial Number: 0030, Year manufactured: 2006, Airworthiness Date: 09/05/2006, Certificate Issue Date: 11/09/2006 Registrant (Individual): Daniel Spitzer, 505 Gair St, Piermont, NY 10968
Home Mortgage Disclosure Act Aggregated Statistics For Year 2009 (Based on 1 full tract)
A) FHA, FSA/RHS & VA Home Purchase Loans
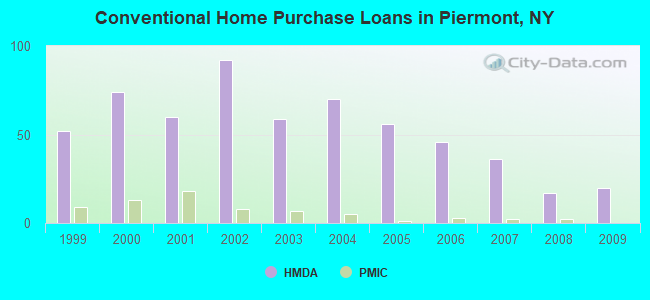
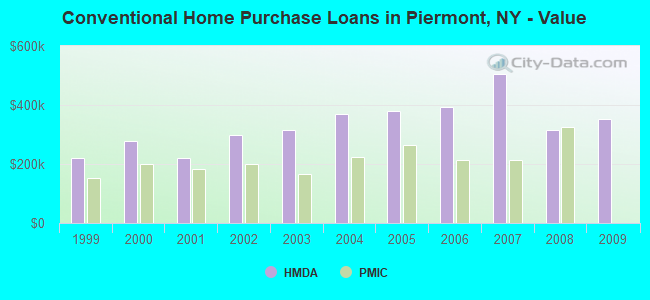
B) Conventional Home Purchase Loans
C) Refinancings
D) Home Improvement Loans
F) Non-occupant Loans on < 5 Family Dwellings (A B C & D)
Number
Average Value
Number
Average Value
Number
Average Value
Number
Average Value
Number
Average Value
LOANS ORIGINATED
4
$404,750
20
$353,350
44
$320,795
1
$10,000
1
$189,000
APPLICATIONS APPROVED, NOT ACCEPTED
0
$0
3
$352,333
10
$372,500
0
$0
1
$360,000
APPLICATIONS DENIED
1
$378,000
3
$255,000
23
$333,478
3
$21,667
1
$417,000
APPLICATIONS WITHDRAWN
0
$0
6
$299,167
15
$357,000
0
$0
2
$313,500
FILES CLOSED FOR INCOMPLETENESS
0
$0
0
$0
5
$422,400
1
$50,000
0
$0
Aggregated Statistics For Year 2008 (Based on 1 full tract)
A) FHA, FSA/RHS & VA Home Purchase Loans
B) Conventional Home Purchase Loans
C) Refinancings
D) Home Improvement Loans
F) Non-occupant Loans on < 5 Family Dwellings (A B C & D)
Number
Average Value
Number
Average Value
Number
Average Value
Number
Average Value
Number
Average Value
LOANS ORIGINATED
0
$0
17
$314,824
14
$510,071
2
$267,500
0
$0
APPLICATIONS APPROVED, NOT ACCEPTED
1
$416,000
3
$309,667
8
$346,500
0
$0
0
$0
APPLICATIONS DENIED
1
$252,000
4
$267,250
17
$456,647
2
$17,500
1
$623,000
APPLICATIONS WITHDRAWN
0
$0
0
$0
8
$320,375
3
$132,667
2
$227,000
FILES CLOSED FOR INCOMPLETENESS
0
$0
0
$0
6
$513,333
0
$0
0
$0
Aggregated Statistics For Year 2007 (Based on 1 full tract)
B) Conventional Home Purchase Loans
C) Refinancings
D) Home Improvement Loans
F) Non-occupant Loans on < 5 Family Dwellings (A B C & D)
Number
Average Value
Number
Average Value
Number
Average Value
Number
Average Value
LOANS ORIGINATED
36
$505,833
33
$414,273
6
$334,500
6
$444,667
APPLICATIONS APPROVED, NOT ACCEPTED
7
$393,429
16
$381,750
2
$59,000
4
$381,750
APPLICATIONS DENIED
11
$433,364
32
$410,375
3
$48,000
8
$362,625
APPLICATIONS WITHDRAWN
3
$272,000
7
$528,429
1
$240,000
2
$469,000
FILES CLOSED FOR INCOMPLETENESS
2
$576,000
9
$538,889
0
$0
1
$555,000
Aggregated Statistics For Year 2006 (Based on 1 full tract)
B) Conventional Home Purchase Loans
C) Refinancings
D) Home Improvement Loans
E) Loans on Dwellings For 5+ Families
F) Non-occupant Loans on < 5 Family Dwellings (A B C & D)
G) Loans On Manufactured Home Dwelling (A B C & D)
Number
Average Value
Number
Average Value
Number
Average Value
Number
Average Value
Number
Average Value
Number
Average Value
LOANS ORIGINATED
46
$393,196
30
$368,433
5
$160,000
1
$150,000
5
$697,200
0
$0
APPLICATIONS APPROVED, NOT ACCEPTED
7
$322,857
5
$418,800
1
$564,000
0
$0
2
$532,000
0
$0
APPLICATIONS DENIED
5
$423,800
27
$432,074
3
$421,667
0
$0
4
$598,250
0
$0
APPLICATIONS WITHDRAWN
4
$332,250
14
$470,500
5
$283,200
0
$0
2
$663,000
1
$518,000
FILES CLOSED FOR INCOMPLETENESS
0
$0
2
$200,000
0
$0
0
$0
0
$0
0
$0
Aggregated Statistics For Year 2005 (Based on 1 full tract)
B) Conventional Home Purchase Loans
C) Refinancings
D) Home Improvement Loans
F) Non-occupant Loans on < 5 Family Dwellings (A B C & D)
Number
Average Value
Number
Average Value
Number
Average Value
Number
Average Value
LOANS ORIGINATED
56
$380,286
50
$392,380
8
$106,000
14
$368,643
APPLICATIONS APPROVED, NOT ACCEPTED
8
$294,875
14
$424,143
1
$400,000
1
$288,000
APPLICATIONS DENIED
10
$406,800
23
$422,435
7
$183,857
5
$338,600
APPLICATIONS WITHDRAWN
10
$276,600
33
$335,758
2
$692,500
2
$211,000
FILES CLOSED FOR INCOMPLETENESS
2
$371,500
10
$415,600
1
$20,000
1
$280,000
Aggregated Statistics For Year 2004 (Based on 1 full tract)
B) Conventional Home Purchase Loans
C) Refinancings
D) Home Improvement Loans
E) Loans on Dwellings For 5+ Families
F) Non-occupant Loans on < 5 Family Dwellings (A B C & D)
Number
Average Value
Number
Average Value
Number
Average Value
Number
Average Value
Number
Average Value
LOANS ORIGINATED
70
$370,700
47
$316,447
2
$222,500
0
$0
9
$307,556
APPLICATIONS APPROVED, NOT ACCEPTED
9
$538,667
13
$314,923
1
$330,000
1
$5,250,000
1
$468,000
APPLICATIONS DENIED
7
$429,286
22
$318,045
5
$60,400
0
$0
8
$176,750
APPLICATIONS WITHDRAWN
6
$681,667
22
$253,182
2
$135,000
0
$0
2
$720,000
FILES CLOSED FOR INCOMPLETENESS
4
$393,500
6
$270,167
0
$0
0
$0
0
$0
Aggregated Statistics For Year 2003 (Based on 1 full tract)
B) Conventional Home Purchase Loans
C) Refinancings
D) Home Improvement Loans
E) Loans on Dwellings For 5+ Families
F) Non-occupant Loans on < 5 Family Dwellings (A B C & D)
Number
Average Value
Number
Average Value
Number
Average Value
Number
Average Value
Number
Average Value
LOANS ORIGINATED
59
$313,797
143
$255,888
2
$133,500
1
$1,750,000
6
$206,167
APPLICATIONS APPROVED, NOT ACCEPTED
7
$299,571
24
$231,208
3
$20,667
0
$0
4
$202,250
APPLICATIONS DENIED
8
$420,500
46
$294,630
2
$125,000
0
$0
3
$203,333
APPLICATIONS WITHDRAWN
4
$261,250
30
$208,133
2
$325,000
0
$0
2
$371,000
FILES CLOSED FOR INCOMPLETENESS
3
$257,333
6
$284,000
0
$0
0
$0
1
$105,000
Aggregated Statistics For Year 2002 (Based on 1 full tract)
A) FHA, FSA/RHS & VA Home Purchase Loans
B) Conventional Home Purchase Loans
C) Refinancings
D) Home Improvement Loans
E) Loans on Dwellings For 5+ Families
F) Non-occupant Loans on < 5 Family Dwellings (A B C & D)
Number
Average Value
Number
Average Value
Number
Average Value
Number
Average Value
Number
Average Value
Number
Average Value
LOANS ORIGINATED
2
$207,500
92
$297,217
108
$246,204
6
$106,667
0
$0
7
$157,429
APPLICATIONS APPROVED, NOT ACCEPTED
0
$0
14
$305,714
20
$214,600
1
$18,000
0
$0
2
$236,500
APPLICATIONS DENIED
0
$0
17
$269,059
25
$282,280
2
$23,500
1
$525,000
2
$175,000
APPLICATIONS WITHDRAWN
1
$256,000
10
$224,200
32
$232,562
5
$246,000
0
$0
2
$350,000
FILES CLOSED FOR INCOMPLETENESS
0
$0
1
$206,000
8
$195,125
0
$0
0
$0
0
$0
Aggregated Statistics For Year 2001 (Based on 1 full tract)
A) FHA, FSA/RHS & VA Home Purchase Loans
B) Conventional Home Purchase Loans
C) Refinancings
D) Home Improvement Loans
F) Non-occupant Loans on < 5 Family Dwellings (A B C & D)
Number
Average Value
Number
Average Value
Number
Average Value
Number
Average Value
Number
Average Value
LOANS ORIGINATED
0
$0
60
$222,017
63
$250,095
8
$79,875
6
$258,167
APPLICATIONS APPROVED, NOT ACCEPTED
1
$39,000
10
$259,400
10
$162,700
2
$87,500
2
$120,500
APPLICATIONS DENIED
0
$0
8
$320,375
22
$194,091
7
$21,571
1
$180,000
APPLICATIONS WITHDRAWN
0
$0
4
$160,250
19
$181,684
2
$60,000
0
$0
FILES CLOSED FOR INCOMPLETENESS
0
$0
3
$164,333
4
$113,500
0
$0
0
$0
Aggregated Statistics For Year 2000 (Based on 1 full tract)
B) Conventional Home Purchase Loans
C) Refinancings
D) Home Improvement Loans
E) Loans on Dwellings For 5+ Families
F) Non-occupant Loans on < 5 Family Dwellings (A B C & D)
Number
Average Value
Number
Average Value
Number
Average Value
Number
Average Value
Number
Average Value
LOANS ORIGINATED
74
$277,149
27
$196,630
11
$52,455
1
$450,000
5
$211,200
APPLICATIONS APPROVED, NOT ACCEPTED
15
$338,267
1
$306,000
5
$29,000
0
$0
0
$0
APPLICATIONS DENIED
12
$237,750
13
$319,077
8
$89,375
0
$0
1
$200,000
APPLICATIONS WITHDRAWN
7
$356,571
9
$130,889
1
$75,000
0
$0
0
$0
FILES CLOSED FOR INCOMPLETENESS
2
$112,000
1
$23,000
0
$0
0
$0
0
$0
Aggregated Statistics For Year 1999 (Based on 1 full tract)
A) FHA, FSA/RHS & VA Home Purchase Loans
B) Conventional Home Purchase Loans
C) Refinancings
D) Home Improvement Loans
E) Loans on Dwellings For 5+ Families
F) Non-occupant Loans on < 5 Family Dwellings (A B C & D)
Detailed PMIC statistics for the following Tracts:0133.00
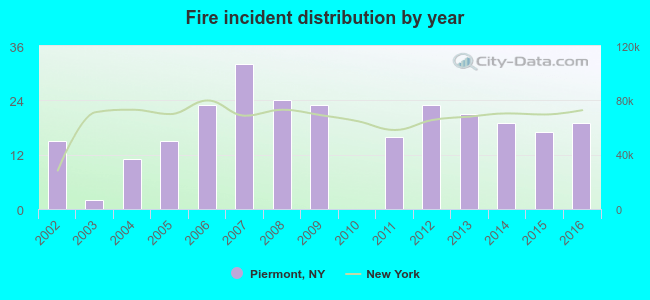
2002 - 2016 National Fire Incident Reporting System (NFIRS) incidents
According to the data from the years 2002 - 2016 the average number of fire incidents per year is 17. The highest number of fires - 32 took place in 2007, and the least - 0 in 2010. The data has an increasing trend.
When looking into fire subcategories, the most incidents belonged to: Structure Fires (76.5%), and Outside Fires (10.4%).
Fire incident types reported to NFIRS in Piermont, NY


 Recent articles from our blog. Our writers, many of them Ph.D. graduates or candidates, create easy-to-read articles on a wide variety of topics.

 , pop. 86,764).

 According to the data from the years 2002 - 2016 the average number of fire incidents per year is 17. The highest number of fires - 32 took place in 2007, and the least - 0 in 2010. The data has an increasing trend.
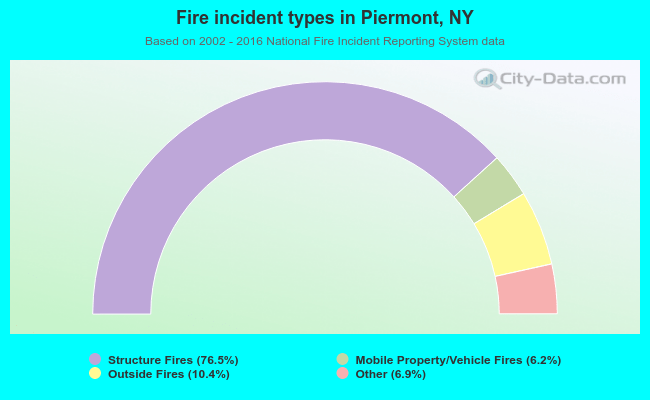 When looking into fire subcategories, the most incidents belonged to: Structure Fires (76.5%), and Outside Fires (10.4%).