Housing density: 1,415 houses/condos per square mile
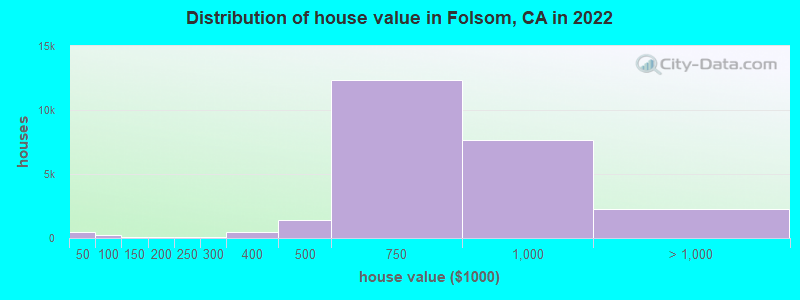
Median price asked for vacant for-sale houses and condos in 2022: $427,524.
Median contract rent in 2022: over $2,000 (lower quartile is $1,593, upper quartile is over $2,000)
Median rent asked for vacant for-rent units in 2022: $2,546
Median gross rent in Folsom, CA in 2022: over $2,000
Housing units in Folsom with a mortgage: 13,937 (799 second mortgage, 0 home equity loan, 752 both second mortgage and home equity loan) Houses without a mortgage: 106
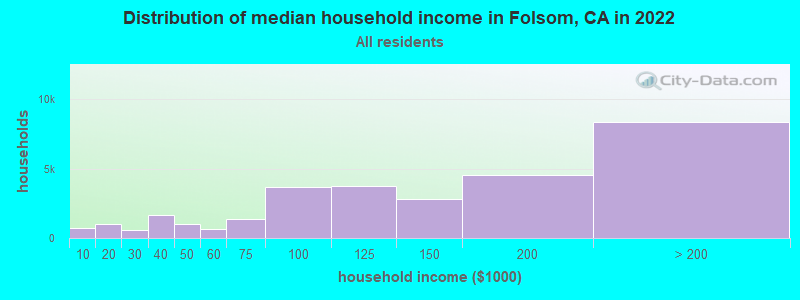
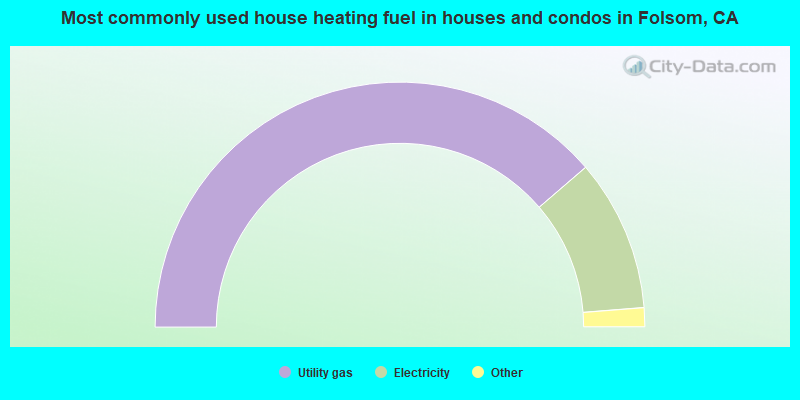
Median household income for houses/condos with a mortgage: $181,695
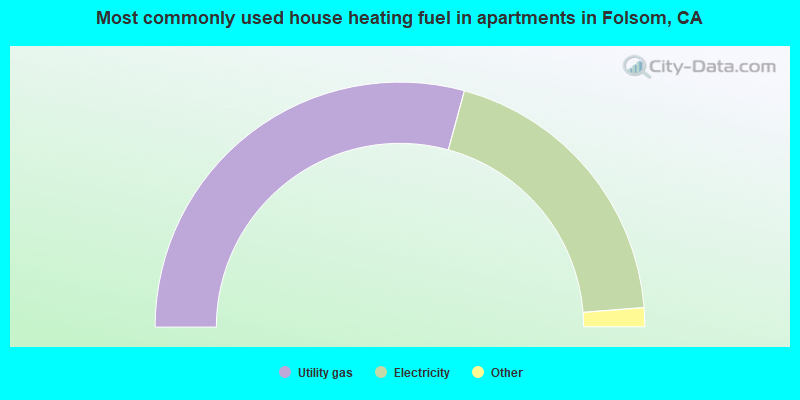
Median household income for apartments without a mortgage: $97,471
Size of family households: 9,157 2-persons, 5,590 3-persons, 5,736 4-persons, 1,274 5-persons, 365 6-persons, 232 7-or-more-persons.
Size of nonfamily households: 6,409 1-person, 979 2-persons, 434 3-persons.
15,172 married couples with children.
2,193 single-parent households (894 men, 1,299 women).
74.4% of residents of Folsom speak English at home.
6.2% of residents speak Spanish at home (78% speak English very well, 13% speak English well, 7% speak English not well, 2% don't speak English at all).
7.7% of residents speak other Indo-European language at home (83% speak English very well, 12% speak English well, 4% speak English not well, 1% don't speak English at all).
9.2% of residents speak Asian or Pacific Island language at home (69% speak English very well, 24% speak English well, 6% speak English not well, 1% don't speak English at all).
1.6% of residents speak other language at home (91% speak English very well, 8% speak English well, 1% speak English not well).
Foreign born population: 17,804 (21.4%)
(68.1% of them are naturalized citizens)
Percentage of workers working in this county: 83.5% Number of people working at home: 12,929 (33.7% of all workers)
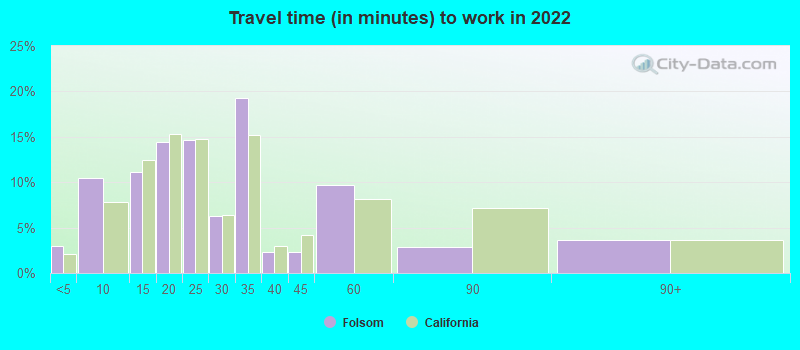
Travel time to work (commute)
Less than 5 minutes: 1,054
5 to 9 minutes: 3,279
10 to 14 minutes: 3,163
15 to 19 minutes: 3,951
20 to 24 minutes: 4,021
25 to 29 minutes: 2,157
30 to 34 minutes: 3,546
35 to 39 minutes: 1,954
40 to 44 minutes: 913
45 to 59 minutes: 2,126
60 to 89 minutes: 651
90 or more minutes: 899
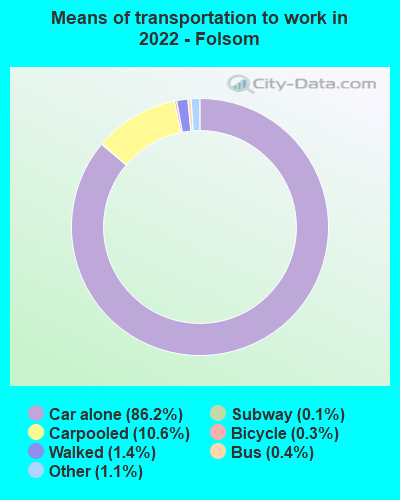
Means of transportation to work:
Drove a car alone: 33,523 (65.7%)
Carpooled: 4,244 (8.3%)
Bus: 81 (0.2%)
Long-distance train or commuter rail: 36 (0.1%)
Taxi: 501 (1.0%)
Bicycle: 98 (0.2%)
Walked: 589 (1.2%)
Worked at home: 12,929 (25.4%)
Unemployment by race in 2022
Unemployment rate for White non-Hispanic residents
6.0%Males
7.0%Females
Unemployment rate for Black residents
0.4%Males
Unemployment rate for Asian residents
2.0%Males
2.3%Females
Unemployment rate for other race residents
1.7%Males
Unemployment rate for two or more race residents
15.4%Males
8.4%Females
Unemployment rate for Hispanic or Latino residents
6.7%Males
5.1%Females
Year of entry for the foreign-born population in Folsom, California
4,8342010 or later
3,8342000 to 2009
3,2571990 to 1999
1,1151980 to 1989
7411970 to 1979
836Before 1970
First ancestries reported:
English: 3,030 (7.1%)
European: 2,583 (6.1%)
German: 2,544 (6.0%)
American: 1,968 (4.6%)
Irish: 1,894 (4.5%)
Italian: 1,809 (4.3%)
Iranian: 1,073 (2.5%)
Scottish: 503 (1.2%)
Norwegian: 466 (1.1%)
Swedish: 272 (0.6%)
Polish: 245 (0.6%)
French: 239 (0.6%)
Portuguese: 225 (0.5%)
Jordanian: 206 (0.5%)
African: 205 (0.5%)
Assyrian: 202 (0.5%)
Northern European: 170 (0.4%)
British: 170 (0.4%)
Russian: 166 (0.4%)
Lebanese: 135 (0.3%)
Greek: 130 (0.3%)
Ukrainian: 127 (0.3%)
Dutch: 111 (0.3%)
Scandinavian: 96 (0.2%)
Danish: 94 (0.2%)
Yugoslavian: 92 (0.2%)
Armenian: 88 (0.2%)
Scotch-Irish: 80 (0.2%)
Turkish: 74 (0.2%)
Swiss: 67 (0.2%)
Hungarian: 64 (0.2%)
Soviet Union: 63 (0.1%)
Eastern European: 62 (0.1%)
Afghan: 58 (0.1%)
Canadian: 54 (0.1%)
Welsh: 49 (0.1%)
Jamaican: 44 (0.1%)
Nigerian: 43 (0.1%)
Maltese: 42 (0.10%)
Croatian: 41 (0.10%)
Ghanaian: 40 (0.09%)
French Canadian: 38 (0.09%)
Romanian: 38 (0.09%)
Palestinian: 29 (0.07%)
Macedonian: 24 (0.06%)
Slavic: 23 (0.05%)
Egyptian: 23 (0.05%)
Bahamian: 22 (0.05%)
Cajun: 19 (0.04%)
Czech: 18 (0.04%)
Slovene: 17 (0.04%)
Brazilian: 16 (0.04%)
Austrian: 14 (0.03%)
Slovak: 12 (0.03%)
Celtic: 10 (0.02%)
Lithuanian: 10 (0.02%)
Serbian: 10 (0.02%)
Bulgarian: 8 (0.02%)
Ethiopian: 7 (0.02%)
Basque: 7 (0.02%)
Belgian: 5 (0.01%)
Finnish: 3 (0.01%)
Icelander: 3 (0.01%)
Most common places of birth for foreign-born residents (%):
India
Folsom:
35.3% (5,247)
California:
5.2% (539,184)
Philippines
Folsom:
7.8% (1,159)
California:
7.8% (818,297)
Iran
Folsom:
7.1% (1,052)
California:
2.0% (206,004)
Mexico
Folsom:
6.5% (972)
California:
37.2% (3,881,193)
Vietnam
Folsom:
6.2% (920)
California:
4.9% (512,335)
China, excluding Hong Kong and Taiwan
Folsom:
4.7% (702)
California:
6.6% (684,672)
Canada
Folsom:
2.8% (419)
California:
1.2% (127,477)
Hong Kong
Folsom:
2.2% (331)
California:
1.0% (105,215)
Korea
Folsom:
2.1% (311)
California:
3.0% (315,248)
Taiwan
Folsom:
1.9% (281)
California:
1.7% (176,274)
Bangladesh
Folsom:
1.6% (239)
California:
0.2% (18,366)
Place of birth for U.S.-born residents:
This state: 47,040
Other state: 17,760
Northeast: 3,139
Midwest: 4,637
South: 4,906
West: 5,078
84.5% of Folsom residents lived in the same house 1 years ago. Out of people who lived in different houses, 31.6% lived in this county. Out of people who lived in different counties, 80.3% lived in California.
Folsom:
84.5%
State average:
88.9%
Education attainment for males 25 years and older:
No schooling: 483
Nursery to 4th grade: 0
5th and 6th grade: 65
7th and 8th grade: 223
9th grade: 45
10th grade: 203
11th grade: 270
12th grade, no diploma: 57
High school graduate (or equivalency): 3,698
Less than 1 year of college: 1,438
Some college more than 1 year, no degree: 2,785
Associate degree: 2,032
Bachelor's degree: 10,083
Master's degree: 4,970
Professional school degree: 1,250
Doctorate degree: 1,066
Education attainment for females 25 years and older:
No schooling: 156
Nursery to 4th grade: 0
5th and 6th grade: 24
7th and 8th grade: 0
9th grade: 0
10th grade: 13
11th grade: 30
12th grade, no diploma: 126
High school graduate (or equivalency): 4,574
Less than 1 year of college: 1,821
Some college more than 1 year, no degree: 3,956
Associate degree: 2,514
Bachelor's degree: 10,702
Master's degree: 4,723
Professional school degree: 980
Doctorate degree: 466
Housing units in structures:
One, detached: 21,526
One, attached: 1,644
Two: 95
3 or 4: 1,402
5 to 9: 1,030
10 to 19: 1,118
20 to 49: 991
50 or more: 1,994
Mobile homes: 951
Median worth of mobile homes: $234,700
Housing units lacking complete plumbing facilities in 2022: 0.5%
Housing units lacking complete kitchen facilities in 2022: 0.7%
House/condo owner moved in on average 10 years ago