Spanish Fork, Utah Submit your own pictures of this city and show them to the world
OSM Map
General Map
Google Map
MSN Map
OSM Map
General Map
Google Map
MSN Map
OSM Map
General Map
Google Map
MSN Map
OSM Map
General Map
Google Map
MSN Map
Please wait while loading the map...
Population in 2022: 44,102 (99% urban, 1% rural). Population change since 2000: +117.8%Males: 22,378 Females: 21,724
March 2022 cost of living index in Spanish Fork: 87.8 (less than average, U.S. average is 100) Percentage of residents living in poverty in 2022: 6.0%for White Non-Hispanic residents , 12.6% for Black residents , 8.8% for Hispanic or Latino residents , 1.9% for American Indian residents , 18.3% for other race residents , 6.3% for two or more races residents )
Profiles of local businesses
Business Search - 14 Million verified businesses
Data:
Median household income ($)
Median household income (% change since 2000)
Household income diversity
Ratio of average income to average house value (%)
Ratio of average income to average rent
Median household income ($) - White
Median household income ($) - Black or African American
Median household income ($) - Asian
Median household income ($) - Hispanic or Latino
Median household income ($) - American Indian and Alaska Native
Median household income ($) - Multirace
Median household income ($) - Other Race
Median household income for houses/condos with a mortgage ($)
Median household income for apartments without a mortgage ($)
Races - White alone (%)
Races - White alone (% change since 2000)
Races - Black alone (%)
Races - Black alone (% change since 2000)
Races - American Indian alone (%)
Races - American Indian alone (% change since 2000)
Races - Asian alone (%)
Races - Asian alone (% change since 2000)
Races - Hispanic (%)
Races - Hispanic (% change since 2000)
Races - Native Hawaiian and Other Pacific Islander alone (%)
Races - Native Hawaiian and Other Pacific Islander alone (% change since 2000)
Races - Two or more races (%)
Races - Two or more races (% change since 2000)
Races - Other race alone (%)
Races - Other race alone (% change since 2000)
Racial diversity
Unemployment (%)
Unemployment (% change since 2000)
Unemployment (%) - White
Unemployment (%) - Black or African American
Unemployment (%) - Asian
Unemployment (%) - Hispanic or Latino
Unemployment (%) - American Indian and Alaska Native
Unemployment (%) - Multirace
Unemployment (%) - Other Race
Population density (people per square mile)
Population - Males (%)
Population - Females (%)
Population - Males (%) - White
Population - Males (%) - Black or African American
Population - Males (%) - Asian
Population - Males (%) - Hispanic or Latino
Population - Males (%) - American Indian and Alaska Native
Population - Males (%) - Multirace
Population - Males (%) - Other Race
Population - Females (%) - White
Population - Females (%) - Black or African American
Population - Females (%) - Asian
Population - Females (%) - Hispanic or Latino
Population - Females (%) - American Indian and Alaska Native
Population - Females (%) - Multirace
Population - Females (%) - Other Race
Coronavirus confirmed cases (Jun 12, 2024)
Deaths caused by coronavirus (Jun 12, 2024)
Coronavirus confirmed cases (per 100k population) (Jun 12, 2024)
Deaths caused by coronavirus (per 100k population) (Jun 12, 2024)
Daily increase in number of cases (Jun 12, 2024)
Weekly increase in number of cases (Jun 12, 2024)
Cases doubled (in days) (Jun 12, 2024)
Hospitalized patients (Apr 18, 2022)
Negative test results (Apr 18, 2022)
Total test results (Apr 18, 2022)
COVID Vaccine doses distributed (per 100k population) (Sep 19, 2023)
COVID Vaccine doses administered (per 100k population) (Sep 19, 2023)
COVID Vaccine doses distributed (Sep 19, 2023)
COVID Vaccine doses administered (Sep 19, 2023)
Likely homosexual households (%)
Likely homosexual households (% change since 2000)
Likely homosexual households - Lesbian couples (%)
Likely homosexual households - Lesbian couples (% change since 2000)
Likely homosexual households - Gay men (%)
Likely homosexual households - Gay men (% change since 2000)
Cost of living index
Median gross rent ($)
Median contract rent ($)
Median monthly housing costs ($)
Median house or condo value ($)
Median house or condo value ($ change since 2000)
Mean house or condo value by units in structure - 1, detached ($)
Mean house or condo value by units in structure - 1, attached ($)
Mean house or condo value by units in structure - 2 ($)
Mean house or condo value by units in structure by units in structure - 3 or 4 ($)
Mean house or condo value by units in structure - 5 or more ($)
Mean house or condo value by units in structure - Boat, RV, van, etc. ($)
Mean house or condo value by units in structure - Mobile home ($)
Median house or condo value ($) - White
Median house or condo value ($) - Black or African American
Median house or condo value ($) - Asian
Median house or condo value ($) - Hispanic or Latino
Median house or condo value ($) - American Indian and Alaska Native
Median house or condo value ($) - Multirace
Median house or condo value ($) - Other Race
Median resident age
Resident age diversity
Median resident age - Males
Median resident age - Females
Median resident age - White
Median resident age - Black or African American
Median resident age - Asian
Median resident age - Hispanic or Latino
Median resident age - American Indian and Alaska Native
Median resident age - Multirace
Median resident age - Other Race
Median resident age - Males - White
Median resident age - Males - Black or African American
Median resident age - Males - Asian
Median resident age - Males - Hispanic or Latino
Median resident age - Males - American Indian and Alaska Native
Median resident age - Males - Multirace
Median resident age - Males - Other Race
Median resident age - Females - White
Median resident age - Females - Black or African American
Median resident age - Females - Asian
Median resident age - Females - Hispanic or Latino
Median resident age - Females - American Indian and Alaska Native
Median resident age - Females - Multirace
Median resident age - Females - Other Race
Commute - mean travel time to work (minutes)
Travel time to work - Less than 5 minutes (%)
Travel time to work - Less than 5 minutes (% change since 2000)
Travel time to work - 5 to 9 minutes (%)
Travel time to work - 5 to 9 minutes (% change since 2000)
Travel time to work - 10 to 19 minutes (%)
Travel time to work - 10 to 19 minutes (% change since 2000)
Travel time to work - 20 to 29 minutes (%)
Travel time to work - 20 to 29 minutes (% change since 2000)
Travel time to work - 30 to 39 minutes (%)
Travel time to work - 30 to 39 minutes (% change since 2000)
Travel time to work - 40 to 59 minutes (%)
Travel time to work - 40 to 59 minutes (% change since 2000)
Travel time to work - 60 to 89 minutes (%)
Travel time to work - 60 to 89 minutes (% change since 2000)
Travel time to work - 90 or more minutes (%)
Travel time to work - 90 or more minutes (% change since 2000)
Marital status - Never married (%)
Marital status - Now married (%)
Marital status - Separated (%)
Marital status - Widowed (%)
Marital status - Divorced (%)
Median family income ($)
Median family income (% change since 2000)
Median non-family income ($)
Median non-family income (% change since 2000)
Median per capita income ($)
Median per capita income (% change since 2000)
Median family income ($) - White
Median family income ($) - Black or African American
Median family income ($) - Asian
Median family income ($) - Hispanic or Latino
Median family income ($) - American Indian and Alaska Native
Median family income ($) - Multirace
Median family income ($) - Other Race
Median year house/condo built
Median year apartment built
Year house built - Built 2005 or later (%)
Year house built - Built 2000 to 2004 (%)
Year house built - Built 1990 to 1999 (%)
Year house built - Built 1980 to 1989 (%)
Year house built - Built 1970 to 1979 (%)
Year house built - Built 1960 to 1969 (%)
Year house built - Built 1950 to 1959 (%)
Year house built - Built 1940 to 1949 (%)
Year house built - Built 1939 or earlier (%)
Average household size
Household density (households per square mile)
Average household size - White
Average household size - Black or African American
Average household size - Asian
Average household size - Hispanic or Latino
Average household size - American Indian and Alaska Native
Average household size - Multirace
Average household size - Other Race
Occupied housing units (%)
Vacant housing units (%)
Owner occupied housing units (%)
Renter occupied housing units (%)
Vacancy status - For rent (%)
Vacancy status - For sale only (%)
Vacancy status - Rented or sold, not occupied (%)
Vacancy status - For seasonal, recreational, or occasional use (%)
Vacancy status - For migrant workers (%)
Vacancy status - Other vacant (%)
Residents with income below the poverty level (%)
Residents with income below 50% of the poverty level (%)
Children below poverty level (%)
Poor families by family type - Married-couple family (%)
Poor families by family type - Male, no wife present (%)
Poor families by family type - Female, no husband present (%)
Poverty status for native-born residents (%)
Poverty status for foreign-born residents (%)
Poverty among high school graduates not in families (%)
Poverty among people who did not graduate high school not in families (%)
Residents with income below the poverty level (%) - White
Residents with income below the poverty level (%) - Black or African American
Residents with income below the poverty level (%) - Asian
Residents with income below the poverty level (%) - Hispanic or Latino
Residents with income below the poverty level (%) - American Indian and Alaska Native
Residents with income below the poverty level (%) - Multirace
Residents with income below the poverty level (%) - Other Race
Air pollution - Air Quality Index (AQI)
Air pollution - CO
Air pollution - NO2
Air pollution - SO2
Air pollution - Ozone
Air pollution - PM10
Air pollution - PM25
Air pollution - Pb
Crime - Murders per 100,000 population
Crime - Rapes per 100,000 population
Crime - Robberies per 100,000 population
Crime - Assaults per 100,000 population
Crime - Burglaries per 100,000 population
Crime - Thefts per 100,000 population
Crime - Auto thefts per 100,000 population
Crime - Arson per 100,000 population
Crime - City-data.com crime index
Crime - Violent crime index
Crime - Property crime index
Crime - Murders per 100,000 population (5 year average)
Crime - Rapes per 100,000 population (5 year average)
Crime - Robberies per 100,000 population (5 year average)
Crime - Assaults per 100,000 population (5 year average)
Crime - Burglaries per 100,000 population (5 year average)
Crime - Thefts per 100,000 population (5 year average)
Crime - Auto thefts per 100,000 population (5 year average)
Crime - Arson per 100,000 population (5 year average)
Crime - City-data.com crime index (5 year average)
Crime - Violent crime index (5 year average)
Crime - Property crime index (5 year average)
1996 Presidential Elections Results (%) - Democratic Party (Clinton)
1996 Presidential Elections Results (%) - Republican Party (Dole)
1996 Presidential Elections Results (%) - Other
2000 Presidential Elections Results (%) - Democratic Party (Gore)
2000 Presidential Elections Results (%) - Republican Party (Bush)
2000 Presidential Elections Results (%) - Other
2004 Presidential Elections Results (%) - Democratic Party (Kerry)
2004 Presidential Elections Results (%) - Republican Party (Bush)
2004 Presidential Elections Results (%) - Other
2008 Presidential Elections Results (%) - Democratic Party (Obama)
2008 Presidential Elections Results (%) - Republican Party (McCain)
2008 Presidential Elections Results (%) - Other
2012 Presidential Elections Results (%) - Democratic Party (Obama)
2012 Presidential Elections Results (%) - Republican Party (Romney)
2012 Presidential Elections Results (%) - Other
2016 Presidential Elections Results (%) - Democratic Party (Clinton)
2016 Presidential Elections Results (%) - Republican Party (Trump)
2016 Presidential Elections Results (%) - Other
2020 Presidential Elections Results (%) - Democratic Party (Biden)
2020 Presidential Elections Results (%) - Republican Party (Trump)
2020 Presidential Elections Results (%) - Other
Ancestries Reported - Arab (%)
Ancestries Reported - Czech (%)
Ancestries Reported - Danish (%)
Ancestries Reported - Dutch (%)
Ancestries Reported - English (%)
Ancestries Reported - French (%)
Ancestries Reported - French Canadian (%)
Ancestries Reported - German (%)
Ancestries Reported - Greek (%)
Ancestries Reported - Hungarian (%)
Ancestries Reported - Irish (%)
Ancestries Reported - Italian (%)
Ancestries Reported - Lithuanian (%)
Ancestries Reported - Norwegian (%)
Ancestries Reported - Polish (%)
Ancestries Reported - Portuguese (%)
Ancestries Reported - Russian (%)
Ancestries Reported - Scotch-Irish (%)
Ancestries Reported - Scottish (%)
Ancestries Reported - Slovak (%)
Ancestries Reported - Subsaharan African (%)
Ancestries Reported - Swedish (%)
Ancestries Reported - Swiss (%)
Ancestries Reported - Ukrainian (%)
Ancestries Reported - United States (%)
Ancestries Reported - Welsh (%)
Ancestries Reported - West Indian (%)
Ancestries Reported - Other (%)
Educational Attainment - No schooling completed (%)
Educational Attainment - Less than high school (%)
Educational Attainment - High school or equivalent (%)
Educational Attainment - Less than 1 year of college (%)
Educational Attainment - 1 or more years of college (%)
Educational Attainment - Associate degree (%)
Educational Attainment - Bachelor's degree (%)
Educational Attainment - Master's degree (%)
Educational Attainment - Professional school degree (%)
Educational Attainment - Doctorate degree (%)
School Enrollment - Nursery, preschool (%)
School Enrollment - Kindergarten (%)
School Enrollment - Grade 1 to 4 (%)
School Enrollment - Grade 5 to 8 (%)
School Enrollment - Grade 9 to 12 (%)
School Enrollment - College undergrad (%)
School Enrollment - Graduate or professional (%)
School Enrollment - Not enrolled in school (%)
School enrollment - Public schools (%)
School enrollment - Private schools (%)
School enrollment - Not enrolled (%)
Median number of rooms in houses and condos
Median number of rooms in apartments
Housing units lacking complete plumbing facilities (%)
Housing units lacking complete kitchen facilities (%)
Density of houses
Urban houses (%)
Rural houses (%)
Households with people 60 years and over (%)
Households with people 65 years and over (%)
Households with people 75 years and over (%)
Households with one or more nonrelatives (%)
Households with no nonrelatives (%)
Population in households (%)
Family households (%)
Nonfamily households (%)
Population in families (%)
Family households with own children (%)
Median number of bedrooms in owner occupied houses
Mean number of bedrooms in owner occupied houses
Median number of bedrooms in renter occupied houses
Mean number of bedrooms in renter occupied houses
Median number of vehichles in owner occupied houses
Mean number of vehichles in owner occupied houses
Median number of vehichles in renter occupied houses
Mean number of vehichles in renter occupied houses
Mortgage status - with mortgage (%)
Mortgage status - with second mortgage (%)
Mortgage status - with home equity loan (%)
Mortgage status - with both second mortgage and home equity loan (%)
Mortgage status - without a mortgage (%)
Average family size
Average family size - White
Average family size - Black or African American
Average family size - Asian
Average family size - Hispanic or Latino
Average family size - American Indian and Alaska Native
Average family size - Multirace
Average family size - Other Race
Geographical mobility - Same house 1 year ago (%)
Geographical mobility - Moved within same county (%)
Geographical mobility - Moved from different county within same state (%)
Geographical mobility - Moved from different state (%)
Geographical mobility - Moved from abroad (%)
Place of birth - Born in state of residence (%)
Place of birth - Born in other state (%)
Place of birth - Native, outside of US (%)
Place of birth - Foreign born (%)
Housing units in structures - 1, detached (%)
Housing units in structures - 1, attached (%)
Housing units in structures - 2 (%)
Housing units in structures - 3 or 4 (%)
Housing units in structures - 5 to 9 (%)
Housing units in structures - 10 to 19 (%)
Housing units in structures - 20 to 49 (%)
Housing units in structures - 50 or more (%)
Housing units in structures - Mobile home (%)
Housing units in structures - Boat, RV, van, etc. (%)
House/condo owner moved in on average (years ago)
Renter moved in on average (years ago)
Year householder moved into unit - Moved in 1999 to March 2000 (%)
Year householder moved into unit - Moved in 1995 to 1998 (%)
Year householder moved into unit - Moved in 1990 to 1994 (%)
Year householder moved into unit - Moved in 1980 to 1989 (%)
Year householder moved into unit - Moved in 1970 to 1979 (%)
Year householder moved into unit - Moved in 1969 or earlier (%)
Means of transportation to work - Drove car alone (%)
Means of transportation to work - Carpooled (%)
Means of transportation to work - Public transportation (%)
Means of transportation to work - Bus or trolley bus (%)
Means of transportation to work - Streetcar or trolley car (%)
Means of transportation to work - Subway or elevated (%)
Means of transportation to work - Railroad (%)
Means of transportation to work - Ferryboat (%)
Means of transportation to work - Taxicab (%)
Means of transportation to work - Motorcycle (%)
Means of transportation to work - Bicycle (%)
Means of transportation to work - Walked (%)
Means of transportation to work - Other means (%)
Working at home (%)
Industry diversity
Most Common Industries - Agriculture, forestry, fishing and hunting, and mining (%)
Most Common Industries - Agriculture, forestry, fishing and hunting (%)
Most Common Industries - Mining, quarrying, and oil and gas extraction (%)
Most Common Industries - Construction (%)
Most Common Industries - Manufacturing (%)
Most Common Industries - Wholesale trade (%)
Most Common Industries - Retail trade (%)
Most Common Industries - Transportation and warehousing, and utilities (%)
Most Common Industries - Transportation and warehousing (%)
Most Common Industries - Utilities (%)
Most Common Industries - Information (%)
Most Common Industries - Finance and insurance, and real estate and rental and leasing (%)
Most Common Industries - Finance and insurance (%)
Most Common Industries - Real estate and rental and leasing (%)
Most Common Industries - Professional, scientific, and management, and administrative and waste management services (%)
Most Common Industries - Professional, scientific, and technical services (%)
Most Common Industries - Management of companies and enterprises (%)
Most Common Industries - Administrative and support and waste management services (%)
Most Common Industries - Educational services, and health care and social assistance (%)
Most Common Industries - Educational services (%)
Most Common Industries - Health care and social assistance (%)
Most Common Industries - Arts, entertainment, and recreation, and accommodation and food services (%)
Most Common Industries - Arts, entertainment, and recreation (%)
Most Common Industries - Accommodation and food services (%)
Most Common Industries - Other services, except public administration (%)
Most Common Industries - Public administration (%)
Occupation diversity
Most Common Occupations - Management, business, science, and arts occupations (%)
Most Common Occupations - Management, business, and financial occupations (%)
Most Common Occupations - Management occupations (%)
Most Common Occupations - Business and financial operations occupations (%)
Most Common Occupations - Computer, engineering, and science occupations (%)
Most Common Occupations - Computer and mathematical occupations (%)
Most Common Occupations - Architecture and engineering occupations (%)
Most Common Occupations - Life, physical, and social science occupations (%)
Most Common Occupations - Education, legal, community service, arts, and media occupations (%)
Most Common Occupations - Community and social service occupations (%)
Most Common Occupations - Legal occupations (%)
Most Common Occupations - Education, training, and library occupations (%)
Most Common Occupations - Arts, design, entertainment, sports, and media occupations (%)
Most Common Occupations - Healthcare practitioners and technical occupations (%)
Most Common Occupations - Health diagnosing and treating practitioners and other technical occupations (%)
Most Common Occupations - Health technologists and technicians (%)
Most Common Occupations - Service occupations (%)
Most Common Occupations - Healthcare support occupations (%)
Most Common Occupations - Protective service occupations (%)
Most Common Occupations - Fire fighting and prevention, and other protective service workers including supervisors (%)
Most Common Occupations - Law enforcement workers including supervisors (%)
Most Common Occupations - Food preparation and serving related occupations (%)
Most Common Occupations - Building and grounds cleaning and maintenance occupations (%)
Most Common Occupations - Personal care and service occupations (%)
Most Common Occupations - Sales and office occupations (%)
Most Common Occupations - Sales and related occupations (%)
Most Common Occupations - Office and administrative support occupations (%)
Most Common Occupations - Natural resources, construction, and maintenance occupations (%)
Most Common Occupations - Farming, fishing, and forestry occupations (%)
Most Common Occupations - Construction and extraction occupations (%)
Most Common Occupations - Installation, maintenance, and repair occupations (%)
Most Common Occupations - Production, transportation, and material moving occupations (%)
Most Common Occupations - Production occupations (%)
Most Common Occupations - Transportation occupations (%)
Most Common Occupations - Material moving occupations (%)
People in Group quarters - Institutionalized population (%)
People in Group quarters - Correctional institutions (%)
People in Group quarters - Federal prisons and detention centers (%)
People in Group quarters - Halfway houses (%)
People in Group quarters - Local jails and other confinement facilities (including police lockups) (%)
People in Group quarters - Military disciplinary barracks (%)
People in Group quarters - State prisons (%)
People in Group quarters - Other types of correctional institutions (%)
People in Group quarters - Nursing homes (%)
People in Group quarters - Hospitals/wards, hospices, and schools for the handicapped (%)
People in Group quarters - Hospitals/wards and hospices for chronically ill (%)
People in Group quarters - Hospices or homes for chronically ill (%)
People in Group quarters - Military hospitals or wards for chronically ill (%)
People in Group quarters - Other hospitals or wards for chronically ill (%)
People in Group quarters - Hospitals or wards for drug/alcohol abuse (%)
People in Group quarters - Mental (Psychiatric) hospitals or wards (%)
People in Group quarters - Schools, hospitals, or wards for the mentally retarded (%)
People in Group quarters - Schools, hospitals, or wards for the physically handicapped (%)
People in Group quarters - Institutions for the deaf (%)
People in Group quarters - Institutions for the blind (%)
People in Group quarters - Orthopedic wards and institutions for the physically handicapped (%)
People in Group quarters - Wards in general hospitals for patients who have no usual home elsewhere (%)
People in Group quarters - Wards in military hospitals for patients who have no usual home elsewhere (%)
People in Group quarters - Juvenile institutions (%)
People in Group quarters - Long-term care (%)
People in Group quarters - Homes for abused, dependent, and neglected children (%)
People in Group quarters - Residential treatment centers for emotionally disturbed children (%)
People in Group quarters - Training schools for juvenile delinquents (%)
People in Group quarters - Short-term care, detention or diagnostic centers for delinquent children (%)
People in Group quarters - Type of juvenile institution unknown (%)
People in Group quarters - Noninstitutionalized population (%)
People in Group quarters - College dormitories (includes college quarters off campus) (%)
People in Group quarters - Military quarters (%)
People in Group quarters - On base (%)
People in Group quarters - Barracks, unaccompanied personnel housing (UPH), (Enlisted/Officer), ;and similar group living quarters for military personnel (%)
People in Group quarters - Transient quarters for temporary residents (%)
People in Group quarters - Military ships (%)
People in Group quarters - Group homes (%)
People in Group quarters - Homes or halfway houses for drug/alcohol abuse (%)
People in Group quarters - Homes for the mentally ill (%)
People in Group quarters - Homes for the mentally retarded (%)
People in Group quarters - Homes for the physically handicapped (%)
People in Group quarters - Other group homes (%)
People in Group quarters - Religious group quarters (%)
People in Group quarters - Dormitories (%)
People in Group quarters - Agriculture workers' dormitories on farms (%)
People in Group quarters - Job Corps and vocational training facilities (%)
People in Group quarters - Other workers' dormitories (%)
People in Group quarters - Crews of maritime vessels (%)
People in Group quarters - Other nonhousehold living situations (%)
People in Group quarters - Other noninstitutional group quarters (%)
Residents speaking English at home (%)
Residents speaking English at home - Born in the United States (%)
Residents speaking English at home - Native, born elsewhere (%)
Residents speaking English at home - Foreign born (%)
Residents speaking Spanish at home (%)
Residents speaking Spanish at home - Born in the United States (%)
Residents speaking Spanish at home - Native, born elsewhere (%)
Residents speaking Spanish at home - Foreign born (%)
Residents speaking other language at home (%)
Residents speaking other language at home - Born in the United States (%)
Residents speaking other language at home - Native, born elsewhere (%)
Residents speaking other language at home - Foreign born (%)
Class of Workers - Employee of private company (%)
Class of Workers - Self-employed in own incorporated business (%)
Class of Workers - Private not-for-profit wage and salary workers (%)
Class of Workers - Local government workers (%)
Class of Workers - State government workers (%)
Class of Workers - Federal government workers (%)
Class of Workers - Self-employed workers in own not incorporated business and Unpaid family workers (%)
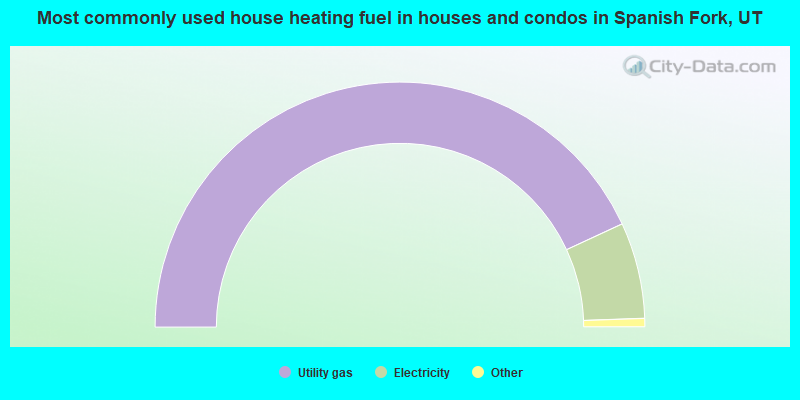
House heating fuel used in houses and condos - Utility gas (%)
House heating fuel used in houses and condos - Bottled, tank, or LP gas (%)
House heating fuel used in houses and condos - Electricity (%)
House heating fuel used in houses and condos - Fuel oil, kerosene, etc. (%)
House heating fuel used in houses and condos - Coal or coke (%)
House heating fuel used in houses and condos - Wood (%)
House heating fuel used in houses and condos - Solar energy (%)
House heating fuel used in houses and condos - Other fuel (%)
House heating fuel used in houses and condos - No fuel used (%)
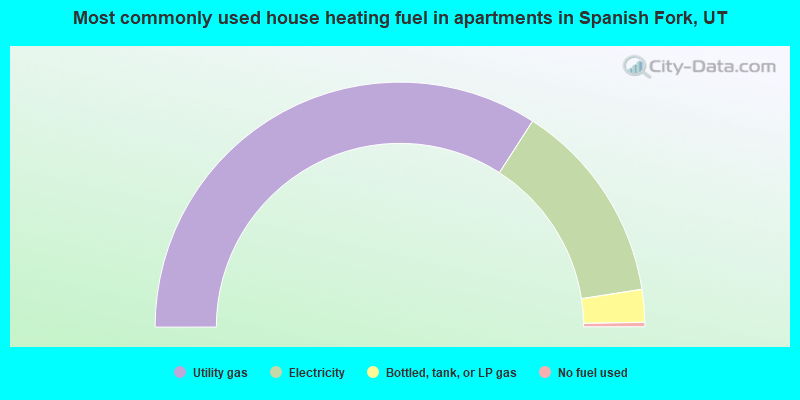
House heating fuel used in apartments - Utility gas (%)
House heating fuel used in apartments - Bottled, tank, or LP gas (%)
House heating fuel used in apartments - Electricity (%)
House heating fuel used in apartments - Fuel oil, kerosene, etc. (%)
House heating fuel used in apartments - Coal or coke (%)
House heating fuel used in apartments - Wood (%)
House heating fuel used in apartments - Solar energy (%)
House heating fuel used in apartments - Other fuel (%)
House heating fuel used in apartments - No fuel used (%)
Armed forces status - In Armed Forces (%)
Armed forces status - Civilian (%)
Armed forces status - Civilian - Veteran (%)
Armed forces status - Civilian - Nonveteran (%)
Fatal accidents locations in years 2005-2021
Fatal accidents locations in 2005
Fatal accidents locations in 2006
Fatal accidents locations in 2007
Fatal accidents locations in 2008
Fatal accidents locations in 2009
Fatal accidents locations in 2010
Fatal accidents locations in 2011
Fatal accidents locations in 2012
Fatal accidents locations in 2013
Fatal accidents locations in 2014
Fatal accidents locations in 2015
Fatal accidents locations in 2016
Fatal accidents locations in 2017
Fatal accidents locations in 2018
Fatal accidents locations in 2019
Fatal accidents locations in 2020
Fatal accidents locations in 2021
Alcohol use - People drinking some alcohol every month (%)
Alcohol use - People not drinking at all (%)
Alcohol use - Average days/month drinking alcohol
Alcohol use - Average drinks/week
Alcohol use - Average days/year people drink much
Audiometry - Average condition of hearing (%)
Audiometry - People that can hear a whisper from across a quiet room (%)
Audiometry - People that can hear normal voice from across a quiet room (%)
Audiometry - Ears ringing, roaring, buzzing (%)
Audiometry - Had a job exposure to loud noise (%)
Audiometry - Had off-work exposure to loud noise (%)
Blood Pressure & Cholesterol - Has high blood pressure (%)
Blood Pressure & Cholesterol - Checking blood pressure at home (%)
Blood Pressure & Cholesterol - Frequently checking blood cholesterol (%)
Blood Pressure & Cholesterol - Has high cholesterol level (%)
Consumer Behavior - Money monthly spent on food at supermarket/grocery store
Consumer Behavior - Money monthly spent on food at other stores
Consumer Behavior - Money monthly spent on eating out
Consumer Behavior - Money monthly spent on carryout/delivered foods
Consumer Behavior - Income spent on food at supermarket/grocery store (%)
Consumer Behavior - Income spent on food at other stores (%)
Consumer Behavior - Income spent on eating out (%)
Consumer Behavior - Income spent on carryout/delivered foods (%)
Current Health Status - General health condition (%)
Current Health Status - Blood donors (%)
Current Health Status - Has blood ever tested for HIV virus (%)
Current Health Status - Left-handed people (%)
Dermatology - People using sunscreen (%)
Diabetes - Diabetics (%)
Diabetes - Had a blood test for high blood sugar (%)
Diabetes - People taking insulin (%)
Diet Behavior & Nutrition - Diet health (%)
Diet Behavior & Nutrition - Milk product consumption (# of products/month)
Diet Behavior & Nutrition - Meals not home prepared (#/week)
Diet Behavior & Nutrition - Meals from fast food or pizza place (#/week)
Diet Behavior & Nutrition - Ready-to-eat foods (#/month)
Diet Behavior & Nutrition - Frozen meals/pizza (#/month)
Drug Use - People that ever used marijuana or hashish (%)
Drug Use - Ever used hard drugs (%)
Drug Use - Ever used any form of cocaine (%)
Drug Use - Ever used heroin (%)
Drug Use - Ever used methamphetamine (%)
Health Insurance - People covered by health insurance (%)
Kidney Conditions-Urology - Avg. # of times urinating at night
Medical Conditions - People with asthma (%)
Medical Conditions - People with anemia (%)
Medical Conditions - People with psoriasis (%)
Medical Conditions - People with overweight (%)
Medical Conditions - Elderly people having difficulties in thinking or remembering (%)
Medical Conditions - People who ever received blood transfusion (%)
Medical Conditions - People having trouble seeing even with glass/contacts (%)
Medical Conditions - People with arthritis (%)
Medical Conditions - People with gout (%)
Medical Conditions - People with congestive heart failure (%)
Medical Conditions - People with coronary heart disease (%)
Medical Conditions - People with angina pectoris (%)
Medical Conditions - People who ever had heart attack (%)
Medical Conditions - People who ever had stroke (%)
Medical Conditions - People with emphysema (%)
Medical Conditions - People with thyroid problem (%)
Medical Conditions - People with chronic bronchitis (%)
Medical Conditions - People with any liver condition (%)
Medical Conditions - People who ever had cancer or malignancy (%)
Mental Health - People who have little interest in doing things (%)
Mental Health - People feeling down, depressed, or hopeless (%)
Mental Health - People who have trouble sleeping or sleeping too much (%)
Mental Health - People feeling tired or having little energy (%)
Mental Health - People with poor appetite or overeating (%)
Mental Health - People feeling bad about themself (%)
Mental Health - People who have trouble concentrating on things (%)
Mental Health - People moving or speaking slowly or too fast (%)
Mental Health - People having thoughts they would be better off dead (%)
Oral Health - Average years since last visit a dentist
Oral Health - People embarrassed because of mouth (%)
Oral Health - People with gum disease (%)
Oral Health - General health of teeth and gums (%)
Oral Health - Average days a week using dental floss/device
Oral Health - Average days a week using mouthwash for dental problem
Oral Health - Average number of teeth
Pesticide Use - Households using pesticides to control insects (%)
Pesticide Use - Households using pesticides to kill weeds (%)
Physical Activity - People doing vigorous-intensity work activities (%)
Physical Activity - People doing moderate-intensity work activities (%)
Physical Activity - People walking or bicycling (%)
Physical Activity - People doing vigorous-intensity recreational activities (%)
Physical Activity - People doing moderate-intensity recreational activities (%)
Physical Activity - Average hours a day doing sedentary activities
Physical Activity - Average hours a day watching TV or videos
Physical Activity - Average hours a day using computer
Physical Functioning - People having limitations keeping them from working (%)
Physical Functioning - People limited in amount of work they can do (%)
Physical Functioning - People that need special equipment to walk (%)
Physical Functioning - People experiencing confusion/memory problems (%)
Physical Functioning - People requiring special healthcare equipment (%)
Prescription Medications - Average number of prescription medicines taking
Preventive Aspirin Use - Adults 40+ taking low-dose aspirin (%)
Reproductive Health - Vaginal deliveries (%)
Reproductive Health - Cesarean deliveries (%)
Reproductive Health - Deliveries resulted in a live birth (%)
Reproductive Health - Pregnancies resulted in a delivery (%)
Reproductive Health - Women breastfeeding newborns (%)
Reproductive Health - Women that had a hysterectomy (%)
Reproductive Health - Women that had both ovaries removed (%)
Reproductive Health - Women that have ever taken birth control pills (%)
Reproductive Health - Women taking birth control pills (%)
Reproductive Health - Women that have ever used Depo-Provera or injectables (%)
Reproductive Health - Women that have ever used female hormones (%)
Sexual Behavior - People 18+ that ever had sex (vaginal, anal, or oral) (%)
Sexual Behavior - Males 18+ that ever had vaginal sex with a woman (%)
Sexual Behavior - Males 18+ that ever performed oral sex on a woman (%)
Sexual Behavior - Males 18+ that ever had anal sex with a woman (%)
Sexual Behavior - Males 18+ that ever had any sex with a man (%)
Sexual Behavior - Females 18+ that ever had vaginal sex with a man (%)
Sexual Behavior - Females 18+ that ever performed oral sex on a man (%)
Sexual Behavior - Females 18+ that ever had anal sex with a man (%)
Sexual Behavior - Females 18+ that ever had any kind of sex with a woman (%)
Sexual Behavior - Average age people first had sex
Sexual Behavior - Average number of female sex partners in lifetime (males 18+)
Sexual Behavior - Average number of female vaginal sex partners in lifetime (males 18+)
Sexual Behavior - Average age people first performed oral sex on a woman (18+)
Sexual Behavior - Average number of woman performed oral sex on in lifetime (18+)
Sexual Behavior - Average number of male sex partners in lifetime (males 18+)
Sexual Behavior - Average number of male anal sex partners in lifetime (males 18+)
Sexual Behavior - Average age people first performed oral sex on a man (18+)
Sexual Behavior - Average number of male oral sex partners in lifetime (18+)
Sexual Behavior - People using protection when performing oral sex (%)
Sexual Behavior - Average number of times people have vaginal or anal sex a year
Sexual Behavior - People having sex without condom (%)
Sexual Behavior - Average number of male sex partners in lifetime (females 18+)
Sexual Behavior - Average number of male vaginal sex partners in lifetime (females 18+)
Sexual Behavior - Average number of female sex partners in lifetime (females 18+)
Sexual Behavior - Circumcised males 18+ (%)
Sleep Disorders - Average hours sleeping at night
Sleep Disorders - People that has trouble sleeping (%)
Smoking-Cigarette Use - People smoking cigarettes (%)
Taste & Smell - People 40+ having problems with smell (%)
Taste & Smell - People 40+ having problems with taste (%)
Taste & Smell - People 40+ that ever had wisdom teeth removed (%)
Taste & Smell - People 40+ that ever had tonsils teeth removed (%)
Taste & Smell - People 40+ that ever had a loss of consciousness because of a head injury (%)
Taste & Smell - People 40+ that ever had a broken nose or other serious injury to face or skull (%)
Taste & Smell - People 40+ that ever had two or more sinus infections (%)
Weight - Average height (inches)
Weight - Average weight (pounds)
Weight - Average BMI
Weight - People that are obese (%)
Weight - People that ever were obese (%)
Weight - People trying to lose weight (%)
According to our research of Utah and other state lists, there were 63 registered sex offenders living in Spanish Fork, Utah as of June 12, 2024 . The ratio of all residents to sex offenders in Spanish Fork is 626 to 1.The ratio of registered sex offenders to all residents in this city is lower than the state average.
Officers per 1,000 residents here:
0.98Utah average:
1.67
Latest news from Spanish Fork, UT collected exclusively by city-data.com from local newspapers, TV, and radio stations
Ancestries: English (31.3%), American (12.2%), European (7.4%), German (3.5%), Scottish (2.2%), Irish (2.0%).
Current Local Time:
Incorporated on 01/17/1855
Land area: 13.2 square miles.
Population density: 3,331 people per square mile (average).
1,965 residents are foreign born (3.5% Latin America ).
Median real estate property taxes paid for housing units with mortgages in 2022: $2,070 (0.4%)Median real estate property taxes paid for housing units with no mortgage in 2022: $1,974 (0.4%)
Nearest city with pop. 50,000+: Provo, UT
Nearest city with pop. 200,000+: Las Vegas, NV
Nearest city with pop. 1,000,000+: Phoenix, AZ
Nearest cities:
Latitude: 40.10 N, Longitude: 111.64 W
Daytime population change due to commuting: -2,418 (-5.4%)Workers who live and work in this city: 8,151 (37.3%)
Single-family new house construction building permits:
2022: 342 buildings , average cost: $291,8002021: 457 buildings , average cost: $219,5002020: 379 buildings , average cost: $252,5002019: 280 buildings , average cost: $262,2002018: 422 buildings , average cost: $255,0002017: 278 buildings , average cost: $276,5002016: 272 buildings , average cost: $249,3002015: 223 buildings , average cost: $294,2002014: 190 buildings , average cost: $283,9002013: 184 buildings , average cost: $260,9002012: 127 buildings , average cost: $226,4002011: 82 buildings , average cost: $231,5002010: 137 buildings , average cost: $220,2002009: 246 buildings , average cost: $202,8002008: 202 buildings , average cost: $182,3002007: 415 buildings , average cost: $207,5002006: 652 buildings , average cost: $184,9002005: 407 buildings , average cost: $170,2002004: 253 buildings , average cost: $145,0002003: 258 buildings , average cost: $160,1002002: 263 buildings , average cost: $151,5002001: 254 buildings , average cost: $132,0002000: 321 buildings , average cost: $125,0001999: 265 buildings , average cost: $120,4001998: 157 buildings , average cost: $122,4001997: 196 buildings , average cost: $98,800Unemployment in December 2023:
Population change in the 1990s: +8,876 (+78.1%).
Most common occupations in Spanish Fork, UT (%)
Both Males Females
Other production occupations, including supervisors (5.0%)
Other management occupations, except farmers and farm managers (4.0%)
Other sales and related occupations, including supervisors (3.5%)
Material recording, scheduling, dispatching, and distributing workers (3.5%)
Retail sales workers, except cashiers (3.5%)
Electrical equipment mechanics and other installation, maintenance, and repair workers, including supervisors (3.3%)
Computer specialists (3.1%)
Electrical equipment mechanics and other installation, maintenance, and repair workers, including supervisors (5.7%)
Other production occupations, including supervisors (5.6%)
Computer specialists (4.8%)
Metal workers and plastic workers (4.4%)
Other management occupations, except farmers and farm managers (4.2%)
Construction traders workers except carpenters, electricians, painters, plumbers, and construction laborers (3.9%)
Other sales and related occupations, including supervisors (3.6%)
Secretaries and administrative assistants (6.5%)
Cashiers (5.3%)
Information and record clerks, except customer service representatives (4.9%)
Other office and administrative support workers, including supervisors (4.9%)
Retail sales workers, except cashiers (4.7%)
Preschool, kindergarten, elementary, and middle school teachers (4.4%)
Registered nurses (4.3%)
Earthquake activity:
Spanish Fork-area historical earthquake activity is significantly above Utah state average. It is 2221% greater than the overall U.S. average. On 8/18/1959 at 06:37:13, a magnitude 7.7 (7.7 UK, Class: Major, Intensity: VIII - XII) earthquake occurred 312.7 miles away from the city center, causing $26,000,000 total damage On 10/3/1915 at 06:52:48, a magnitude 7.6 (7.6 UK) earthquake occurred 310.3 miles away from the city center On 10/28/1983 at 14:06:06, a magnitude 7.3 (6.2 MB, 7.3 MS, 7.0 MW) earthquake occurred 296.3 miles away from Spanish Fork center, causing 2 deaths ( 2 shaking deaths) and 3 injuries, causing $15,000,000 total damage On 3/28/1975 at 02:31:05, a magnitude 6.2 (6.1 MB, 6.0 MS, 6.2 ML, Class: Strong, Intensity: VII - IX) earthquake occurred 138.9 miles away from the city center On 12/21/1932 at 06:10:09, a magnitude 7.2 (7.2 UK) earthquake occurred 362.0 miles away from Spanish Fork center On 3/18/2020 at 13:09:31, a magnitude 5.7 (5.7 MW, Depth: 7.4 mi, Class: Moderate, Intensity: VI - VII) earthquake occurred 50.3 miles away from the city center Magnitude types: body-wave magnitude (MB), local magnitude (ML), surface-wave magnitude (MS), moment magnitude (MW) Natural disasters: The number of natural disasters in Utah County (7) is smaller than the US average (15).Major Disasters (Presidential) Declared: 3Emergencies Declared: 1Floods: 3, Fires: 2, Landslides: 2, Storms: 2, Hurricane: 1, Mudslide: 1, Other: 1 (Note: some incidents may be assigned to more than one category). Hospitals and medical centers in Spanish Fork: MAPLE CREEK HOME HEALTH (65 WEST 200 NORTH, SUITE 5)
SPANISH FORK NURSING AND REHAB (151 EAST CENTER STREET)
Other hospitals and medical centers near Spanish Fork: ART CITY NURSING AND REHABILITATION CENTER (Nursing Home, about 4 miles away; SPRINGVILLE, UT)
ANNS SIESTA VILLA (Nursing Home, about 5 miles away; SPRINGVILLE, UT)
HOBBLE CREEK NURSING AND REHABILITATION (Nursing Home, about 5 miles away; SPRINGVILLE, UT)
ABSOLUTE COMPASSION HOME HEALTH (Home Health Center, about 6 miles away; PAYSON, UT)
MOUNTAIN VIEW HOSPITAL (about 6 miles away; PAYSON, UT)
MOUNTAIN VIEW HOSPITAL CONTINUING CARE CENTER (Nursing Home, about 6 miles away; PAYSON, UT)
PAYSON REGIONAL DIALYSIS (Dialysis Facility, about 6 miles away; PAYSON, UT)
Airports located in Spanish Fork: Amtrak station near Spanish Fork: 9 miles: PROVO (600 SOUTH & 3OO WEST) Services: fully wheelchair accessible, free short-term parking, free long-term parking, call for taxi service.
Colleges/universities with over 2000 students nearest to Spanish Fork:
Brigham Young University-Provo (about 11 miles; Provo, UT ; Full-time enrollment: 33,525)
Utah Valley University (about 13 miles; Orem, UT ; FT enrollment: 24,403)
Stevens-Henager College-Murray (about 41 miles; Murray, UT ; FT enrollment: 6,395)
Western Governors University (about 42 miles; Salt Lake City, UT ; FT enrollment: 31,481)
Salt Lake Community College (about 43 miles; Salt Lake City, UT ; FT enrollment: 20,797)
Westminster College (about 45 miles; Salt Lake City, UT ; FT enrollment: 2,870)
University of Utah (about 47 miles; Salt Lake City, UT ; FT enrollment: 28,454)
Public high schools in Spanish Fork: DIAMOND FORK JUNIOR HIGH Students: 1,304, Location: 50 N 900 E, Grades: 7-9)MAPLE MOUNTAIN HIGH Students: 1,199, Location: 51 N 2550 E, Grades: 10-12)SPANISH FORK JR HIGH Students: 1,181, Location: 600 S 820 E, Grades: 7-9)SPANISH FORK HIGH Students: 1,027, Location: 99 N 300 W, Grades: 10-12)LANDMARK HIGH Students: 257, Location: 612 S MAIN, Grades: 10-12)AMERICAN LEADERSHIP ACADEMY Location: 898 W 1100 S, Grades: KG-12, Charter school )
SIERRA BONITA ELEMENTARY Location: 53 S 1800 E, Grades: PK-10)
Private high schools in Spanish Fork: NEW HAVEN SCHOOL Students: 66, Location: 2152 E 7200 S, Grades: UG-12, Girls only )MAPLE LAKE ACADEMY Students: 23, Location: 6155 S 2400 W, Grades: 8-12)
Public elementary/middle schools in Spanish Fork: EAST MEADOWS SCHOOL Students: 856, Location: 1287 S 2130 E, Grades: PK-6)REES SCHOOL Students: 821, Location: 574 N REES AVE, Grades: PK-6)SPANISH OAKS SCHOOL Students: 808, Location: 2701 E CANYON CREST DR, Grades: PK-6)RIVERVIEW SCHOOL Students: 776, Location: 628 S WEST PARK DRIVE, Grades: PK-6)CANYON SCHOOL Students: 689, Location: 1492 E 1240 S, Grades: PK-6)BROCKBANK SCHOOL Students: 574, Location: 340 W 500 N, Grades: PK-6)LARSEN SCHOOL Students: 521, Location: 1175 E FLONETTE DR, Grades: PK-6)PARK SCHOOL Students: 494, Location: 90 N 600 E, Grades: PK-6)See full list of schools located in Spanish Fork Library in Spanish Fork: SPANISH FORK PUBLIC LIBRARY Operating income: $554,215; Location: 49 SOUTH MAIN STREET; 59,709 books ; 3,208 audio materials ; 4,810 video materials ; 39 state licensed databases ; 91 print serial subscriptions )
Birthplace of: Jennie B. Knight - Mormon missionary, Margaret Draper - Actress, Hefa Leone Tuita - Dancer.
Utah County has a predicted average indoor radon screening level between 2 and 4 pCi/L (pico curies per liter) - Moderate Potential Drinking water stations with addresses in Spanish Fork and their reported violations in the past:
SPANISH FORK CITY (Population served: 35,000, Groundwater):
Past health violations:
MCL, Monthly (TCR) - In AUG-2008, Contaminant: Coliform. Follow-up actions: St Public Notif requested (SEP-25-2008), St Violation/Reminder Notice (SEP-25-2008), St Compliance achieved (JUL-01-2010)
Past monitoring violations:
53 regular monitoring violations
Population served: 225, Groundwater):
Past health violations:
MCL, Monthly (TCR) - In NOV-2013, Contaminant: Coliform. Follow-up actions: St Formal NOV issued (JAN-25-2014), St Public Notif requested (JAN-25-2014)
MCL, Monthly (TCR) - In SEP-2013, Contaminant: Coliform
MCL, Monthly (TCR) - In SEP-2012, Contaminant: Coliform. Follow-up actions: St Formal NOV issued (NOV-09-2012), St Public Notif requested (NOV-09-2012)
MCL, Monthly (TCR) - In JUL-2011, Contaminant: Coliform. Follow-up actions: St Public Notif received (AUG-20-2011), St Public Notif requested (SEP-10-2011), St Formal NOV issued (SEP-10-2011)
MCL, Monthly (TCR) - In JUN-2007, Contaminant: Coliform. Follow-up actions: St Violation/Reminder Notice (SEP-11-2007), St Public Notif requested (SEP-11-2007), St Compliance achieved (JAN-01-2008)
MCL, Monthly (TCR) - In JUL-2006, Contaminant: Coliform. Follow-up actions: St Compliance achieved (JAN-01-2008)
Past monitoring violations:
Failure To Address Deficiency - In JAN-01-2012, Contaminant: LT2ESWTR. Follow-up actions: St Formal NOV issued (APR-24-2012), St Public Notif requested (APR-24-2012), St Formal NOV issued (APR-24-2012), St Compliance achieved (APR-24-2012), St Formal NOV issued (APR-24-2012), St Compliance achieved (MAY-03-2012), St Public Notif requested (2 times from APR-24-2013 to APR-24-2013)
Follow-up Or Routine LCR Tap M/R - In OCT-01-2010, Contaminant: Lead and Copper Rule. Follow-up actions: St Compliance achieved (APR-20-2011)
Follow-up Or Routine LCR Tap M/R - In JAN-01-2004, Contaminant: Lead and Copper Rule. Follow-up actions: St Compliance achieved (DEC-27-2005)
Initial Tap Sampling for Pb and Cu - In JUL-01-1997, Contaminant: Lead and Copper Rule. Follow-up actions: St Compliance achieved (2 times from JUN-30-1995 to APR-20-2011)
Initial Tap Sampling for Pb and Cu - In JAN-01-1997, Contaminant: Lead and Copper Rule. Follow-up actions: St Compliance achieved (2 times from JUN-30-1995 to APR-20-2011)
2 routine major monitoring violations
2 minor monitoring violations
7 regular monitoring violations
One other older monitoring violation
Population served: 200, Groundwater):
Past health violations:
MCL, Monthly (TCR) - In MAY-2014, Contaminant: Coliform. Follow-up actions: St Formal NOV issued (JUL-24-2014), St Public Notif requested (JUL-24-2014)
MCL, Monthly (TCR) - In OCT-2008, Contaminant: Coliform. Follow-up actions: St Public Notif requested (NOV-20-2008), St Violation/Reminder Notice (NOV-20-2008), St Public Notif received (DEC-01-2008), St AO (w/penalty) issued (FEB-25-2009), St Compliance achieved (JUL-01-2010)
MCL, Monthly (TCR) - In SEP-2008, Contaminant: Coliform. Follow-up actions: St Public Notif requested (OCT-27-2008), St Violation/Reminder Notice (OCT-27-2008), St Public Notif received (DEC-01-2008), St AO (w/penalty) issued (FEB-25-2009), St Compliance achieved (JUL-01-2010)
MCL, Monthly (TCR) - Between APR-2008 and JUN-2008, Contaminant: Coliform. Follow-up actions: St Violation/Reminder Notice (JUL-22-2008), St Public Notif requested (JUL-22-2008), St AO (w/penalty) issued (FEB-25-2009), St Compliance achieved (JUL-01-2010)
Past monitoring violations:
Monitoring, Source Water (GWR) - In AUG-01-2014, Contaminant: E. COLI. Follow-up actions: St Formal NOV issued (SEP-06-2014), St Public Notif requested (SEP-06-2014)
Monitoring, Source Water (GWR) - In JUN-01-2014, Contaminant: E. COLI. Follow-up actions: St Formal NOV issued (JUL-24-2014), St Public Notif requested (JUL-24-2014)
Monitoring, Repeat Major (TCR) - In AUG-2008, Contaminant: Coliform (TCR). Follow-up actions: St AO (w/penalty) issued (FEB-25-2009), St Compliance achieved (JAN-01-2010)
5 routine major monitoring violations
One minor monitoring violation
5 regular monitoring violations
Population served: 41, Groundwater):
Past monitoring violations:
One minor monitoring violation
Population served: 30, Groundwater):
Past health violations:
MCL, Monthly (TCR) - Between APR-2006 and JUN-2006, Contaminant: Coliform. Follow-up actions: St Compliance achieved (JAN-01-2008)
MCL, Monthly (TCR) - Between OCT-2005 and DEC-2005, Contaminant: Coliform. Follow-up actions: St Public Notif requested (FEB-14-2006), St Violation/Reminder Notice (FEB-14-2006), St Compliance achieved (JAN-01-2008)
Past monitoring violations:
One minor monitoring violation
One regular monitoring violation
Population served: 25, Groundwater):
Past health violations:
MCL, Monthly (TCR) - In AUG-2009, Contaminant: Coliform. Follow-up actions: St Public Notif requested (OCT-02-2009), St Formal NOV issued (OCT-02-2009), St Compliance achieved (JUN-30-2010)
Past monitoring violations:
Monitoring, Repeat Major (TCR) - In JUN-2005, Contaminant: Coliform (TCR). Follow-up actions: St Compliance achieved (JAN-01-2010)
2 routine major monitoring violations
One minor monitoring violation
Drinking water stations with addresses in Spanish Fork that have no violations reported:
CENTRAL UTAH WCD - ASHLEY VALLEY (Population served: 0, Primary Water Source Type: Surface water)
CENTRAL UTAH WCD - DUCHESNE VALLEY (Population served: 0, Primary Water Source Type: Surface water)
CENTRAL UTAH WCD - UTAH VALLEY (Population served: 0, Primary Water Source Type: Surface water)
Average household size: This city:
3.7 peopleUtah:
3.1 people
Percentage of family households: This city:
86.9%Whole state:
75.2%
Percentage of households with unmarried partners: This city:
2.3%Whole state:
4.6%
Likely homosexual households (counted as self-reported same-sex unmarried-partner households)
Lesbian couples: 0.2% of all households Gay men: 0.1% of all households
People in group quarters in Spanish Fork in 2010:
732 people in local jails and other municipal confinement facilities
54 people in residential treatment centers for juveniles (non-correctional)
27 people in nursing facilities/skilled-nursing facilities
10 people in residential treatment centers for adults
9 people in workers' group living quarters and job corps centers
People in group quarters in Spanish Fork in 2000:
357 people in local jails and other confinement facilities (including police lockups)
35 people in nursing homes
8 people in other noninstitutional group quarters
Banks with branches in Spanish Fork (2011 data):
Wells Fargo Bank, National Association: Fresh Market Spanish Fork Branch at 652 North 800 East, branch established on 1995/10/18; Spanish Fork Branch at 99 North Main Street, branch established on 1956/08/27. Info updated 2011/04/05: Bank assets: $1,161,490.0 mil, Deposits: $905,653.0 mil, headquarters in Sioux Falls, SD, positive income , 6395 total offices , Holding Company: Wells Fargo & Company
Zions First National Bank: Spanish Fork Branch at 190 North Main Street, branch established on 1968/09/03. Info updated 2006/11/03: Bank assets: $17,531.3 mil, Deposits: $14,905.3 mil, headquarters in Salt Lake City, UT, positive income , Commercial Lending Specialization, 151 total offices , Holding Company: Zions Bancorporation
Bank of American Fork: Spanish Fork Branch at 625 North Main, branch established on 1998/03/30. Info updated 2006/11/03: Bank assets: $890.2 mil, Deposits: $781.2 mil, headquarters in American Fork, UT, positive income , Commercial Lending Specialization, 13 total offices , Holding Company: People's Utah Bancorp
Central Bank: Spanish Fork Branch at One North Main Street, branch established on 1969/10/03. Info updated 2006/11/03: Bank assets: $662.1 mil, Deposits: $508.4 mil, headquarters in Springville, UT, positive income , Commercial Lending Specialization, 10 total offices , Holding Company: Central Bancorporation
JPMorgan Chase Bank, National Association: Spanish Fork Branch at 910 North Main Street, branch established on 1982/08/05. Info updated 2011/11/10: Bank assets: $1,811,678.0 mil, Deposits: $1,190,738.0 mil, headquarters in Columbus, OH, positive income , International Specialization, 5577 total offices , Holding Company: Jpmorgan Chase & Co.
For population 15 years and over in Spanish Fork:
Never married: 27.5%Now married: 62.7%Separated: 0.8%Widowed: 3.3%Divorced: 5.6% For population 25 years and over in Spanish Fork:
High school or higher: 94.2%Bachelor's degree or higher: 37.7%Graduate or professional degree: 12.4%Unemployed: 3.8%Mean travel time to work (commute): 16.5 minutes
Education Gini index (Inequality in education) Here:
9.5Utah average:
10.9
Religion statistics for Spanish Fork, UT (based on Utah County data)
Religion Adherents Congregations Other 459,847 1,303 Catholic 6,792 4 Evangelical Protestant 2,540 26 Mainline Protestant 423 6 Black Protestant 211 1 None 46,751 -
Source: Clifford Grammich, Kirk Hadaway, Richard Houseal, Dale E.Jones, Alexei Krindatch, Richie Stanley and Richard H.Taylor. 2012. 2010 U.S.Religion Census: Religious Congregations & Membership Study. Association of Statisticians of American Religious Bodies. Jones, Dale E., et al. 2002. Congregations and Membership in the United States 2000. Nashville, TN: Glenmary Research Center. Graphs represent county-level data
Food Environment Statistics: Number of grocery stores : 43This county :
0.84 / 10,000 pop.Utah :
1.37 / 10,000 pop.
Number of supercenters and club stores : 6This county :
0.12 / 10,000 pop.Utah :
0.18 / 10,000 pop.
Number of convenience stores (no gas) : 3Utah County :
0.06 / 10,000 pop.Utah :
0.41 / 10,000 pop.
Number of convenience stores (with gas) : 90Utah County :
1.75 / 10,000 pop.State :
2.82 / 10,000 pop.
Number of full-service restaurants : 146Here :
2.84 / 10,000 pop.State :
5.09 / 10,000 pop.
Adult obesity rate : Utah County :
24.5%Utah :
23.6%
Health and Nutrition: Healthy diet rate : Spanish Fork:
48.3%Utah:
48.9%
Average overall health of teeth and gums : This city:
45.8%Utah:
47.0%
People feeling badly about themselves : People not drinking alcohol at all : Average hours sleeping at night : Spanish Fork:
6.8State:
6.8
Overweight people : Spanish Fork:
31.2%Utah:
31.9%
General health condition : Spanish Fork:
57.7%Utah:
57.4%
Average condition of hearing : Spanish Fork:
80.6%State:
80.1%
More about Health and Nutrition of Spanish Fork, UT Residents
Spanish Fork government finances - Expenditure in 2021 (per resident):
Construction - Air Transportation: $49,991,000 ($1133.53)
Miscellaneous Commercial Activities - Other: $8,584,000 ($194.64)Natural Resources - Other: $8,389,000 ($190.22)Sewerage: $7,200,000 ($163.26)Electric Utilities: $4,391,000 ($99.56)Parks and Recreation: $2,897,000 ($65.69)Water Utilities: $2,571,000 ($58.30)General - Other: $1,082,000 ($24.53)Housing and Community Development: $773,000 ($17.53)Current Operations - Electric Utilities: $22,595,000 ($512.34)
Parks and Recreation: $6,679,000 ($151.44)Police Protection: $5,583,000 ($126.59)Health - Other: $3,329,000 ($75.48)Natural Resources - Other: $3,304,000 ($74.92)Water Utilities: $3,200,000 ($72.56)Solid Waste Management: $2,551,000 ($57.84)Central Staff Services: $2,528,000 ($57.32)General - Other: $2,461,000 ($55.80)Sewerage: $2,418,000 ($54.83)General Public Buildings: $960,000 ($21.77)Judicial and Legal Services: $866,000 ($19.64)Libraries: $833,000 ($18.89)Protective Inspection and Regulation - Other: $777,000 ($17.62)Miscellaneous Commercial Activities - Other: $502,000 ($11.38)Local Fire Protection: $465,000 ($10.54)Air Transportation: $253,000 ($5.74)Public Welfare - Other: $139,000 ($3.15)Regular Highways: $119,000 ($2.70)Housing and Community Development: $89,000 ($2.02)General - Interest on Debt: $535,000 ($12.13)
Intergovernmental to Local - Other - Parks and Recreation: $665,000 ($15.08)
Other Capital Outlay - Health - Other: $211,000 ($4.78)
Parks and Recreation: $156,000 ($3.54)Electric Utilities: $64,000 ($1.45)Air Transportation: $14,000 ($0.32)General - Other: $8,000 ($0.18)Water Utilities: $4,000 ($0.09)Police Protection: $3,000 ($0.07)Total Salaries and Wages: $44,214,000 ($1002.54)
Water Utilities - Interest on Debt: $27,000 ($0.61)
Spanish Fork government finances - Revenue in 2021 (per resident):
Charges - Other: $16,939,000 ($384.09)
Sewerage: $6,371,000 ($144.46)Parks and Recreation: $3,720,000 ($84.35)Solid Waste Management: $2,767,000 ($62.74)Miscellaneous Commercial Activities: $346,000 ($7.85)Air Transportation: $266,000 ($6.03)Housing and Community Development: $91,000 ($2.06)Federal Intergovernmental - Natural Resources: $3,478,000 ($78.86)
Other: $883,000 ($20.02)Local Intergovernmental - Other: $1,044,000 ($23.67)
Miscellaneous - General Revenue - Other: $35,308,000 ($800.60)
Special Assessments: $13,729,000 ($311.30)Sale of Property: $5,861,000 ($132.90)Interest Earnings: $2,314,000 ($52.47)Rents: $998,000 ($22.63)Fines and Forfeits: $427,000 ($9.68)Donations From Private Sources: $1,000 ($0.02)Revenue - Electric Utilities: $29,722,000 ($673.94)
Water Utilities: $8,458,000 ($191.78)State Intergovernmental - Other: $4,313,000 ($97.80)
Highways: $1,576,000 ($35.74)Water Utilities: $405,000 ($9.18)General Local Government Support: $100,000 ($2.27)Tax - General Sales and Gross Receipts: $24,639,000 ($558.68)
Other License: $3,983,000 ($90.31)Property: $3,719,000 ($84.33)Public Utilities Sales: $2,536,000 ($57.50)Other Selective Sales: $2,274,000 ($51.56)Occupation and Business License - Other: $81,000 ($1.84)
Spanish Fork government finances - Debt in 2021 (per resident):
Long Term Debt - Outstanding Unspecified Public Purpose: $114,857,000 ($2604.35)
Issue, Unspecified Public Purpose: $104,150,000 ($2361.57)Beginning Outstanding - Unspecified Public Purpose: $14,033,000 ($318.19)Retired Unspecified Public Purpose: $3,326,000 ($75.42)
Spanish Fork government finances - Cash and Securities in 2021 (per resident):
Bond Funds - Cash and Securities: $109,213,000 ($2476.37)
Other Funds - Cash and Securities: $46,148,000 ($1046.39)
8.12% of this county's 2021 resident taxpayers lived in other counties in 2020 ($71,824 average adjusted gross income )
Here:
8.12%Utah average:
7.95%
0.01% of residents moved from foreign countries ($102 average AGI )Utah County:
0.01%Utah average:
0.02%
Top counties from which taxpayers relocated into this county between 2020 and 2021:
7.26% of this county's 2020 resident taxpayers moved to other counties in 2021 ($74,329 average adjusted gross income )
Here:
7.26%Utah average:
7.39%
0.01% of residents moved to foreign countries ($122 average AGI )Utah County:
0.01%Utah average:
0.02%
Top counties to which taxpayers relocated from this county between 2020 and 2021:
Businesses in Spanish Fork, UT
Name Count Name Count
AT&T 2 KFC 1 Arby's 1 Kmart 1 AutoZone 1 Little Caesars Pizza 1 Big O Tires 1 MasterBrand Cabinets 5 Blockbuster 1 McDonald's 1 Burger King 1 Nike 1 Carl\s Jr. 1 Penske 1 Chevrolet 1 RadioShack 1 Cold Stone Creamery 1 SONIC Drive-In 1 Cricket Wireless 1 Sears 1 Curves 1 T-Mobile 1 Decora Cabinetry 3 Taco Bell 1 Domino's Pizza 1 U-Haul 1 FedEx 3 UPS 3 Ford 1 Verizon Wireless 1 H&R Block 1 Wendy's 1 Jimmy John's 1
Strongest AM radio stations in Spanish Fork:
KHQN (1480 AM; 1 kW; SPANISH FORK, UT; Owner: SACE BROADCASTING CORPORATION)
KOVO (960 AM; 5 kW; PROVO, UT; Owner: MILLCREEK BROADCASTING LLC)
KALL (700 AM; 50 kW; NORTH SALT LAKE CITY, UT; Owner: CITICASTERS LICENSES, L.P.)
KIQN (1010 AM; 50 kW; TOOELE, UT)
KSL (1160 AM; 50 kW; SALT LAKE CITY, UT; Owner: BONNEVILLE HOLDING COMPANY)
KEYY (1450 AM; 1 kW; PROVO, UT; Owner: BIBLICAL MINISTRIES WORLDWIDE)
KTKK (630 AM; 10 kW; SANDY, UT; Owner: UNITED BROADCASTING COMPANY)
KKDS (1060 AM; 10 kW; SOUTH SALT LAKE, UT; Owner: HOLIDAY BROADCASTING COMPANY)
KSRR (1400 AM; 1 kW; PROVO, UT; Owner: ROBERT MOREY)
KBEE (860 AM; 10 kW; SALT LAKE CITY, UT; Owner: CITADEL BROADCASTING COMPANY)
KLLB (1510 AM; daytime; 10 kW; WEST JORDAN, UT; Owner: UNITED SECURITY FINANCIAL, INC.)
KMTI (650 AM; 10 kW; MANTI, UT; Owner: SANPETE COUNTY BROADCASTING COMPANY)
KWDZ (910 AM; 5 kW; SALT LAKE CITY, UT; Owner: ABC, INC.)
Strongest FM radio stations in Spanish Fork:
KTCE (92.3 FM; PAYSON, UT; Owner: MOENKOPI COMMUNICATIONS, INC.)
K264AC (100.7 FM; RURAL UTAH COUNTY, UT; Owner: SIMMONS-SLC, LS, LLC)
K208BZ (89.5 FM; SPANISH FORK, UT; Owner: BRIGHAM YOUNG UNIVERSITY)
KQMB (102.7 FM; MIDVALE, UT; Owner: SIMMONS-SLC, LS, LLC)
KXRK (96.3 FM; PROVO, UT; Owner: SIMMONS-SLC, LS, LLC)
KENZ (107.5 FM; OREM, UT; Owner: CITADEL BROADCASTING COMPANY)
KZHT (94.9 FM; PROVO, UT; Owner: CITICASTERS LICENSES, L.P.)
K217CL (91.3 FM; PROVO, UT; Owner: STOCKTON CHRISTIAN LIFE COLLEGE, INC)
KMXU (105.1 FM; MANTI, UT; Owner: MILLCREEK BROADCASTING, LLC)
KSOP-FM (104.3 FM; SALT LAKE CITY, UT; Owner: KSOP, INC.)
K272DP (102.3 FM; TOOELE, UT; Owner: FAMILY STATIONS, INC.)
KRCL (90.9 FM; SALT LAKE CITY, UT; Owner: LISTENERS COMMUNITY RADIO OF UTAH)
KBZN (97.9 FM; OGDEN, UT; Owner: CAPITOL BROADCASTING, INC.)
KOSY-FM (106.5 FM; SPANISH FORK, UT; Owner: MERCURY BROADCASTING COMPANY, INC.)
KRSP-FM (103.5 FM; SALT LAKE CITY, UT; Owner: SIMMONS-SLC, LS, LLC)
KBER (101.1 FM; OGDEN, UT; Owner: CITADEL BROADCASTING COMPANY)
KISN-FM (97.1 FM; SALT LAKE CITY, UT; Owner: CLEAR CHANNEL BROADCASTING LICENSES, INC.)
KKAT (101.9 FM; OGDEN, UT; Owner: CITICASTERS LICENSES, L.P.)
KSFI (100.3 FM; SALT LAKE CITY, UT; Owner: SIMMONS-SLC, LS, LLC)
KUBL-FM (93.3 FM; SALT LAKE CITY, UT; Owner: CITADEL BROADCASTING COMPANY)
TV broadcast stations around Spanish Fork:
KUPX (Channel 16; PROVO, UT; Owner: PAXSON SALT LAKE CITY LICENSE, INC.)
KUTV (Channel 2; SALT LAKE CITY, UT; Owner: KUTV HOLDINGS, INC.)
K34DW (Channel 34; PROVO, UT; Owner: THREE ANGELS BROADCASTING NETWORK)
National Bridge Inventory (NBI) Statistics 43 Number of bridges367ft / 112m Total length1,633,711 Total average daily traffic374,510 Total average daily truck traffic
New bridges - historical statistics
1 1950-1959 6 1960-1969 4 1970-1979 2 1980-1989 2 2000-2009 27 2010-2019 1 2020-2022
See full National Bridge Inventory statistics for Spanish Fork, UT
Home Mortgage Disclosure Act Aggregated Statistics For Year 2009(Based on 2 full and 4 partial tracts) A) FHA, FSA/RHS & VA B) Conventional C) Refinancings D) Home Improvement Loans F) Non-occupant Loans on G) Loans On Manufactured Number Average Value Number Average Value Number Average Value Number Average Value Number Average Value Number Average Value
LOANS ORIGINATED 200 $180,439 83 $169,736 809 $172,304 17 $76,566 31 $145,665 2 $180,750 APPLICATIONS APPROVED, NOT ACCEPTED 12 $205,886 6 $211,005 91 $192,145 5 $119,330 1 $253,270 0 $0 APPLICATIONS DENIED 31 $184,147 14 $220,870 218 $189,545 8 $81,676 15 $148,824 1 $121,760 APPLICATIONS WITHDRAWN 21 $205,849 6 $191,480 144 $183,860 9 $138,253 3 $214,243 0 $0 FILES CLOSED FOR INCOMPLETENESS 2 $217,430 2 $167,060 30 $194,806 0 $0 2 $83,870 0 $0
Aggregated Statistics For Year 2008(Based on 2 full and 4 partial tracts) A) FHA, FSA/RHS & VA B) Conventional C) Refinancings D) Home Improvement Loans E) Loans on Dwellings For 5+ Families F) Non-occupant Loans on G) Loans On Manufactured Number Average Value Number Average Value Number Average Value Number Average Value Number Average Value Number Average Value Number Average Value
LOANS ORIGINATED 148 $183,953 168 $189,367 551 $184,470 34 $55,030 4 $179,525 48 $149,943 1 $166,730 APPLICATIONS APPROVED, NOT ACCEPTED 2 $173,400 16 $201,226 94 $188,852 7 $103,943 0 $0 10 $170,911 0 $0 APPLICATIONS DENIED 22 $173,195 43 $231,037 252 $202,570 37 $56,561 1 $215,290 25 $198,978 5 $96,356 APPLICATIONS WITHDRAWN 21 $197,509 15 $193,863 94 $199,197 7 $114,700 0 $0 11 $157,617 0 $0 FILES CLOSED FOR INCOMPLETENESS 1 $253,320 5 $256,406 17 $218,974 3 $85,653 0 $0 0 $0 0 $0
Aggregated Statistics For Year 2007(Based on 2 full and 4 partial tracts) A) FHA, FSA/RHS & VA B) Conventional C) Refinancings D) Home Improvement Loans E) Loans on Dwellings For 5+ Families F) Non-occupant Loans on G) Loans On Manufactured Number Average Value Number Average Value Number Average Value Number Average Value Number Average Value Number Average Value Number Average Value
LOANS ORIGINATED 66 $168,269 519 $165,734 646 $165,368 58 $88,781 4 $208,692 107 $151,457 2 $100,065 APPLICATIONS APPROVED, NOT ACCEPTED 3 $215,010 75 $156,781 114 $169,918 18 $103,332 0 $0 12 $180,866 0 $0 APPLICATIONS DENIED 13 $178,268 160 $185,742 304 $183,177 50 $87,168 2 $124,000 58 $238,782 3 $52,443 APPLICATIONS WITHDRAWN 13 $167,742 61 $208,001 121 $177,541 8 $98,521 1 $143,000 10 $237,719 0 $0 FILES CLOSED FOR INCOMPLETENESS 0 $0 11 $143,206 35 $163,744 0 $0 0 $0 2 $136,560 0 $0
Aggregated Statistics For Year 2006(Based on 2 full and 4 partial tracts) A) FHA, FSA/RHS & VA B) Conventional C) Refinancings D) Home Improvement Loans E) Loans on Dwellings For 5+ Families F) Non-occupant Loans on G) Loans On Manufactured Number Average Value Number Average Value Number Average Value Number Average Value Number Average Value Number Average Value Number Average Value
LOANS ORIGINATED 99 $138,627 826 $124,311 535 $134,946 47 $56,159 0 $0 155 $117,233 2 $47,390 APPLICATIONS APPROVED, NOT ACCEPTED 4 $163,938 103 $115,199 105 $125,023 7 $83,750 0 $0 17 $133,051 0 $0 APPLICATIONS DENIED 4 $159,982 199 $132,056 266 $131,852 35 $69,846 2 $639,500 31 $173,733 4 $113,632 APPLICATIONS WITHDRAWN 7 $146,611 91 $124,795 126 $153,063 10 $81,233 0 $0 18 $122,251 0 $0 FILES CLOSED FOR INCOMPLETENESS 1 $83,870 22 $143,925 49 $141,024 1 $64,070 0 $0 3 $124,647 0 $0
Aggregated Statistics For Year 2005(Based on 2 full and 4 partial tracts) A) FHA, FSA/RHS & VA B) Conventional C) Refinancings D) Home Improvement Loans F) Non-occupant Loans on G) Loans On Manufactured Number Average Value Number Average Value Number Average Value Number Average Value Number Average Value Number Average Value
LOANS ORIGINATED 114 $130,769 652 $104,149 450 $125,977 32 $50,762 112 $113,307 0 $0 APPLICATIONS APPROVED, NOT ACCEPTED 8 $139,756 90 $106,846 90 $127,372 8 $93,584 20 $127,268 1 $25,000 APPLICATIONS DENIED 14 $118,417 143 $112,126 276 $132,781 51 $54,119 50 $130,044 7 $63,541 APPLICATIONS WITHDRAWN 9 $139,108 88 $105,466 125 $117,863 15 $127,657 26 $108,177 0 $0 FILES CLOSED FOR INCOMPLETENESS 2 $125,125 32 $100,817 72 $149,918 1 $4,030 2 $136,380 0 $0
Aggregated Statistics For Year 2004(Based on 2 full and 4 partial tracts) A) FHA, FSA/RHS & VA B) Conventional C) Refinancings D) Home Improvement Loans E) Loans on Dwellings For 5+ Families F) Non-occupant Loans on G) Loans On Manufactured Number Average Value Number Average Value Number Average Value Number Average Value Number Average Value Number Average Value Number Average Value
LOANS ORIGINATED 100 $124,687 399 $104,217 563 $124,852 27 $39,690 1 $1,140,000 93 $105,258 1 $58,920 APPLICATIONS APPROVED, NOT ACCEPTED 9 $131,639 56 $119,897 128 $118,412 6 $51,758 0 $0 15 $101,194 0 $0 APPLICATIONS DENIED 13 $120,454 121 $106,130 285 $138,319 36 $39,457 0 $0 34 $120,286 4 $69,498 APPLICATIONS WITHDRAWN 16 $126,820 38 $118,970 167 $139,554 9 $60,190 1 $195,000 19 $110,409 0 $0 FILES CLOSED FOR INCOMPLETENESS 3 $144,140 13 $136,214 62 $154,708 1 $52,820 0 $0 3 $112,470 0 $0
Aggregated Statistics For Year 2003(Based on 2 full and 4 partial tracts) A) FHA, FSA/RHS & VA B) Conventional C) Refinancings D) Home Improvement Loans E) Loans on Dwellings For 5+ Families F) Non-occupant Loans on Number Average Value Number Average Value Number Average Value Number Average Value Number Average Value Number Average Value
LOANS ORIGINATED 140 $131,489 293 $115,993 1,387 $124,799 16 $31,629 0 $0 107 $109,659 APPLICATIONS APPROVED, NOT ACCEPTED 5 $126,218 40 $123,692 165 $133,105 3 $8,233 0 $0 14 $125,189 APPLICATIONS DENIED 8 $146,071 53 $118,800 286 $126,824 28 $27,350 1 $464,450 20 $103,849 APPLICATIONS WITHDRAWN 12 $125,512 26 $121,961 172 $132,251 6 $37,013 0 $0 6 $122,047 FILES CLOSED FOR INCOMPLETENESS 3 $114,963 7 $95,246 61 $151,793 0 $0 0 $0 4 $145,520
Aggregated Statistics For Year 2002(Based on 2 partial tracts) A) FHA, FSA/RHS & VA B) Conventional C) Refinancings D) Home Improvement Loans F) Non-occupant Loans on Number Average Value Number Average Value Number Average Value Number Average Value Number Average Value
LOANS ORIGINATED 18 $120,135 43 $131,460 220 $134,574 5 $53,684 16 $107,428 APPLICATIONS APPROVED, NOT ACCEPTED 0 $0 4 $185,162 28 $143,116 0 $0 0 $0 APPLICATIONS DENIED 2 $113,065 11 $101,325 49 $130,726 3 $20,870 2 $128,055 APPLICATIONS WITHDRAWN 1 $128,370 3 $137,460 44 $129,375 1 $25,200 1 $102,070 FILES CLOSED FOR INCOMPLETENESS 0 $0 3 $154,800 7 $179,511 0 $0 1 $137,610
Aggregated Statistics For Year 2001(Based on 2 partial tracts) A) FHA, FSA/RHS & VA B) Conventional C) Refinancings D) Home Improvement Loans F) Non-occupant Loans on Number Average Value Number Average Value Number Average Value Number Average Value Number Average Value
LOANS ORIGINATED 35 $128,937 39 $124,802 154 $128,999 8 $33,138 16 $114,364 APPLICATIONS APPROVED, NOT ACCEPTED 2 $100,740 6 $138,632 19 $133,707 0 $0 0 $0 APPLICATIONS DENIED 2 $137,745 13 $102,069 54 $135,544 7 $18,854 1 $160,910 APPLICATIONS WITHDRAWN 2 $94,650 3 $115,447 43 $134,783 2 $54,110 1 $123,330 FILES CLOSED FOR INCOMPLETENESS 0 $0 2 $117,660 15 $166,314 0 $0 0 $0
Aggregated Statistics For Year 2000(Based on 2 partial tracts) A) FHA, FSA/RHS & VA B) Conventional C) Refinancings D) Home Improvement Loans F) Non-occupant Loans on Number Average Value Number Average Value Number Average Value Number Average Value Number Average Value
LOANS ORIGINATED 32 $118,816 37 $124,978 36 $119,174 4 $22,392 5 $119,568 APPLICATIONS APPROVED, NOT ACCEPTED 1 $76,560 4 $108,120 9 $99,648 1 $15,710 0 $0 APPLICATIONS DENIED 5 $107,780 7 $128,334 27 $137,607 6 $28,078 2 $166,220 APPLICATIONS WITHDRAWN 5 $117,856 9 $116,193 18 $117,108 1 $18,920 0 $0 FILES CLOSED FOR INCOMPLETENESS 0 $0 0 $0 7 $127,744 0 $0 0 $0
Aggregated Statistics For Year 1999(Based on 3 partial tracts) A) FHA, FSA/RHS & VA B) Conventional C) Refinancings D) Home Improvement Loans E) Loans on Dwellings For 5+ Families F) Non-occupant Loans on Number Average Value Number Average Value Number Average Value Number Average Value Number Average Value Number Average Value
LOANS ORIGINATED 81 $117,241 200 $112,986 467 $100,439 33 $30,352 3 $115,603 39 $94,433 APPLICATIONS APPROVED, NOT ACCEPTED 3 $119,057 26 $107,496 85 $110,619 8 $14,264 0 $0 5 $77,062 APPLICATIONS DENIED 14 $116,104 70 $88,787 164 $104,517 17 $22,990 0 $0 6 $92,810 APPLICATIONS WITHDRAWN 7 $103,189 41 $124,861 94 $112,753 8 $63,084 0 $0 5 $82,886 FILES CLOSED FOR INCOMPLETENESS 1 $129,540 12 $98,751 72 $110,495 0 $0 0 $0 2 $88,095
Detailed HMDA statistics for the following Tracts:
0032.01
, 0032.02 , 0032.03 , 0033.00 , 0103.01 , 0104.01
Private Mortgage Insurance Companies Aggregated Statistics For Year 2009(Based on 2 full and 4 partial tracts) A) Conventional B) Refinancings C) Non-occupant Loans on Number Average Value Number Average Value Number Average Value
LOANS ORIGINATED 20 $200,584 29 $204,374 0 $0 APPLICATIONS APPROVED, NOT ACCEPTED 15 $196,575 21 $208,677 4 $186,172 APPLICATIONS DENIED 5 $213,592 6 $229,585 0 $0 APPLICATIONS WITHDRAWN 1 $144,260 1 $314,320 0 $0 FILES CLOSED FOR INCOMPLETENESS 2 $167,080 0 $0 0 $0
Aggregated Statistics For Year 2008(Based on 2 full and 4 partial tracts) A) Conventional B) Refinancings C) Non-occupant Loans on Number Average Value Number Average Value Number Average Value
LOANS ORIGINATED 87 $211,196 60 $219,607 8 $184,502 APPLICATIONS APPROVED, NOT ACCEPTED 33 $226,589 29 $234,263 3 $188,177 APPLICATIONS DENIED 8 $205,128 4 $219,450 5 $177,398 APPLICATIONS WITHDRAWN 3 $193,170 1 $322,870 0 $0 FILES CLOSED FOR INCOMPLETENESS 3 $224,233 0 $0 2 $321,840
Aggregated Statistics For Year 2007(Based on 2 full and 4 partial tracts) A) Conventional B) Refinancings C) Non-occupant Loans on Number Average Value Number Average Value Number Average Value
LOANS ORIGINATED 174 $202,868 69 $206,937 18 $197,833 APPLICATIONS APPROVED, NOT ACCEPTED 15 $224,711 15 $212,633 2 $271,485 APPLICATIONS DENIED 5 $236,040 4 $230,468 1 $501,400 APPLICATIONS WITHDRAWN 8 $203,260 5 $225,668 2 $172,220 FILES CLOSED FOR INCOMPLETENESS 0 $0 0 $0 0 $0
Aggregated Statistics For Year 2006(Based on 2 full and 4 partial tracts) A) Conventional B) Refinancings C) Non-occupant Loans on Number Average Value Number Average Value Number Average Value
LOANS ORIGINATED 80 $166,317 30 $173,660 8 $185,374 APPLICATIONS APPROVED, NOT ACCEPTED 7 $141,566 3 $173,653 0 $0 APPLICATIONS DENIED 1 $130,000 0 $0 0 $0 APPLICATIONS WITHDRAWN 3 $174,060 3 $195,017 0 $0 FILES CLOSED FOR INCOMPLETENESS 2 $169,020 0 $0 0 $0
Aggregated Statistics For Year 2005(Based on 2 full and 4 partial tracts) A) Conventional B) Refinancings C) Non-occupant Loans on Number Average Value Number Average Value Number Average Value
LOANS ORIGINATED 35 $153,833 39 $156,483 7 $122,716 APPLICATIONS APPROVED, NOT ACCEPTED 4 $133,278 13 $160,862 4 $126,108 APPLICATIONS DENIED 1 $100,000 0 $0 0 $0 APPLICATIONS WITHDRAWN 2 $113,625 3 $191,980 1 $54,000 FILES CLOSED FOR INCOMPLETENESS 0 $0 0 $0 0 $0
Aggregated Statistics For Year 2004(Based on 2 full and 4 partial tracts) A) Conventional B) Refinancings C) Non-occupant Loans on Number Average Value Number Average Value Number Average Value
LOANS ORIGINATED 53 $138,852 60 $154,001 16 $113,239 APPLICATIONS APPROVED, NOT ACCEPTED 5 $145,568 19 $156,122 2 $120,410 APPLICATIONS DENIED 1 $76,560 1 $228,500 1 $76,560 APPLICATIONS WITHDRAWN 2 $180,605 11 $148,655 2 $122,445 FILES CLOSED FOR INCOMPLETENESS 1 $142,000 0 $0 1 $142,000
Aggregated Statistics For Year 2003(Based on 2 full and 4 partial tracts) A) Conventional B) Refinancings C) Non-occupant Loans on Number Average Value Number Average Value Number Average Value
LOANS ORIGINATED 61 $137,678 188 $140,256 7 $126,526 APPLICATIONS APPROVED, NOT ACCEPTED 8 $162,551 48 $143,004 1 $88,320 APPLICATIONS DENIED 3 $128,777 4 $141,872 0 $0 APPLICATIONS WITHDRAWN 4 $136,325 11 $153,192 0 $0 FILES CLOSED FOR INCOMPLETENESS 0 $0 3 $111,270 1 $83,810
Aggregated Statistics For Year 2002(Based on 2 partial tracts) A) Conventional B) Refinancings C) Non-occupant Loans on Number Average Value Number Average Value Number Average Value
LOANS ORIGINATED 12 $149,129 36 $140,941 4 $143,475 APPLICATIONS APPROVED, NOT ACCEPTED 2 $130,520 11 $139,375 0 $0 APPLICATIONS DENIED 0 $0 0 $0 0 $0 APPLICATIONS WITHDRAWN 2 $136,465 2 $168,040 0 $0 FILES CLOSED FOR INCOMPLETENESS 0 $0 0 $0 0 $0
Aggregated Statistics For Year 2001(Based on 2 partial tracts) A) Conventional B) Refinancings C) Non-occupant Loans on Number Average Value Number Average Value Number Average Value
LOANS ORIGINATED 17 $133,011 37 $141,526 1 $83,810 APPLICATIONS APPROVED, NOT ACCEPTED 5 $134,474 5 $147,406 2 $83,910 APPLICATIONS DENIED 0 $0 1 $111,120 0 $0 APPLICATIONS WITHDRAWN 0 $0 2 $111,825 1 $105,570 FILES CLOSED FOR INCOMPLETENESS 0 $0 0 $0 0 $0
Aggregated Statistics For Year 2000(Based on 2 partial tracts) A) Conventional B) Refinancings Number Average Value Number Average Value
LOANS ORIGINATED 15 $145,962 6 $127,925 APPLICATIONS APPROVED, NOT ACCEPTED 0 $0 1 $120,300 APPLICATIONS DENIED 0 $0 0 $0 APPLICATIONS WITHDRAWN 1 $84,620 0 $0 FILES CLOSED FOR INCOMPLETENESS 0 $0 0 $0
Aggregated Statistics For Year 1999(Based on 3 partial tracts) A) Conventional B) Refinancings C) Non-occupant Loans on Number Average Value Number Average Value Number Average Value
LOANS ORIGINATED 72 $123,564 104 $131,857 1 $91,800 APPLICATIONS APPROVED, NOT ACCEPTED 5 $142,442 21 $119,626 1 $66,770 APPLICATIONS DENIED 8 $131,132 7 $150,733 1 $91,800 APPLICATIONS WITHDRAWN 1 $125,810 8 $126,648 0 $0 FILES CLOSED FOR INCOMPLETENESS 2 $81,140 2 $128,895 0 $0
Detailed PMIC statistics for the following Tracts:
0032.01
, 0032.02 , 0032.03 , 0033.00 , 0103.01 , 0104.01 Spanish Fork compared to Utah state average:
Unemployed percentage significantly below state average. Hispanic race population percentage above state average. Median age below state average. Length of stay since moving in significantly above state average. Institutionalized population percentage above state average. Percentage of population with a bachelor's degree or higher above state average. Spanish Fork on our top lists :
#81 on the list of "Top 101 cities with the most residents born in Argentina (population 500+)"
#88 on the list of "Top 101 cities with the lowest number of police officers per 1000 residents (population 5,000+)"
#88 on the list of "Top 101 cities with the highest percentage of family households, population 10,000+"
#26 (84660) on the list of "Top 101 zip codes with the largest percentage of English first ancestries (pop 5,000+)"
#31 (84660) on the list of "Top 101 zip codes with the largest percentage of Danish first ancestries (pop 5,000+)"
#44 (84660) on the list of "Top 101 zip codes with the largest charity contributions deductions as a percentage of AGI in 2012 (pop 5,000+)"
#1 on the list of "Top 101 counties with the lowest percentage of residents that smoked 100+ cigarettes in their lives"
#1 on the list of "Top 101 counties with highest percentage of residents voting for Romney (Republican) in the 2012 Presidential Election (pop. 50,000+)"
#1 on the list of "Top 101 counties with the highest number of births per 1000 residents 2007-2013"
#2 on the list of "Top 101 counties with the most Other adherents"
#2 on the list of "Top 101 counties with the most Other congregations"
Top Patent Applicants
Stephen R. Carter (129)
David B. Jackson (47)
Jerome Miles (36)
David Brian Jackson (33)
Jeff Jepson (31)
Joe Fox (23)
Tyson J. Wilde (22)
David Wahlquist (19)
Douglas P. Hansen (17)
Brent Thurgood (16)
Total of 703 patent applications in 2008-2024.
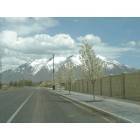
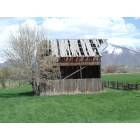
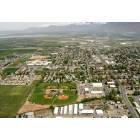

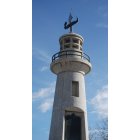
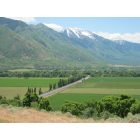
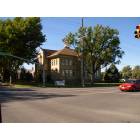
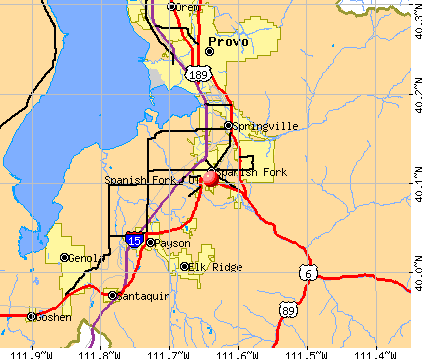


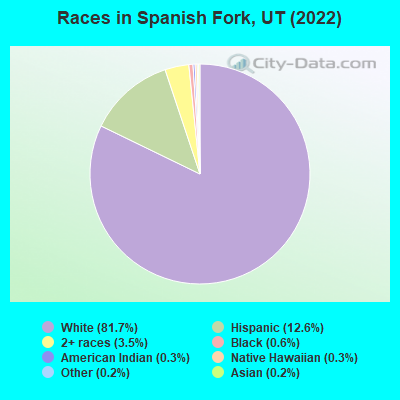
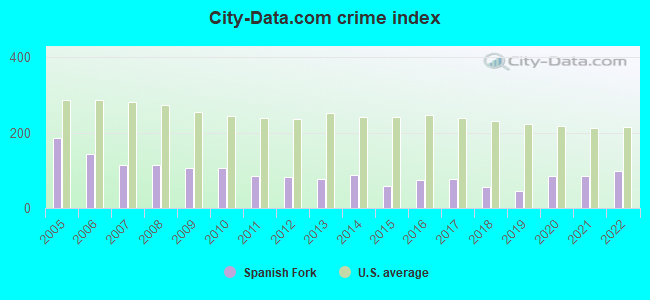
 Recent articles from our blog. Our writers, many of them Ph.D. graduates or candidates, create easy-to-read articles on a wide variety of topics.

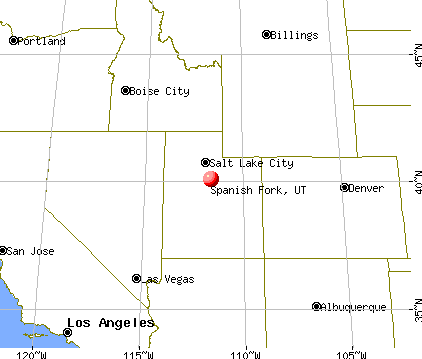
 (9.7 miles
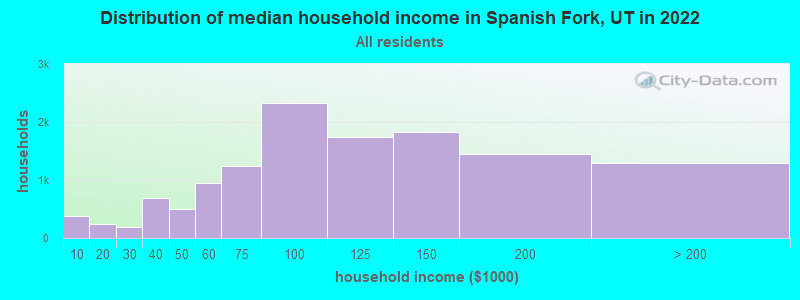

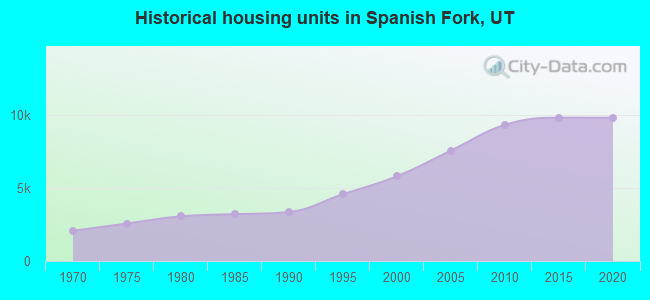
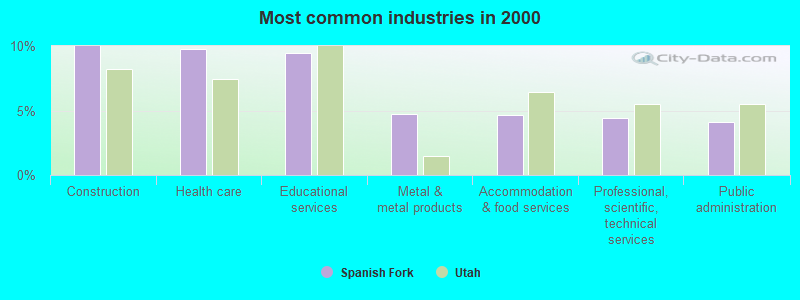
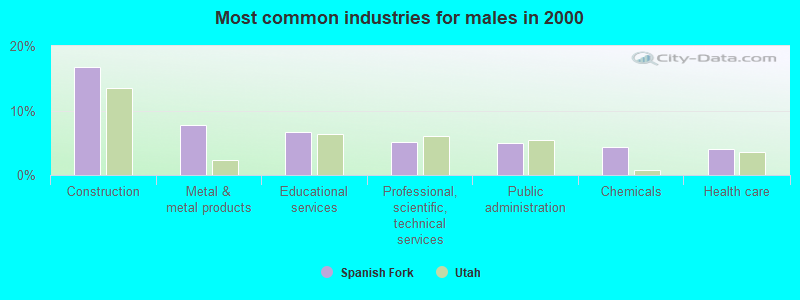
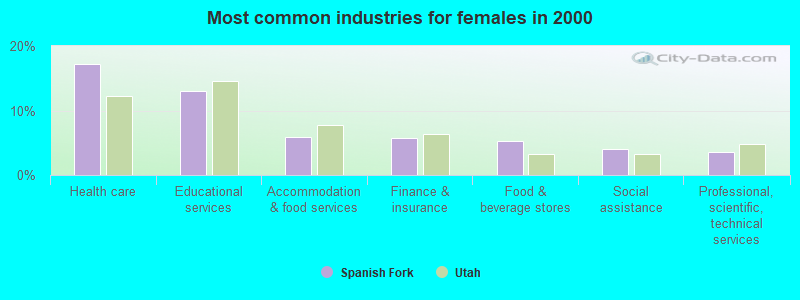
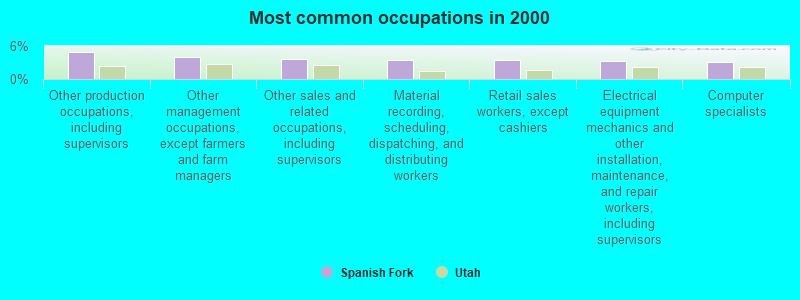
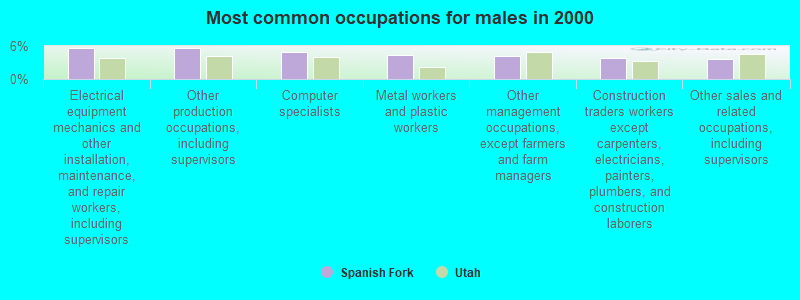
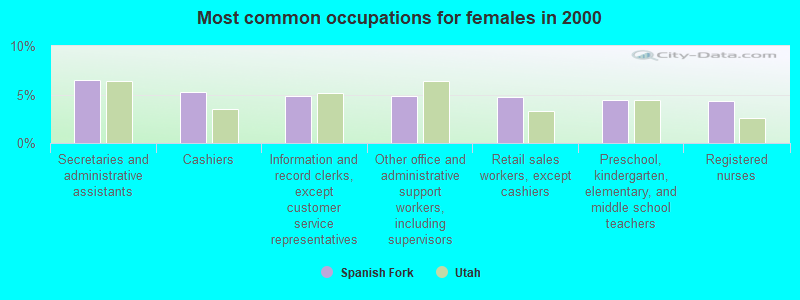


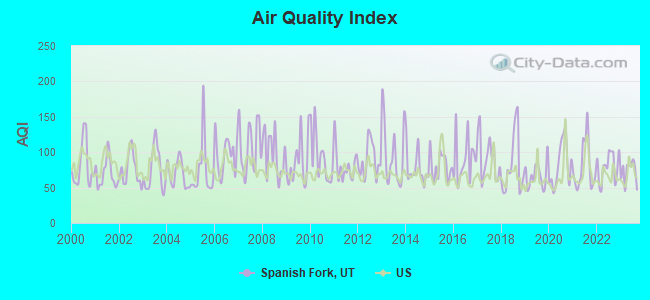
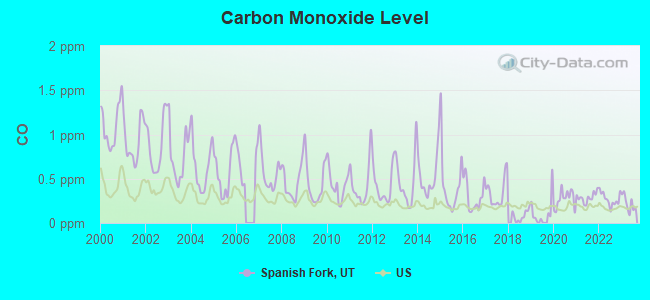
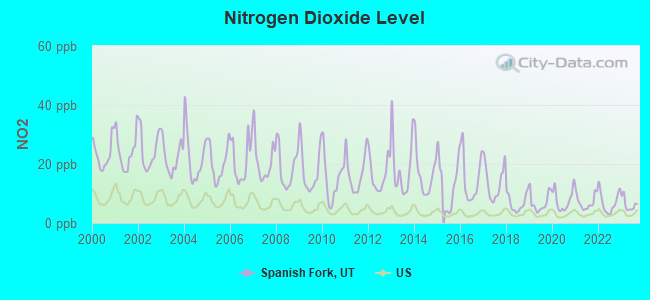
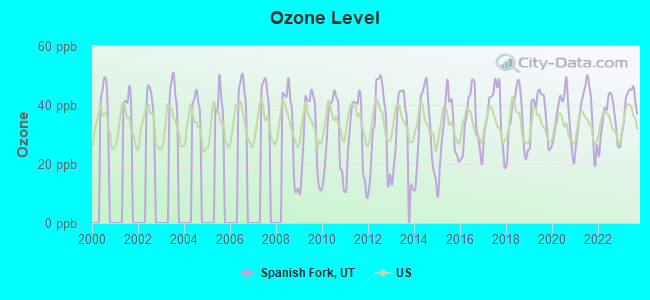
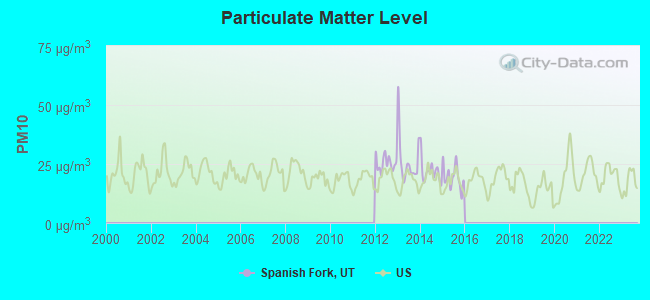
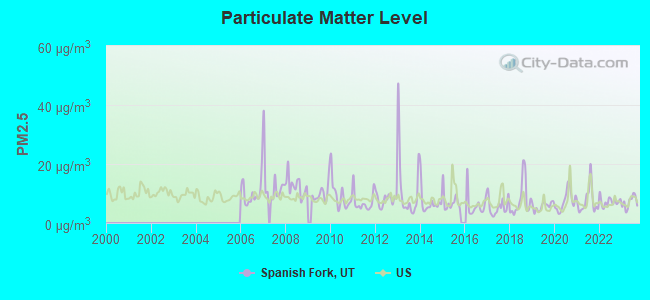

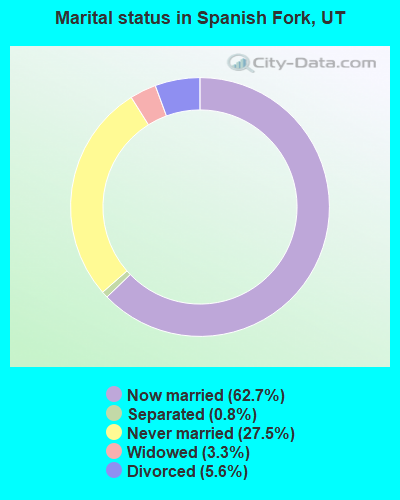
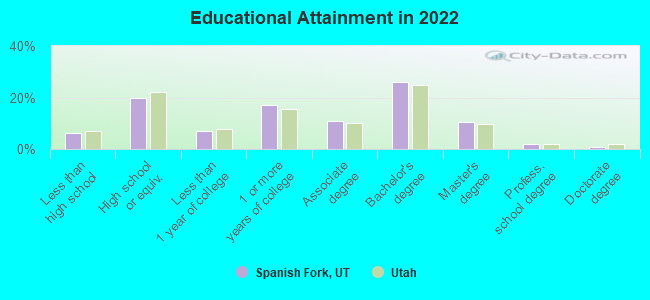
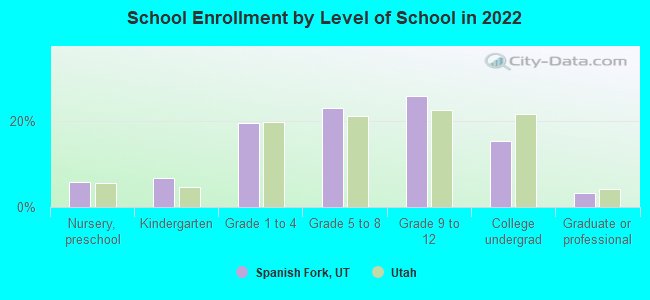
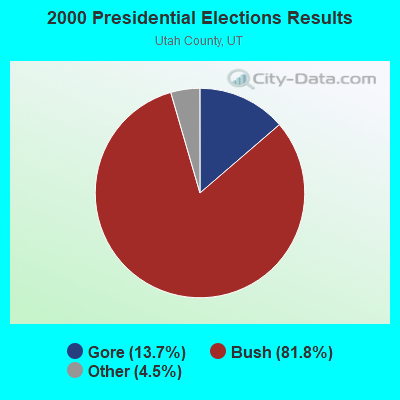
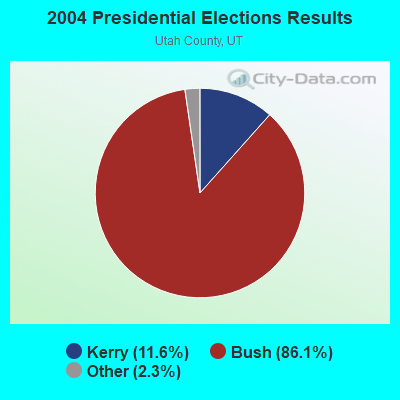
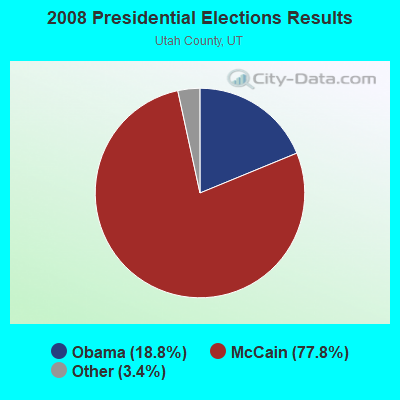
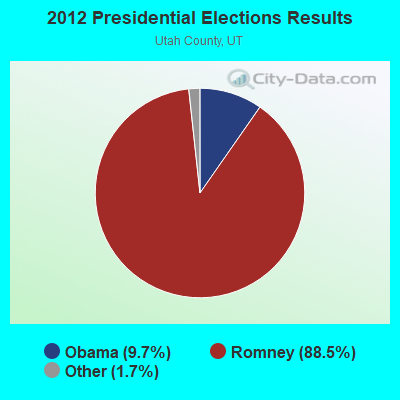
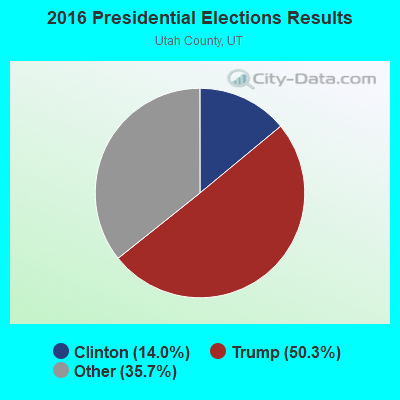
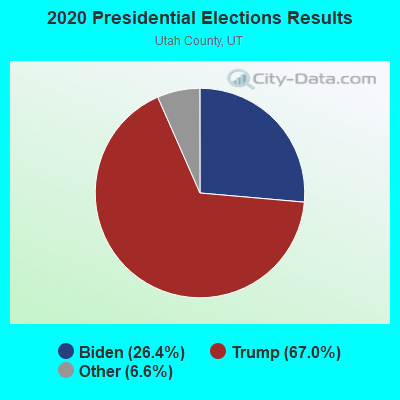
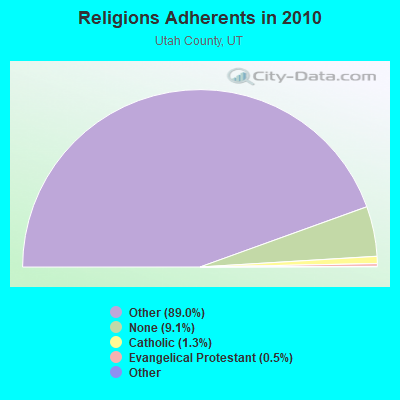
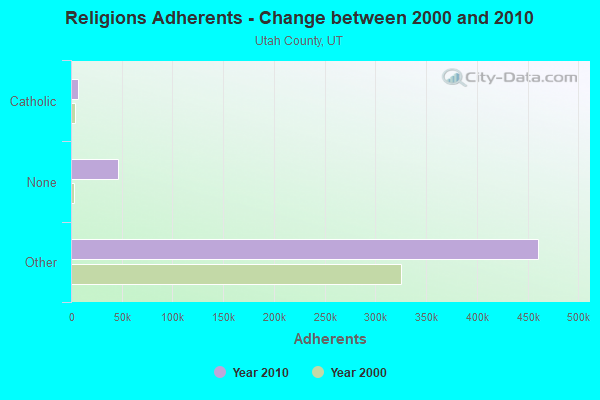
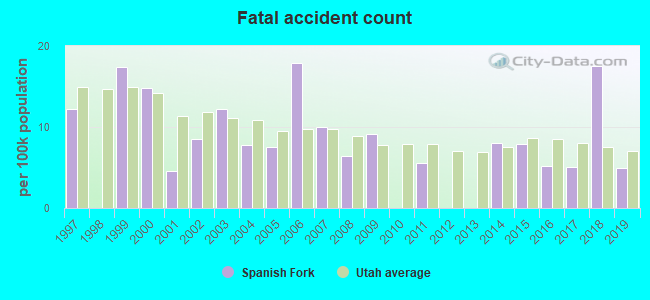
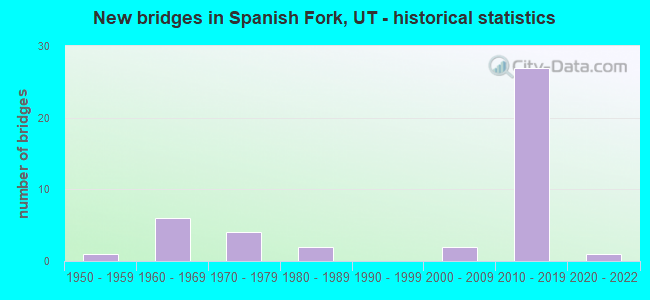
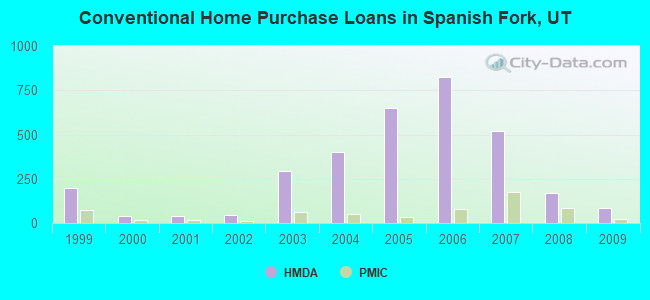
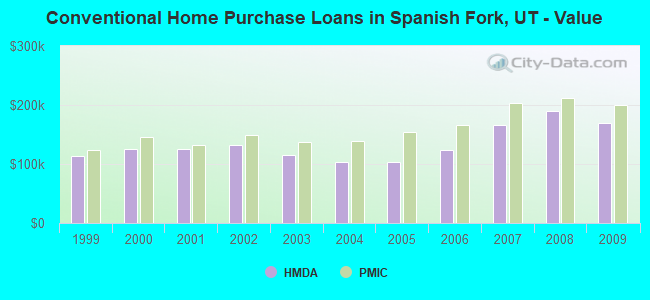
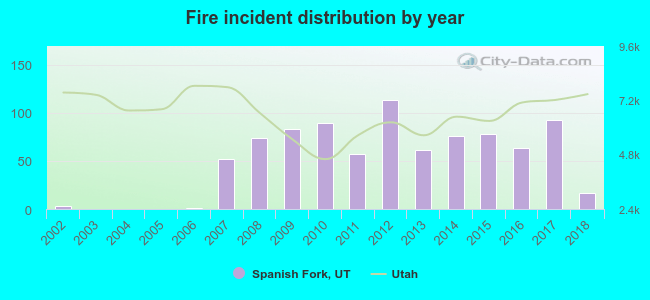 According to the data from the years 2002 - 2018 the average number of fires per year is 51. The highest number of fire incidents - 113 took place in 2012, and the least - 0 in 2003. The data has an increasing trend.
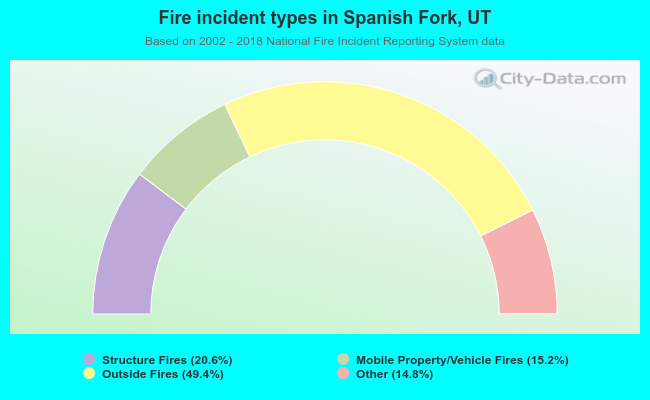 When looking into fire subcategories, the most incidents belonged to: Outside Fires (49.4%), and Structure Fires (20.6%).