Paramount, California Submit your own pictures of this city and show them to the world
OSM Map
General Map
Google Map
MSN Map
OSM Map
General Map
Google Map
MSN Map
OSM Map
General Map
Google Map
MSN Map
OSM Map
General Map
Google Map
MSN Map
Please wait while loading the map...
Population in 2022: 51,653 (100% urban, 0% rural). Population change since 2000: -6.5%Males: 25,720 Females: 25,933
March 2022 cost of living index in Paramount: 137.3 (high, U.S. average is 100) Percentage of residents living in poverty in 2022: 13.4%for White Non-Hispanic residents , 13.0% for Black residents , 13.5% for Hispanic or Latino residents , 7.8% for American Indian residents , 60.5% for Native Hawaiian and other Pacific Islander residents , 14.8% for other race residents , 11.6% for two or more races residents )
Profiles of local businesses
Business Search - 14 Million verified businesses
Data:
Median household income ($)
Median household income (% change since 2000)
Household income diversity
Ratio of average income to average house value (%)
Ratio of average income to average rent
Median household income ($) - White
Median household income ($) - Black or African American
Median household income ($) - Asian
Median household income ($) - Hispanic or Latino
Median household income ($) - American Indian and Alaska Native
Median household income ($) - Multirace
Median household income ($) - Other Race
Median household income for houses/condos with a mortgage ($)
Median household income for apartments without a mortgage ($)
Races - White alone (%)
Races - White alone (% change since 2000)
Races - Black alone (%)
Races - Black alone (% change since 2000)
Races - American Indian alone (%)
Races - American Indian alone (% change since 2000)
Races - Asian alone (%)
Races - Asian alone (% change since 2000)
Races - Hispanic (%)
Races - Hispanic (% change since 2000)
Races - Native Hawaiian and Other Pacific Islander alone (%)
Races - Native Hawaiian and Other Pacific Islander alone (% change since 2000)
Races - Two or more races (%)
Races - Two or more races (% change since 2000)
Races - Other race alone (%)
Races - Other race alone (% change since 2000)
Racial diversity
Unemployment (%)
Unemployment (% change since 2000)
Unemployment (%) - White
Unemployment (%) - Black or African American
Unemployment (%) - Asian
Unemployment (%) - Hispanic or Latino
Unemployment (%) - American Indian and Alaska Native
Unemployment (%) - Multirace
Unemployment (%) - Other Race
Population density (people per square mile)
Population - Males (%)
Population - Females (%)
Population - Males (%) - White
Population - Males (%) - Black or African American
Population - Males (%) - Asian
Population - Males (%) - Hispanic or Latino
Population - Males (%) - American Indian and Alaska Native
Population - Males (%) - Multirace
Population - Males (%) - Other Race
Population - Females (%) - White
Population - Females (%) - Black or African American
Population - Females (%) - Asian
Population - Females (%) - Hispanic or Latino
Population - Females (%) - American Indian and Alaska Native
Population - Females (%) - Multirace
Population - Females (%) - Other Race
Coronavirus confirmed cases (Jun 09, 2024)
Deaths caused by coronavirus (Jun 09, 2024)
Coronavirus confirmed cases (per 100k population) (Jun 09, 2024)
Deaths caused by coronavirus (per 100k population) (Jun 09, 2024)
Daily increase in number of cases (Jun 09, 2024)
Weekly increase in number of cases (Jun 09, 2024)
Cases doubled (in days) (Jun 09, 2024)
Hospitalized patients (Apr 18, 2022)
Negative test results (Apr 18, 2022)
Total test results (Apr 18, 2022)
COVID Vaccine doses distributed (per 100k population) (Sep 19, 2023)
COVID Vaccine doses administered (per 100k population) (Sep 19, 2023)
COVID Vaccine doses distributed (Sep 19, 2023)
COVID Vaccine doses administered (Sep 19, 2023)
Likely homosexual households (%)
Likely homosexual households (% change since 2000)
Likely homosexual households - Lesbian couples (%)
Likely homosexual households - Lesbian couples (% change since 2000)
Likely homosexual households - Gay men (%)
Likely homosexual households - Gay men (% change since 2000)
Cost of living index
Median gross rent ($)
Median contract rent ($)
Median monthly housing costs ($)
Median house or condo value ($)
Median house or condo value ($ change since 2000)
Mean house or condo value by units in structure - 1, detached ($)
Mean house or condo value by units in structure - 1, attached ($)
Mean house or condo value by units in structure - 2 ($)
Mean house or condo value by units in structure by units in structure - 3 or 4 ($)
Mean house or condo value by units in structure - 5 or more ($)
Mean house or condo value by units in structure - Boat, RV, van, etc. ($)
Mean house or condo value by units in structure - Mobile home ($)
Median house or condo value ($) - White
Median house or condo value ($) - Black or African American
Median house or condo value ($) - Asian
Median house or condo value ($) - Hispanic or Latino
Median house or condo value ($) - American Indian and Alaska Native
Median house or condo value ($) - Multirace
Median house or condo value ($) - Other Race
Median resident age
Resident age diversity
Median resident age - Males
Median resident age - Females
Median resident age - White
Median resident age - Black or African American
Median resident age - Asian
Median resident age - Hispanic or Latino
Median resident age - American Indian and Alaska Native
Median resident age - Multirace
Median resident age - Other Race
Median resident age - Males - White
Median resident age - Males - Black or African American
Median resident age - Males - Asian
Median resident age - Males - Hispanic or Latino
Median resident age - Males - American Indian and Alaska Native
Median resident age - Males - Multirace
Median resident age - Males - Other Race
Median resident age - Females - White
Median resident age - Females - Black or African American
Median resident age - Females - Asian
Median resident age - Females - Hispanic or Latino
Median resident age - Females - American Indian and Alaska Native
Median resident age - Females - Multirace
Median resident age - Females - Other Race
Commute - mean travel time to work (minutes)
Travel time to work - Less than 5 minutes (%)
Travel time to work - Less than 5 minutes (% change since 2000)
Travel time to work - 5 to 9 minutes (%)
Travel time to work - 5 to 9 minutes (% change since 2000)
Travel time to work - 10 to 19 minutes (%)
Travel time to work - 10 to 19 minutes (% change since 2000)
Travel time to work - 20 to 29 minutes (%)
Travel time to work - 20 to 29 minutes (% change since 2000)
Travel time to work - 30 to 39 minutes (%)
Travel time to work - 30 to 39 minutes (% change since 2000)
Travel time to work - 40 to 59 minutes (%)
Travel time to work - 40 to 59 minutes (% change since 2000)
Travel time to work - 60 to 89 minutes (%)
Travel time to work - 60 to 89 minutes (% change since 2000)
Travel time to work - 90 or more minutes (%)
Travel time to work - 90 or more minutes (% change since 2000)
Marital status - Never married (%)
Marital status - Now married (%)
Marital status - Separated (%)
Marital status - Widowed (%)
Marital status - Divorced (%)
Median family income ($)
Median family income (% change since 2000)
Median non-family income ($)
Median non-family income (% change since 2000)
Median per capita income ($)
Median per capita income (% change since 2000)
Median family income ($) - White
Median family income ($) - Black or African American
Median family income ($) - Asian
Median family income ($) - Hispanic or Latino
Median family income ($) - American Indian and Alaska Native
Median family income ($) - Multirace
Median family income ($) - Other Race
Median year house/condo built
Median year apartment built
Year house built - Built 2005 or later (%)
Year house built - Built 2000 to 2004 (%)
Year house built - Built 1990 to 1999 (%)
Year house built - Built 1980 to 1989 (%)
Year house built - Built 1970 to 1979 (%)
Year house built - Built 1960 to 1969 (%)
Year house built - Built 1950 to 1959 (%)
Year house built - Built 1940 to 1949 (%)
Year house built - Built 1939 or earlier (%)
Average household size
Household density (households per square mile)
Average household size - White
Average household size - Black or African American
Average household size - Asian
Average household size - Hispanic or Latino
Average household size - American Indian and Alaska Native
Average household size - Multirace
Average household size - Other Race
Occupied housing units (%)
Vacant housing units (%)
Owner occupied housing units (%)
Renter occupied housing units (%)
Vacancy status - For rent (%)
Vacancy status - For sale only (%)
Vacancy status - Rented or sold, not occupied (%)
Vacancy status - For seasonal, recreational, or occasional use (%)
Vacancy status - For migrant workers (%)
Vacancy status - Other vacant (%)
Residents with income below the poverty level (%)
Residents with income below 50% of the poverty level (%)
Children below poverty level (%)
Poor families by family type - Married-couple family (%)
Poor families by family type - Male, no wife present (%)
Poor families by family type - Female, no husband present (%)
Poverty status for native-born residents (%)
Poverty status for foreign-born residents (%)
Poverty among high school graduates not in families (%)
Poverty among people who did not graduate high school not in families (%)
Residents with income below the poverty level (%) - White
Residents with income below the poverty level (%) - Black or African American
Residents with income below the poverty level (%) - Asian
Residents with income below the poverty level (%) - Hispanic or Latino
Residents with income below the poverty level (%) - American Indian and Alaska Native
Residents with income below the poverty level (%) - Multirace
Residents with income below the poverty level (%) - Other Race
Air pollution - Air Quality Index (AQI)
Air pollution - CO
Air pollution - NO2
Air pollution - SO2
Air pollution - Ozone
Air pollution - PM10
Air pollution - PM25
Air pollution - Pb
Crime - Murders per 100,000 population
Crime - Rapes per 100,000 population
Crime - Robberies per 100,000 population
Crime - Assaults per 100,000 population
Crime - Burglaries per 100,000 population
Crime - Thefts per 100,000 population
Crime - Auto thefts per 100,000 population
Crime - Arson per 100,000 population
Crime - City-data.com crime index
Crime - Violent crime index
Crime - Property crime index
Crime - Murders per 100,000 population (5 year average)
Crime - Rapes per 100,000 population (5 year average)
Crime - Robberies per 100,000 population (5 year average)
Crime - Assaults per 100,000 population (5 year average)
Crime - Burglaries per 100,000 population (5 year average)
Crime - Thefts per 100,000 population (5 year average)
Crime - Auto thefts per 100,000 population (5 year average)
Crime - Arson per 100,000 population (5 year average)
Crime - City-data.com crime index (5 year average)
Crime - Violent crime index (5 year average)
Crime - Property crime index (5 year average)
1996 Presidential Elections Results (%) - Democratic Party (Clinton)
1996 Presidential Elections Results (%) - Republican Party (Dole)
1996 Presidential Elections Results (%) - Other
2000 Presidential Elections Results (%) - Democratic Party (Gore)
2000 Presidential Elections Results (%) - Republican Party (Bush)
2000 Presidential Elections Results (%) - Other
2004 Presidential Elections Results (%) - Democratic Party (Kerry)
2004 Presidential Elections Results (%) - Republican Party (Bush)
2004 Presidential Elections Results (%) - Other
2008 Presidential Elections Results (%) - Democratic Party (Obama)
2008 Presidential Elections Results (%) - Republican Party (McCain)
2008 Presidential Elections Results (%) - Other
2012 Presidential Elections Results (%) - Democratic Party (Obama)
2012 Presidential Elections Results (%) - Republican Party (Romney)
2012 Presidential Elections Results (%) - Other
2016 Presidential Elections Results (%) - Democratic Party (Clinton)
2016 Presidential Elections Results (%) - Republican Party (Trump)
2016 Presidential Elections Results (%) - Other
2020 Presidential Elections Results (%) - Democratic Party (Biden)
2020 Presidential Elections Results (%) - Republican Party (Trump)
2020 Presidential Elections Results (%) - Other
Ancestries Reported - Arab (%)
Ancestries Reported - Czech (%)
Ancestries Reported - Danish (%)
Ancestries Reported - Dutch (%)
Ancestries Reported - English (%)
Ancestries Reported - French (%)
Ancestries Reported - French Canadian (%)
Ancestries Reported - German (%)
Ancestries Reported - Greek (%)
Ancestries Reported - Hungarian (%)
Ancestries Reported - Irish (%)
Ancestries Reported - Italian (%)
Ancestries Reported - Lithuanian (%)
Ancestries Reported - Norwegian (%)
Ancestries Reported - Polish (%)
Ancestries Reported - Portuguese (%)
Ancestries Reported - Russian (%)
Ancestries Reported - Scotch-Irish (%)
Ancestries Reported - Scottish (%)
Ancestries Reported - Slovak (%)
Ancestries Reported - Subsaharan African (%)
Ancestries Reported - Swedish (%)
Ancestries Reported - Swiss (%)
Ancestries Reported - Ukrainian (%)
Ancestries Reported - United States (%)
Ancestries Reported - Welsh (%)
Ancestries Reported - West Indian (%)
Ancestries Reported - Other (%)
Educational Attainment - No schooling completed (%)
Educational Attainment - Less than high school (%)
Educational Attainment - High school or equivalent (%)
Educational Attainment - Less than 1 year of college (%)
Educational Attainment - 1 or more years of college (%)
Educational Attainment - Associate degree (%)
Educational Attainment - Bachelor's degree (%)
Educational Attainment - Master's degree (%)
Educational Attainment - Professional school degree (%)
Educational Attainment - Doctorate degree (%)
School Enrollment - Nursery, preschool (%)
School Enrollment - Kindergarten (%)
School Enrollment - Grade 1 to 4 (%)
School Enrollment - Grade 5 to 8 (%)
School Enrollment - Grade 9 to 12 (%)
School Enrollment - College undergrad (%)
School Enrollment - Graduate or professional (%)
School Enrollment - Not enrolled in school (%)
School enrollment - Public schools (%)
School enrollment - Private schools (%)
School enrollment - Not enrolled (%)
Median number of rooms in houses and condos
Median number of rooms in apartments
Housing units lacking complete plumbing facilities (%)
Housing units lacking complete kitchen facilities (%)
Density of houses
Urban houses (%)
Rural houses (%)
Households with people 60 years and over (%)
Households with people 65 years and over (%)
Households with people 75 years and over (%)
Households with one or more nonrelatives (%)
Households with no nonrelatives (%)
Population in households (%)
Family households (%)
Nonfamily households (%)
Population in families (%)
Family households with own children (%)
Median number of bedrooms in owner occupied houses
Mean number of bedrooms in owner occupied houses
Median number of bedrooms in renter occupied houses
Mean number of bedrooms in renter occupied houses
Median number of vehichles in owner occupied houses
Mean number of vehichles in owner occupied houses
Median number of vehichles in renter occupied houses
Mean number of vehichles in renter occupied houses
Mortgage status - with mortgage (%)
Mortgage status - with second mortgage (%)
Mortgage status - with home equity loan (%)
Mortgage status - with both second mortgage and home equity loan (%)
Mortgage status - without a mortgage (%)
Average family size
Average family size - White
Average family size - Black or African American
Average family size - Asian
Average family size - Hispanic or Latino
Average family size - American Indian and Alaska Native
Average family size - Multirace
Average family size - Other Race
Geographical mobility - Same house 1 year ago (%)
Geographical mobility - Moved within same county (%)
Geographical mobility - Moved from different county within same state (%)
Geographical mobility - Moved from different state (%)
Geographical mobility - Moved from abroad (%)
Place of birth - Born in state of residence (%)
Place of birth - Born in other state (%)
Place of birth - Native, outside of US (%)
Place of birth - Foreign born (%)
Housing units in structures - 1, detached (%)
Housing units in structures - 1, attached (%)
Housing units in structures - 2 (%)
Housing units in structures - 3 or 4 (%)
Housing units in structures - 5 to 9 (%)
Housing units in structures - 10 to 19 (%)
Housing units in structures - 20 to 49 (%)
Housing units in structures - 50 or more (%)
Housing units in structures - Mobile home (%)
Housing units in structures - Boat, RV, van, etc. (%)
House/condo owner moved in on average (years ago)
Renter moved in on average (years ago)
Year householder moved into unit - Moved in 1999 to March 2000 (%)
Year householder moved into unit - Moved in 1995 to 1998 (%)
Year householder moved into unit - Moved in 1990 to 1994 (%)
Year householder moved into unit - Moved in 1980 to 1989 (%)
Year householder moved into unit - Moved in 1970 to 1979 (%)
Year householder moved into unit - Moved in 1969 or earlier (%)
Means of transportation to work - Drove car alone (%)
Means of transportation to work - Carpooled (%)
Means of transportation to work - Public transportation (%)
Means of transportation to work - Bus or trolley bus (%)
Means of transportation to work - Streetcar or trolley car (%)
Means of transportation to work - Subway or elevated (%)
Means of transportation to work - Railroad (%)
Means of transportation to work - Ferryboat (%)
Means of transportation to work - Taxicab (%)
Means of transportation to work - Motorcycle (%)
Means of transportation to work - Bicycle (%)
Means of transportation to work - Walked (%)
Means of transportation to work - Other means (%)
Working at home (%)
Industry diversity
Most Common Industries - Agriculture, forestry, fishing and hunting, and mining (%)
Most Common Industries - Agriculture, forestry, fishing and hunting (%)
Most Common Industries - Mining, quarrying, and oil and gas extraction (%)
Most Common Industries - Construction (%)
Most Common Industries - Manufacturing (%)
Most Common Industries - Wholesale trade (%)
Most Common Industries - Retail trade (%)
Most Common Industries - Transportation and warehousing, and utilities (%)
Most Common Industries - Transportation and warehousing (%)
Most Common Industries - Utilities (%)
Most Common Industries - Information (%)
Most Common Industries - Finance and insurance, and real estate and rental and leasing (%)
Most Common Industries - Finance and insurance (%)
Most Common Industries - Real estate and rental and leasing (%)
Most Common Industries - Professional, scientific, and management, and administrative and waste management services (%)
Most Common Industries - Professional, scientific, and technical services (%)
Most Common Industries - Management of companies and enterprises (%)
Most Common Industries - Administrative and support and waste management services (%)
Most Common Industries - Educational services, and health care and social assistance (%)
Most Common Industries - Educational services (%)
Most Common Industries - Health care and social assistance (%)
Most Common Industries - Arts, entertainment, and recreation, and accommodation and food services (%)
Most Common Industries - Arts, entertainment, and recreation (%)
Most Common Industries - Accommodation and food services (%)
Most Common Industries - Other services, except public administration (%)
Most Common Industries - Public administration (%)
Occupation diversity
Most Common Occupations - Management, business, science, and arts occupations (%)
Most Common Occupations - Management, business, and financial occupations (%)
Most Common Occupations - Management occupations (%)
Most Common Occupations - Business and financial operations occupations (%)
Most Common Occupations - Computer, engineering, and science occupations (%)
Most Common Occupations - Computer and mathematical occupations (%)
Most Common Occupations - Architecture and engineering occupations (%)
Most Common Occupations - Life, physical, and social science occupations (%)
Most Common Occupations - Education, legal, community service, arts, and media occupations (%)
Most Common Occupations - Community and social service occupations (%)
Most Common Occupations - Legal occupations (%)
Most Common Occupations - Education, training, and library occupations (%)
Most Common Occupations - Arts, design, entertainment, sports, and media occupations (%)
Most Common Occupations - Healthcare practitioners and technical occupations (%)
Most Common Occupations - Health diagnosing and treating practitioners and other technical occupations (%)
Most Common Occupations - Health technologists and technicians (%)
Most Common Occupations - Service occupations (%)
Most Common Occupations - Healthcare support occupations (%)
Most Common Occupations - Protective service occupations (%)
Most Common Occupations - Fire fighting and prevention, and other protective service workers including supervisors (%)
Most Common Occupations - Law enforcement workers including supervisors (%)
Most Common Occupations - Food preparation and serving related occupations (%)
Most Common Occupations - Building and grounds cleaning and maintenance occupations (%)
Most Common Occupations - Personal care and service occupations (%)
Most Common Occupations - Sales and office occupations (%)
Most Common Occupations - Sales and related occupations (%)
Most Common Occupations - Office and administrative support occupations (%)
Most Common Occupations - Natural resources, construction, and maintenance occupations (%)
Most Common Occupations - Farming, fishing, and forestry occupations (%)
Most Common Occupations - Construction and extraction occupations (%)
Most Common Occupations - Installation, maintenance, and repair occupations (%)
Most Common Occupations - Production, transportation, and material moving occupations (%)
Most Common Occupations - Production occupations (%)
Most Common Occupations - Transportation occupations (%)
Most Common Occupations - Material moving occupations (%)
People in Group quarters - Institutionalized population (%)
People in Group quarters - Correctional institutions (%)
People in Group quarters - Federal prisons and detention centers (%)
People in Group quarters - Halfway houses (%)
People in Group quarters - Local jails and other confinement facilities (including police lockups) (%)
People in Group quarters - Military disciplinary barracks (%)
People in Group quarters - State prisons (%)
People in Group quarters - Other types of correctional institutions (%)
People in Group quarters - Nursing homes (%)
People in Group quarters - Hospitals/wards, hospices, and schools for the handicapped (%)
People in Group quarters - Hospitals/wards and hospices for chronically ill (%)
People in Group quarters - Hospices or homes for chronically ill (%)
People in Group quarters - Military hospitals or wards for chronically ill (%)
People in Group quarters - Other hospitals or wards for chronically ill (%)
People in Group quarters - Hospitals or wards for drug/alcohol abuse (%)
People in Group quarters - Mental (Psychiatric) hospitals or wards (%)
People in Group quarters - Schools, hospitals, or wards for the mentally retarded (%)
People in Group quarters - Schools, hospitals, or wards for the physically handicapped (%)
People in Group quarters - Institutions for the deaf (%)
People in Group quarters - Institutions for the blind (%)
People in Group quarters - Orthopedic wards and institutions for the physically handicapped (%)
People in Group quarters - Wards in general hospitals for patients who have no usual home elsewhere (%)
People in Group quarters - Wards in military hospitals for patients who have no usual home elsewhere (%)
People in Group quarters - Juvenile institutions (%)
People in Group quarters - Long-term care (%)
People in Group quarters - Homes for abused, dependent, and neglected children (%)
People in Group quarters - Residential treatment centers for emotionally disturbed children (%)
People in Group quarters - Training schools for juvenile delinquents (%)
People in Group quarters - Short-term care, detention or diagnostic centers for delinquent children (%)
People in Group quarters - Type of juvenile institution unknown (%)
People in Group quarters - Noninstitutionalized population (%)
People in Group quarters - College dormitories (includes college quarters off campus) (%)
People in Group quarters - Military quarters (%)
People in Group quarters - On base (%)
People in Group quarters - Barracks, unaccompanied personnel housing (UPH), (Enlisted/Officer), ;and similar group living quarters for military personnel (%)
People in Group quarters - Transient quarters for temporary residents (%)
People in Group quarters - Military ships (%)
People in Group quarters - Group homes (%)
People in Group quarters - Homes or halfway houses for drug/alcohol abuse (%)
People in Group quarters - Homes for the mentally ill (%)
People in Group quarters - Homes for the mentally retarded (%)
People in Group quarters - Homes for the physically handicapped (%)
People in Group quarters - Other group homes (%)
People in Group quarters - Religious group quarters (%)
People in Group quarters - Dormitories (%)
People in Group quarters - Agriculture workers' dormitories on farms (%)
People in Group quarters - Job Corps and vocational training facilities (%)
People in Group quarters - Other workers' dormitories (%)
People in Group quarters - Crews of maritime vessels (%)
People in Group quarters - Other nonhousehold living situations (%)
People in Group quarters - Other noninstitutional group quarters (%)
Residents speaking English at home (%)
Residents speaking English at home - Born in the United States (%)
Residents speaking English at home - Native, born elsewhere (%)
Residents speaking English at home - Foreign born (%)
Residents speaking Spanish at home (%)
Residents speaking Spanish at home - Born in the United States (%)
Residents speaking Spanish at home - Native, born elsewhere (%)
Residents speaking Spanish at home - Foreign born (%)
Residents speaking other language at home (%)
Residents speaking other language at home - Born in the United States (%)
Residents speaking other language at home - Native, born elsewhere (%)
Residents speaking other language at home - Foreign born (%)
Class of Workers - Employee of private company (%)
Class of Workers - Self-employed in own incorporated business (%)
Class of Workers - Private not-for-profit wage and salary workers (%)
Class of Workers - Local government workers (%)
Class of Workers - State government workers (%)
Class of Workers - Federal government workers (%)
Class of Workers - Self-employed workers in own not incorporated business and Unpaid family workers (%)
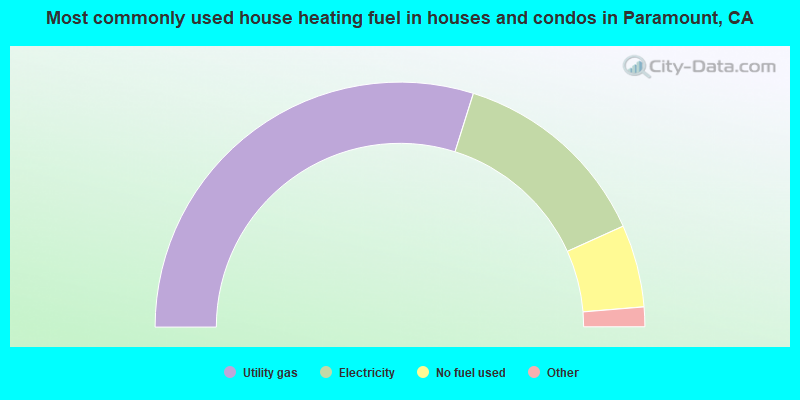
House heating fuel used in houses and condos - Utility gas (%)
House heating fuel used in houses and condos - Bottled, tank, or LP gas (%)
House heating fuel used in houses and condos - Electricity (%)
House heating fuel used in houses and condos - Fuel oil, kerosene, etc. (%)
House heating fuel used in houses and condos - Coal or coke (%)
House heating fuel used in houses and condos - Wood (%)
House heating fuel used in houses and condos - Solar energy (%)
House heating fuel used in houses and condos - Other fuel (%)
House heating fuel used in houses and condos - No fuel used (%)
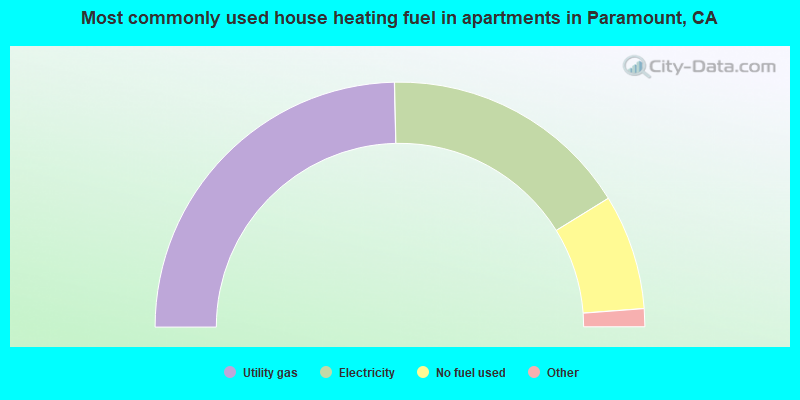
House heating fuel used in apartments - Utility gas (%)
House heating fuel used in apartments - Bottled, tank, or LP gas (%)
House heating fuel used in apartments - Electricity (%)
House heating fuel used in apartments - Fuel oil, kerosene, etc. (%)
House heating fuel used in apartments - Coal or coke (%)
House heating fuel used in apartments - Wood (%)
House heating fuel used in apartments - Solar energy (%)
House heating fuel used in apartments - Other fuel (%)
House heating fuel used in apartments - No fuel used (%)
Armed forces status - In Armed Forces (%)
Armed forces status - Civilian (%)
Armed forces status - Civilian - Veteran (%)
Armed forces status - Civilian - Nonveteran (%)
Fatal accidents locations in years 2005-2021
Fatal accidents locations in 2005
Fatal accidents locations in 2006
Fatal accidents locations in 2007
Fatal accidents locations in 2008
Fatal accidents locations in 2009
Fatal accidents locations in 2010
Fatal accidents locations in 2011
Fatal accidents locations in 2012
Fatal accidents locations in 2013
Fatal accidents locations in 2014
Fatal accidents locations in 2015
Fatal accidents locations in 2016
Fatal accidents locations in 2017
Fatal accidents locations in 2018
Fatal accidents locations in 2019
Fatal accidents locations in 2020
Fatal accidents locations in 2021
Alcohol use - People drinking some alcohol every month (%)
Alcohol use - People not drinking at all (%)
Alcohol use - Average days/month drinking alcohol
Alcohol use - Average drinks/week
Alcohol use - Average days/year people drink much
Audiometry - Average condition of hearing (%)
Audiometry - People that can hear a whisper from across a quiet room (%)
Audiometry - People that can hear normal voice from across a quiet room (%)
Audiometry - Ears ringing, roaring, buzzing (%)
Audiometry - Had a job exposure to loud noise (%)
Audiometry - Had off-work exposure to loud noise (%)
Blood Pressure & Cholesterol - Has high blood pressure (%)
Blood Pressure & Cholesterol - Checking blood pressure at home (%)
Blood Pressure & Cholesterol - Frequently checking blood cholesterol (%)
Blood Pressure & Cholesterol - Has high cholesterol level (%)
Consumer Behavior - Money monthly spent on food at supermarket/grocery store
Consumer Behavior - Money monthly spent on food at other stores
Consumer Behavior - Money monthly spent on eating out
Consumer Behavior - Money monthly spent on carryout/delivered foods
Consumer Behavior - Income spent on food at supermarket/grocery store (%)
Consumer Behavior - Income spent on food at other stores (%)
Consumer Behavior - Income spent on eating out (%)
Consumer Behavior - Income spent on carryout/delivered foods (%)
Current Health Status - General health condition (%)
Current Health Status - Blood donors (%)
Current Health Status - Has blood ever tested for HIV virus (%)
Current Health Status - Left-handed people (%)
Dermatology - People using sunscreen (%)
Diabetes - Diabetics (%)
Diabetes - Had a blood test for high blood sugar (%)
Diabetes - People taking insulin (%)
Diet Behavior & Nutrition - Diet health (%)
Diet Behavior & Nutrition - Milk product consumption (# of products/month)
Diet Behavior & Nutrition - Meals not home prepared (#/week)
Diet Behavior & Nutrition - Meals from fast food or pizza place (#/week)
Diet Behavior & Nutrition - Ready-to-eat foods (#/month)
Diet Behavior & Nutrition - Frozen meals/pizza (#/month)
Drug Use - People that ever used marijuana or hashish (%)
Drug Use - Ever used hard drugs (%)
Drug Use - Ever used any form of cocaine (%)
Drug Use - Ever used heroin (%)
Drug Use - Ever used methamphetamine (%)
Health Insurance - People covered by health insurance (%)
Kidney Conditions-Urology - Avg. # of times urinating at night
Medical Conditions - People with asthma (%)
Medical Conditions - People with anemia (%)
Medical Conditions - People with psoriasis (%)
Medical Conditions - People with overweight (%)
Medical Conditions - Elderly people having difficulties in thinking or remembering (%)
Medical Conditions - People who ever received blood transfusion (%)
Medical Conditions - People having trouble seeing even with glass/contacts (%)
Medical Conditions - People with arthritis (%)
Medical Conditions - People with gout (%)
Medical Conditions - People with congestive heart failure (%)
Medical Conditions - People with coronary heart disease (%)
Medical Conditions - People with angina pectoris (%)
Medical Conditions - People who ever had heart attack (%)
Medical Conditions - People who ever had stroke (%)
Medical Conditions - People with emphysema (%)
Medical Conditions - People with thyroid problem (%)
Medical Conditions - People with chronic bronchitis (%)
Medical Conditions - People with any liver condition (%)
Medical Conditions - People who ever had cancer or malignancy (%)
Mental Health - People who have little interest in doing things (%)
Mental Health - People feeling down, depressed, or hopeless (%)
Mental Health - People who have trouble sleeping or sleeping too much (%)
Mental Health - People feeling tired or having little energy (%)
Mental Health - People with poor appetite or overeating (%)
Mental Health - People feeling bad about themself (%)
Mental Health - People who have trouble concentrating on things (%)
Mental Health - People moving or speaking slowly or too fast (%)
Mental Health - People having thoughts they would be better off dead (%)
Oral Health - Average years since last visit a dentist
Oral Health - People embarrassed because of mouth (%)
Oral Health - People with gum disease (%)
Oral Health - General health of teeth and gums (%)
Oral Health - Average days a week using dental floss/device
Oral Health - Average days a week using mouthwash for dental problem
Oral Health - Average number of teeth
Pesticide Use - Households using pesticides to control insects (%)
Pesticide Use - Households using pesticides to kill weeds (%)
Physical Activity - People doing vigorous-intensity work activities (%)
Physical Activity - People doing moderate-intensity work activities (%)
Physical Activity - People walking or bicycling (%)
Physical Activity - People doing vigorous-intensity recreational activities (%)
Physical Activity - People doing moderate-intensity recreational activities (%)
Physical Activity - Average hours a day doing sedentary activities
Physical Activity - Average hours a day watching TV or videos
Physical Activity - Average hours a day using computer
Physical Functioning - People having limitations keeping them from working (%)
Physical Functioning - People limited in amount of work they can do (%)
Physical Functioning - People that need special equipment to walk (%)
Physical Functioning - People experiencing confusion/memory problems (%)
Physical Functioning - People requiring special healthcare equipment (%)
Prescription Medications - Average number of prescription medicines taking
Preventive Aspirin Use - Adults 40+ taking low-dose aspirin (%)
Reproductive Health - Vaginal deliveries (%)
Reproductive Health - Cesarean deliveries (%)
Reproductive Health - Deliveries resulted in a live birth (%)
Reproductive Health - Pregnancies resulted in a delivery (%)
Reproductive Health - Women breastfeeding newborns (%)
Reproductive Health - Women that had a hysterectomy (%)
Reproductive Health - Women that had both ovaries removed (%)
Reproductive Health - Women that have ever taken birth control pills (%)
Reproductive Health - Women taking birth control pills (%)
Reproductive Health - Women that have ever used Depo-Provera or injectables (%)
Reproductive Health - Women that have ever used female hormones (%)
Sexual Behavior - People 18+ that ever had sex (vaginal, anal, or oral) (%)
Sexual Behavior - Males 18+ that ever had vaginal sex with a woman (%)
Sexual Behavior - Males 18+ that ever performed oral sex on a woman (%)
Sexual Behavior - Males 18+ that ever had anal sex with a woman (%)
Sexual Behavior - Males 18+ that ever had any sex with a man (%)
Sexual Behavior - Females 18+ that ever had vaginal sex with a man (%)
Sexual Behavior - Females 18+ that ever performed oral sex on a man (%)
Sexual Behavior - Females 18+ that ever had anal sex with a man (%)
Sexual Behavior - Females 18+ that ever had any kind of sex with a woman (%)
Sexual Behavior - Average age people first had sex
Sexual Behavior - Average number of female sex partners in lifetime (males 18+)
Sexual Behavior - Average number of female vaginal sex partners in lifetime (males 18+)
Sexual Behavior - Average age people first performed oral sex on a woman (18+)
Sexual Behavior - Average number of woman performed oral sex on in lifetime (18+)
Sexual Behavior - Average number of male sex partners in lifetime (males 18+)
Sexual Behavior - Average number of male anal sex partners in lifetime (males 18+)
Sexual Behavior - Average age people first performed oral sex on a man (18+)
Sexual Behavior - Average number of male oral sex partners in lifetime (18+)
Sexual Behavior - People using protection when performing oral sex (%)
Sexual Behavior - Average number of times people have vaginal or anal sex a year
Sexual Behavior - People having sex without condom (%)
Sexual Behavior - Average number of male sex partners in lifetime (females 18+)
Sexual Behavior - Average number of male vaginal sex partners in lifetime (females 18+)
Sexual Behavior - Average number of female sex partners in lifetime (females 18+)
Sexual Behavior - Circumcised males 18+ (%)
Sleep Disorders - Average hours sleeping at night
Sleep Disorders - People that has trouble sleeping (%)
Smoking-Cigarette Use - People smoking cigarettes (%)
Taste & Smell - People 40+ having problems with smell (%)
Taste & Smell - People 40+ having problems with taste (%)
Taste & Smell - People 40+ that ever had wisdom teeth removed (%)
Taste & Smell - People 40+ that ever had tonsils teeth removed (%)
Taste & Smell - People 40+ that ever had a loss of consciousness because of a head injury (%)
Taste & Smell - People 40+ that ever had a broken nose or other serious injury to face or skull (%)
Taste & Smell - People 40+ that ever had two or more sinus infections (%)
Weight - Average height (inches)
Weight - Average weight (pounds)
Weight - Average BMI
Weight - People that are obese (%)
Weight - People that ever were obese (%)
Weight - People trying to lose weight (%)
42,662 81.9% Hispanic 4,398 8.4% Black alone 2,301 4.4% White alone 1,871 3.6% Asian alone 829 1.6% Two or more races 127 0.2% Native Hawaiian and Other 92 0.2% Other race alone 28 0.05% American Indian alone
According to our research of California and other state lists, there were 48 registered sex offenders living in Paramount, California as of June 09, 2024 . The ratio of all residents to sex offenders in Paramount is 1,154 to 1.The ratio of registered sex offenders to all residents in this city is lower than the state average.
The City-Data.com crime index weighs serious crimes and violent crimes more heavily. Higher means more crime, U.S. average is 246.1. It adjusts for the number of visitors and daily workers commuting into cities.
- means the value is smaller than the state average.
- means the value is about the same as the state average.
- means the value is bigger than the state average.
- means the value is much bigger than the state average.
Crime rate in Paramount detailed stats: murders, rapes, robberies, assaults, burglaries, thefts, arson Officers per 1,000 residents here:
0.02California average:
1.98
Latest news from Paramount, CA collected exclusively by city-data.com from local newspapers, TV, and radio stations
Ancestries: American (1.0%).
Current Local Time:
Land area: 4.73 square miles.
Population density: 10,915 people per square mile (high).
18,699 residents are foreign born (32.5% Latin America ).
This city:
35.9%California:
26.5%
Median real estate property taxes paid for housing units with mortgages in 2022: $3,846 (0.6%)Median real estate property taxes paid for housing units with no mortgage in 2022: $1,826 (0.5%)
Nearest city with pop. 200,000+: Long Beach, CA
Nearest city with pop. 1,000,000+: Los Angeles, CA
Nearest cities:
Latitude: 33.90 N, Longitude: 118.17 W
Daytime population change due to commuting: -6,823 (-13.1%)Workers who live and work in this city: 4,161 (17.0%)
Area code commonly used in this area: 562
Property values in Paramount, CA
Single-family new house construction building permits:
2022: 26 buildings , average cost: $123,8002021: 22 buildings , average cost: $206,9002019: 3 buildings , average cost: $287,0002018: 25 buildings , average cost: $238,5002017: 13 buildings , average cost: $247,1002016: 20 buildings , average cost: $226,4002015: 2 buildings , average cost: $173,9002014: 5 buildings , average cost: $229,3002013: 1 building , cost: $177,2002012: 1 building , cost: $194,9002011: 19 buildings , average cost: $164,9002010: 5 buildings , average cost: $271,0002009: 4 buildings , average cost: $224,7002008: 10 buildings , average cost: $211,7002007: 5 buildings , average cost: $223,2002006: 8 buildings , average cost: $171,1002005: 29 buildings , average cost: $177,9002004: 14 buildings , average cost: $193,0002003: 13 buildings , average cost: $126,2002002: 4 buildings , average cost: $159,4002001: 12 buildings , average cost: $78,0002000: 1 building , cost: $111,0001999: 10 buildings , average cost: $117,0001998: 17 buildings , average cost: $66,9001997: 31 buildings , average cost: $78,400Unemployment in December 2023:
Population change in the 1990s: +7,622 (+16.0%).
Most common occupations in Paramount, CA (%)
Both Males Females
Other production occupations, including supervisors (9.0%)
Building and grounds cleaning and maintenance occupations (4.4%)
Driver/sales workers and truck drivers (4.4%)
Material recording, scheduling, dispatching, and distributing workers (4.0%)
Other office and administrative support workers, including supervisors (4.0%)
Metal workers and plastic workers (3.6%)
Other sales and related occupations, including supervisors (3.5%)
Other production occupations, including supervisors (11.1%)
Driver/sales workers and truck drivers (7.7%)
Building and grounds cleaning and maintenance occupations (5.5%)
Metal workers and plastic workers (5.4%)
Material recording, scheduling, dispatching, and distributing workers (4.2%)
Construction laborers (3.5%)
Other sales and related occupations, including supervisors (3.5%)
Other office and administrative support workers, including supervisors (7.2%)
Other production occupations, including supervisors (6.3%)
Secretaries and administrative assistants (4.1%)
Customer service representatives (4.1%)
Retail sales workers, except cashiers (4.0%)
Material recording, scheduling, dispatching, and distributing workers (3.9%)
Other teachers, instructors, education, training, and library occupations (3.7%)
Earthquake activity:
Paramount-area historical earthquake activity is significantly above California state average. It is 6882% greater than the overall U.S. average. On 7/21/1952 at 11:52:14, a magnitude 7.7 (7.7 UK, Class: Major, Intensity: VIII - XII) earthquake occurred 89.7 miles away from Paramount center, causing $50,000,000 total damage On 6/28/1992 at 11:57:34, a magnitude 7.6 (6.2 MB, 7.6 MS, 7.3 MW, Depth: 0.7 mi) earthquake occurred 95.7 miles away from the city center, causing 3 deaths ( 1 shaking deaths, 2 other deaths) and 400 injuries, causing $100,000,000 total damage and $40,000,000 insured lossesOn 10/16/1999 at 09:46:44, a magnitude 7.4 (6.3 MB, 7.4 MS, 7.2 MW, 7.3 ML) earthquake occurred 107.8 miles away from the city center On 11/4/1927 at 13:51:53, a magnitude 7.5 (7.5 UK) earthquake occurred 177.9 miles away from the city center On 1/17/1994 at 12:30:55, a magnitude 6.8 (6.4 MB, 6.8 MS, 6.7 MW, Depth: 11.4 mi, Class: Strong, Intensity: VII - IX) earthquake occurred 29.4 miles away from Paramount center, causing 60 deaths ( 60 shaking deaths) and 7000 injuriesOn 4/21/1918 at 22:32:30, a magnitude 6.8 (6.8 UK) earthquake occurred 42.2 miles away from the city center Magnitude types: body-wave magnitude (MB), local magnitude (ML), surface-wave magnitude (MS), moment magnitude (MW) Natural disasters: The number of natural disasters in Los Angeles County (57) is a lot greater than the US average (15).Major Disasters (Presidential) Declared: 27Emergencies Declared: 3Fires: 37, Floods: 16, Storms: 9, Winter Storms: 6, Landslides: 5, Mudslides: 5, Earthquakes: 3, Freeze: 1, Heavy Rain: 1, Hurricane: 1, Snow: 1, Tornado: 1, Wind: 1, Other: 1 (Note: some incidents may be assigned to more than one category). Hospitals and medical centers in Paramount: LA PAZ AT PARAMOUNT (8835 VANS STREET)
PARAMOUNT CONVALESCENT HOSP. (8558 EAST ROSECRANS AVENUE)
PARAMOUNT MEADOWS NURSING CTR. (7039 ALONDRA BLVD)
PROMISE HOSP OF EAST LA SUBURBAN CAMPUS (16453 SO. COLORADO AVENUE)
TERRACE GARDENS CONV CENTER (8835 VANS STREET)
DAVITA-PARAMOUNT DIALYSIS CENTER (8319 ALONDRA BLVD.)
RELIANCE HOME HEALTH SERVICES (16660 PARAMOUNT BLVD STE 304)
Amtrak stations near Paramount: 9 miles: LONG BEACH (601 N. LONG BEACH BLVD.) - Bus Station Services: fully wheelchair accessible, public restrooms, public payphones, full-service food facilities, paid short-term parking, paid long-term parking, call for taxi service, public transit connection.
12 miles: LOS ANGELES (800 N. ALAMEDA ST.) Services: ticket office, fully wheelchair accessible, enclosed waiting area, public restrooms, public payphones, snack bar, free short-term parking, paid long-term parking, car rental agency, taxi stand, public transit connection.
13 miles: SAN PEDRO (CATALINA TERMINAL, BERTH 95) - Bus Station Services: partially wheelchair accessible, enclosed waiting area, public restrooms, public payphones, snack bar, paid short-term parking, paid long-term parking, call for taxi service.
College/University in Paramount: InfoTech Career College Full-time enrollment: 117; Location: 8527 Alondra Blvd, #174; Private, for-profit; Website: www.infotech.edu)
Colleges/universities with over 2000 students nearest to Paramount:
El Camino College-Compton Center (about 3 miles; Compton, CA ; Full-time enrollment: 4,506)
Cerritos College (about 5 miles; Norwalk, CA ; FT enrollment: 13,090)
Long Beach City College (about 6 miles; Long Beach, CA ; FT enrollment: 15,602)
California State University-Dominguez Hills (about 6 miles; Carson, CA ; FT enrollment: 9,862)
ICDC College (about 7 miles; Huntington Park, CA ; FT enrollment: 2,621)
United Education Institute-Huntington Park Campus (about 7 miles; Huntington Park, CA ; FT enrollment: 5,151)
Wyotech-Long Beach (about 9 miles; Long Beach, CA ; FT enrollment: 2,453)
Public high schools in Paramount:
Biggest public elementary/middle schools in Paramount: ALONDRA MIDDLE Students: 922, Location: 16200 DOWNEY AVE., Grades: 6-8)PARAMOUNT PARK MIDDLE Students: 844, Location: 14608 PARAMOUNT BLVD., Grades: 6-8)LOS CERRITOS Students: 620, Location: 14626 GUNDRY AVE., Grades: KG-5)HARRY WIRTZ ELEMENTARY Students: 598, Location: 8535 CONTRERAS ST., Grades: KG-5)THEODORE ROOSEVELT Students: 596, Location: 13451 MERKEL AVE., Grades: KG-5)LEONA JACKSON Students: 565, Location: 7220 JACKSON ST., Grades: 4-8)HOWARD TANNER Students: 546, Location: 7210 ROSECRANS AVE., Grades: KG-5)MAJOR LYNN MOKLER Students: 475, Location: 8571 E. FLOWER ST., Grades: KG-5)FRANK J. ZAMBONI Students: 453, Location: 15733 S. ORANGE AVE., Grades: 6-8)MARK KEPPEL Students: 451, Location: 6630 E. MARK KEPPEL ST., Grades: KG-5)Private elementary/middle school in Paramount: OUR LADY OF THE ROSARY SCHOOL Students: 193, Location: 14813 PARAMOUNT BLVD, Grades: KG-8)
See full list of schools located in Paramount
Notable locations in Paramount: (A) , Paramount Branch County of Los Angeles Public Library (B) , Los Angeles County Fire Department Station 31 (C) . Display/hide their locations on the map
Churches in Paramount include: (A) , First Baptist Church of Paramount (B) , Downey Avenue Foursquare Church (C) , Unshackled Ministries (D) , Paramount United Methodist Church (E) , Paramount Assembly of God Church (F) , Emmanuel Reformed Church (G) , Praise Chapel of Paramount (H) , Our Lady of the Rosary Church (I) . Display/hide their locations on the map
Parks in Paramount include: (1) , Progress Park (2) , Spane Park (3) , Steam Engine Park (4) , Village Park (5) , Pequino Park (6) , Village Park (7) . Display/hide their locations on the map
Tourist attraction:
Birthplace of: Demetrin Veal - 2005 NFL player (Denver Broncos, born : Aug 11, 1981), Kevin Kaesviharn - 2005 NFL player (Cincinnati Bengals, born : Aug 29, 1976), YG (rapper) - Rapper, Nicolle Payne - Water polo player, Charles Huerta - Boxer, Guillermo Gonzalez - Major League Soccer player (Los Angeles, born : Jan 4, 1986), Guillermo Gonzalez (soccer) - Professional soccer player, Tezarray Banks - College basketball player (Boise State Broncos).
Los Angeles County has a predicted average indoor radon screening level between 2 and 4 pCi/L (pico curies per liter) - Moderate Potential Average household size: This city:
3.9 peopleCalifornia:
2.9 people
Percentage of family households: This city:
81.8%Whole state:
68.7%
Percentage of households with unmarried partners: This city:
9.1%Whole state:
7.2%
Likely homosexual households (counted as self-reported same-sex unmarried-partner households)
Lesbian couples: 0.4% of all households Gay men: 0.4% of all households
People in group quarters in Paramount in 2010:
283 people in nursing facilities/skilled-nursing facilities
21 people in other noninstitutional facilities
6 people in group homes intended for adults
People in group quarters in Paramount in 2000:
157 people in wards in general hospitals for patients who have no usual home elsewhere
143 people in nursing homes
11 people in religious group quarters
9 people in other nonhousehold living situations
Banks with branches in Paramount (2011 data):
JPMorgan Chase Bank, National Association: 15359 Paramount Blvd Branch at 15359 Paramount Blvd, branch established on 1919/01/01; Paramount Northgate Banking Center at 16259 Paramount Blvd, branch established on 2011/11/15. Info updated 2011/11/10: Bank assets: $1,811,678.0 mil, Deposits: $1,190,738.0 mil, headquarters in Columbus, OH, positive income , International Specialization, 5577 total offices , Holding Company: Jpmorgan Chase & Co.
Wells Fargo Bank, National Association: Paramount Branch at 16230 Paramount Boulevard, Suite D, branch established on 2006/10/02. Info updated 2011/04/05: Bank assets: $1,161,490.0 mil, Deposits: $905,653.0 mil, headquarters in Sioux Falls, SD, positive income , 6395 total offices , Holding Company: Wells Fargo & Company
Bank of America, National Association: Paramount Branch at 15919 South Paramount Boulevard, branch established on 1937/10/11. Info updated 2009/11/18: Bank assets: $1,451,969.3 mil, Deposits: $1,077,176.8 mil, headquarters in Charlotte, NC, positive income , 5782 total offices , Holding Company: Bank Of America Corporation
Banco Popular North America: Paramount Branch at 15950 Paramount Boulevard, branch established on 1962/10/01. Info updated 2012/01/27: Bank assets: $8,605.3 mil, Deposits: $6,167.7 mil, headquarters in New York, NY, positive income , Commercial Lending Specialization, 97 total offices , Holding Company: Popular, Inc.
U.S. Bank National Association: Paramount Branch at 15943 Paramount Boulevard, branch established on 1965/02/04. Info updated 2012/01/30: Bank assets: $330,470.8 mil, Deposits: $236,091.5 mil, headquarters in Cincinnati, OH, positive income , 3121 total offices , Holding Company: U.S. Bancorp
For population 15 years and over in Paramount:
Never married: 46.4%Now married: 40.9%Separated: 2.7%Widowed: 3.7%Divorced: 6.3% For population 25 years and over in Paramount:
High school or higher: 66.1%Bachelor's degree or higher: 13.1%Graduate or professional degree: 3.4%Unemployed: 11.5%Mean travel time to work (commute): 25.4 minutes
Education Gini index (Inequality in education) Here:
22.1California average:
15.5
Religion statistics for Paramount, CA (based on Los Angeles County data)
Religion Adherents Congregations Catholic 3,542,994 275 Evangelical Protestant 814,611 3,249 Other 451,594 1,023 Mainline Protestant 229,056 860 Black Protestant 112,338 290 Orthodox 63,517 76 None 4,604,495 -
Source: Clifford Grammich, Kirk Hadaway, Richard Houseal, Dale E.Jones, Alexei Krindatch, Richie Stanley and Richard H.Taylor. 2012. 2010 U.S.Religion Census: Religious Congregations & Membership Study. Association of Statisticians of American Religious Bodies. Jones, Dale E., et al. 2002. Congregations and Membership in the United States 2000. Nashville, TN: Glenmary Research Center. Graphs represent county-level data
Food Environment Statistics: Number of grocery stores : 2,084This county :
2.12 / 10,000 pop.California :
2.14 / 10,000 pop.
Number of supercenters and club stores : 32This county :
0.03 / 10,000 pop.State :
0.04 / 10,000 pop.
Number of convenience stores (no gas) : 567This county :
0.58 / 10,000 pop.State :
0.62 / 10,000 pop.
Number of convenience stores (with gas) : 1,206Los Angeles County :
1.23 / 10,000 pop.State :
1.49 / 10,000 pop.
Number of full-service restaurants : 7,008This county :
7.15 / 10,000 pop.California :
7.42 / 10,000 pop.
Adult diabetes rate : Los Angeles County :
7.5%State :
7.3%
Low-income preschool obesity rate : Health and Nutrition: Healthy diet rate : This city:
45.5%California:
49.4%
Average overall health of teeth and gums : This city:
45.6%State:
48.0%
Average BMI : This city:
28.5California:
28.1
People feeling badly about themselves : This city:
22.7%State:
20.2%
People not drinking alcohol at all : This city:
10.9%State:
11.2%
Average hours sleeping at night : Overweight people : Paramount:
30.3%State:
31.5%
General health condition : This city:
54.1%California:
56.4%
Average condition of hearing : This city:
82.4%California:
80.9%
More about Health and Nutrition of Paramount, CA Residents
Local government employment and payroll (March 2022)
Function
Full-time employees
Monthly full-time payroll
Average yearly full-time wage
Part-time employees
Monthly part-time payroll
Other and Unallocable
38 $238,685 $75,374 35 $63,659 Financial Administration
12 $92,236 $92,236 6 $14,893 Parks and Recreation
10 $69,181 $83,017 81 $149,557 Water Supply
9 $55,089 $73,452 4 $8,352 Other Government Administration
9 $89,878 $119,837 35 $51,039 Housing and Community Development (Local)
8 $66,349 $99,524 2 $3,483 Streets and Highways
4 $19,377 $58,131 3 $5,828
Totals for Government
90 $630,795 $84,106 166 $296,812
Paramount government finances - Expenditure in 2017 (per resident):
Construction - Housing and Community Development: $3,823,000 ($74.01)
Water Utilities: $1,335,000 ($25.85)Regular Highways: $811,000 ($15.70)Transit Utilities: $498,000 ($9.64)Central Staff Services: $425,000 ($8.23)Parks and Recreation: $354,000 ($6.85)Current Operations - Police Protection: $10,645,000 ($206.09)
Central Staff Services: $7,031,000 ($136.12)Water Utilities: $6,599,000 ($127.76)Regular Highways: $5,607,000 ($108.55)Parks and Recreation: $4,848,000 ($93.86)Financial Administration: $1,081,000 ($20.93)Protective Inspection and Regulation - Other: $976,000 ($18.90)Transit Utilities: $301,000 ($5.83)Housing and Community Development: $196,000 ($3.79)Other Capital Outlay - Housing and Community Development: $30,000 ($0.58)
Police Protection: $6,000 ($0.12)Water Utilities - Interest on Debt: $160,000 ($3.10)
Paramount government finances - Revenue in 2017 (per resident):
Charges - Other: $521,000 ($10.09)
Parks and Recreation: $240,000 ($4.65)Regular Highways: $16,000 ($0.31)Federal Intergovernmental - Housing and Community Development: $1,031,000 ($19.96)
Other: $212,000 ($4.10)Local Intergovernmental - Other: $509,000 ($9.85)
Miscellaneous - General Revenue - Other: $1,287,000 ($24.92)
Fines and Forfeits: $822,000 ($15.91)Interest Earnings: $132,000 ($2.56)Rents: $54,000 ($1.05)Revenue - Water Utilities: $7,861,000 ($152.19)
Transit Utilities: $81,000 ($1.57)State Intergovernmental - Other: $3,108,000 ($60.17)
Highways: $1,066,000 ($20.64)General Local Government Support: $9,000 ($0.17)Tax - General Sales and Gross Receipts: $9,755,000 ($188.86)
Property: $7,730,000 ($149.65)Public Utilities Sales: $5,317,000 ($102.94)Occupation and Business License - Other: $963,000 ($18.64)Other License: $783,000 ($15.16)Documentary and Stock Transfer: $114,000 ($2.21)
Paramount government finances - Debt in 2017 (per resident):
Long Term Debt - Outstanding Unspecified Public Purpose: $5,003,000 ($96.86)
Beginning Outstanding - Unspecified Public Purpose: $4,939,000 ($95.62)Issue, Unspecified Public Purpose: $302,000 ($5.85)Retired Unspecified Public Purpose: $238,000 ($4.61)
Paramount government finances - Cash and Securities in 2017 (per resident):
Bond Funds - Cash and Securities: $1,070,000 ($20.72)
Other Funds - Cash and Securities: $23,845,000 ($461.64)
2.98% of this county's 2021 resident taxpayers lived in other counties in 2020 ($81,235 average adjusted gross income )
Here:
2.98%California average:
5.19%
0.01% of residents moved from foreign countries ($155 average AGI )Los Angeles County:
0.01%California average:
0.03%
Top counties from which taxpayers relocated into this county between 2020 and 2021:
4.68% of this county's 2020 resident taxpayers moved to other counties in 2021 ($97,324 average adjusted gross income )
Here:
4.68%California average:
6.14%
0.01% of residents moved to foreign countries ($196 average AGI )Los Angeles County:
0.01%California average:
0.02%
Top counties to which taxpayers relocated from this county between 2020 and 2021:
Businesses in Paramount, CA
Name Count Name Count
7-Eleven 1 Kincaid 1 99 Cents Only Stores 1 La-Z-Boy 1 AT&T 1 Little Caesars Pizza 2 Ace Hardware 1 McDonald's 2 Baskin-Robbins 2 Nike 3 CVS 1 Payless 2 Carl\s Jr. 2 Pizza Hut 1 Circle K 1 RadioShack 1 Curves 1 Rite Aid 1 Domino's Pizza 1 Starbucks 2 El Pollo Loco 1 Subway 2 FedEx 3 T-Mobile 2 GNC 1 T.J.Maxx 1 GameStop 1 Taco Bell 1 H&R Block 1 U-Haul 1 Home Depot 1 UPS 2 Jack In The Box 3 Walmart 1 KFC 1
Strongest AM radio stations in Paramount:
KLTX (1390 AM; 5 kW; LONG BEACH, CA; Owner: HI-FAVOR BROADCASTING, LLC)
KFI (640 AM; 50 kW; LOS ANGELES, CA; Owner: CAPSTAR TX LIMITED PARTNERSHIP)
KNX (1070 AM; 50 kW; LOS ANGELES, CA; Owner: INFINITY BROADCASTING OPERATIONS, INC.)
KFWB (980 AM; 50 kW; LOS ANGELES, CA; Owner: INFINITY BROADCASTING OPERATIONS, INC.)
KLAC (570 AM; 50 kW; LOS ANGELES, CA; Owner: AMFM RADIO LICENSES, L.L.C.)
KTNQ (1020 AM; 50 kW; LOS ANGELES, CA; Owner: KTNQ-AM LICENSE CORP.)
KXTA (1150 AM; 50 kW; LOS ANGELES, CA; Owner: CITICASTERS LICENSES, L.P.)
KMPC (1540 AM; 50 kW; LOS ANGELES, CA; Owner: ROSE CITY RADIO CORPORATION)
KBLA (1580 AM; 50 kW; SANTA MONICA, CA)
KDIS (1110 AM; 50 kW; PASADENA, CA; Owner: ABC,INC.)
KXMX (1190 AM; 25 kW; ANAHEIM, CA; Owner: NEW INSPIRATION BROADCASTING COMPANY)
KSPN (710 AM; 50 kW; LOS ANGELES, CA; Owner: KABC-AM RADIO, INC.)
KRLA (870 AM; 20 kW; GLENDALE, CA; Owner: NEW INSPIRATION BROADCASTING COMPANY)
Strongest FM radio stations in Paramount:
KBUE (105.5 FM; LONG BEACH, CA; Owner: LBI RADIO LICENSE CORP.)
KZLA-FM (93.9 FM; LOS ANGELES, CA; Owner: EMMIS RADIO LICENSE CORPORATION)
KPWR (105.9 FM; LOS ANGELES, CA; Owner: EMMIS RADIO LICENSE CORPORATION)
KLSX (97.1 FM; LOS ANGELES, CA; Owner: INFINITY BROADCASTING OPERATIONS, INC.)
KUSC (91.5 FM; LOS ANGELES, CA; Owner: UNIVERSITY OF SOUTHERN CALIFORNIA)
KKLA-FM (99.5 FM; LOS ANGELES, CA; Owner: NEW INSPIRATION BROADCASTING CO., INC.)
KKBT (100.3 FM; LOS ANGELES, CA; Owner: RADIO ONE LICENSES, LLC)
KRTH-FM (101.1 FM; LOS ANGELES, CA; Owner: INFINITY BROADCASTING OPERATIONS, INC.)
KCBS-FM (93.1 FM; LOS ANGELES, CA; Owner: INFINITY BROADCASTING OPERATIONS, INC.)
KSCA (101.9 FM; GLENDALE, CA; Owner: HBC LICENSE CORPORATION)
KLOS (95.5 FM; LOS ANGELES, CA; Owner: KLOS-FM RADIO, INC.)
K212FA (90.3 FM; TEMPLE CITY, CA; Owner: EDUCATIONAL MEDIA FOUNDATION)
KOST (103.5 FM; LOS ANGELES, CA; Owner: CAPSTAR TX LIMITED PARTNERSHIP)
KLAX-FM (97.9 FM; EAST LOS ANGELES, CA; Owner: KLAX LICENSING, INC.)
KIIS-FM (102.7 FM; LOS ANGELES, CA; Owner: CITICASTERS LICENSES, L.P.)
KLVE (107.5 FM; LOS ANGELES, CA; Owner: KLVE-FM LICENSE CORP.)
KPCC (89.3 FM; PASADENA, CA; Owner: PASADENA AREA COMMUNITY COLLEGE DISTRICT)
KHHT (92.3 FM; LOS ANGELES, CA; Owner: AMFM RADIO LICENSES, L.L.C.)
KBIG-FM (104.3 FM; LOS ANGELES, CA; Owner: AMFM RADIO LICENSES, L.L.C.)
KMZT-FM (105.1 FM; LOS ANGELES, CA; Owner: MOUNT WILSON FM BROADCASTERS, INC.)
TV broadcast stations around Paramount:
KTRO-LP (Channel 50; LANCASTER, CA; Owner: ROBERT D. ADELMAN)
KCBS-TV (Channel 2; LOS ANGELES, CA; Owner: CBS BROADCASTING INC.)
KTLA-TV (Channel 5; LOS ANGELES, CA; Owner: KTLA INC.)
KABC-TV (Channel 7; LOS ANGELES, CA; Owner: ABC HOLDING COMPANY, INC.)
KCAL-TV (Channel 9; LOS ANGELES, CA; Owner: VIACOM TELEVISION STATIONS GROUP OF LOS ANGELES LLC)
KNBC (Channel 4; LOS ANGELES, CA; Owner: NBC SUBSIDIARY (KNBC-TV), INC.)
KMEX-TV (Channel 34; LOS ANGELES, CA; Owner: KMEX LICENSE PARTNERSHIP, G.P.)
KAZA-TV (Channel 54; AVALON, CA; Owner: PAPPAS SOUTHERN CALIFORNIA LICENSE LLC)
KDOC-TV (Channel 56; ANAHEIM, CA; Owner: GOLDEN ORANGE BROADCASTING CO., INC.)
KOCE-TV (Channel 50; HUNTINGTON BEACH, CA; Owner: BD. OF TRUSTEES, COAST COMMUNITY COLLEGE DIST.)
KSCI (Channel 18; LONG BEACH, CA; Owner: KSLS, INC.)
KXLA (Channel 44; RANCHO PALOS VERDES, CA; Owner: RANCHO PALOS VERDES BROADCASTERS, INC.)
KCET (Channel 28; LOS ANGELES, CA; Owner: COMMUNITY TELEVISION OF SOUTHERN CALIFORNIA)
KFTR (Channel 46; ONTARIO, CA; Owner: TELEFUTURA LOS ANGELES LLC)
Home Mortgage Disclosure Act Aggregated Statistics For Year 2009(Based on 10 full tracts) A) FHA, FSA/RHS & VA B) Conventional C) Refinancings D) Home Improvement Loans E) Loans on Dwellings For 5+ Families F) Non-occupant Loans on G) Loans On Manufactured Number Average Value Number Average Value Number Average Value Number Average Value Number Average Value Number Average Value Number Average Value
LOANS ORIGINATED 184 $203,967 81 $166,815 173 $204,965 13 $145,231 7 $918,143 34 $173,971 11 $81,545 APPLICATIONS APPROVED, NOT ACCEPTED 32 $206,594 21 $149,476 36 $214,278 5 $76,600 0 $0 7 $191,571 11 $66,455 APPLICATIONS DENIED 53 $189,981 31 $120,968 179 $209,665 24 $74,583 1 $800,000 19 $132,632 13 $59,923 APPLICATIONS WITHDRAWN 28 $173,643 23 $157,783 75 $227,333 8 $124,750 0 $0 11 $211,818 0 $0 FILES CLOSED FOR INCOMPLETENESS 11 $212,091 9 $131,111 30 $239,167 2 $80,500 0 $0 5 $229,800 1 $101,000
Aggregated Statistics For Year 2008(Based on 10 full tracts) A) FHA, FSA/RHS & VA B) Conventional C) Refinancings D) Home Improvement Loans E) Loans on Dwellings For 5+ Families F) Non-occupant Loans on G) Loans On Manufactured Number Average Value Number Average Value Number Average Value Number Average Value Number Average Value Number Average Value Number Average Value
LOANS ORIGINATED 73 $234,644 113 $221,805 246 $251,224 45 $169,022 10 $2,134,400 53 $250,642 7 $50,143 APPLICATIONS APPROVED, NOT ACCEPTED 7 $242,000 42 $208,690 116 $246,931 13 $110,308 0 $0 7 $236,429 18 $87,833 APPLICATIONS DENIED 30 $238,033 79 $191,987 406 $278,983 56 $132,375 4 $929,250 39 $248,077 26 $82,500 APPLICATIONS WITHDRAWN 16 $274,000 34 $200,971 108 $266,824 12 $138,083 0 $0 12 $295,167 0 $0 FILES CLOSED FOR INCOMPLETENESS 4 $272,000 10 $343,300 37 $302,108 4 $296,500 0 $0 4 $276,750 0 $0
Aggregated Statistics For Year 2007(Based on 10 full tracts) A) FHA, FSA/RHS & VA B) Conventional C) Refinancings D) Home Improvement Loans E) Loans on Dwellings For 5+ Families F) Non-occupant Loans on G) Loans On Manufactured Number Average Value Number Average Value Number Average Value Number Average Value Number Average Value Number Average Value Number Average Value
LOANS ORIGINATED 4 $292,250 332 $231,554 744 $282,952 93 $192,344 30 $1,710,567 99 $292,283 34 $86,529 APPLICATIONS APPROVED, NOT ACCEPTED 0 $0 107 $266,000 244 $291,594 24 $234,542 1 $400,000 27 $325,185 11 $64,182 APPLICATIONS DENIED 0 $0 219 $283,073 707 $303,201 148 $141,527 6 $729,000 85 $318,118 32 $74,688 APPLICATIONS WITHDRAWN 1 $323,000 70 $246,143 282 $305,709 47 $184,213 2 $860,000 32 $254,812 2 $107,000 FILES CLOSED FOR INCOMPLETENESS 0 $0 34 $300,294 103 $329,495 8 $258,625 1 $510,000 8 $339,375 0 $0
Aggregated Statistics For Year 2006(Based on 10 full tracts) A) FHA, FSA/RHS & VA B) Conventional C) Refinancings D) Home Improvement Loans E) Loans on Dwellings For 5+ Families F) Non-occupant Loans on G) Loans On Manufactured Number Average Value Number Average Value Number Average Value Number Average Value Number Average Value Number Average Value Number Average Value
LOANS ORIGINATED 5 $296,800 812 $229,113 1,201 $264,216 186 $200,780 14 $931,643 179 $278,676 16 $84,875 APPLICATIONS APPROVED, NOT ACCEPTED 0 $0 196 $217,056 332 $267,717 32 $212,719 0 $0 49 $272,857 19 $81,105 APPLICATIONS DENIED 0 $0 422 $230,704 737 $281,073 164 $147,000 1 $1,275,000 66 $284,909 38 $74,711 APPLICATIONS WITHDRAWN 3 $252,667 221 $241,548 460 $280,117 57 $173,526 0 $0 45 $267,311 4 $93,250 FILES CLOSED FOR INCOMPLETENESS 0 $0 42 $239,429 99 $273,010 8 $253,625 0 $0 4 $343,750 0 $0
Aggregated Statistics For Year 2005(Based on 10 full tracts) A) FHA, FSA/RHS & VA B) Conventional C) Refinancings D) Home Improvement Loans E) Loans on Dwellings For 5+ Families F) Non-occupant Loans on G) Loans On Manufactured Number Average Value Number Average Value Number Average Value Number Average Value Number Average Value Number Average Value Number Average Value
LOANS ORIGINATED 12 $250,667 814 $197,563 1,520 $236,075 186 $173,323 28 $1,214,750 180 $255,633 26 $70,962 APPLICATIONS APPROVED, NOT ACCEPTED 0 $0 218 $184,853 327 $229,205 25 $146,120 0 $0 57 $255,386 44 $72,795 APPLICATIONS DENIED 0 $0 379 $214,892 655 $247,246 127 $134,520 1 $265,000 87 $264,540 42 $77,952 APPLICATIONS WITHDRAWN 0 $0 224 $206,772 538 $238,829 47 $182,702 1 $250,000 61 $253,262 19 $95,684 FILES CLOSED FOR INCOMPLETENESS 0 $0 45 $217,733 148 $237,324 4 $110,750 0 $0 7 $273,857 0 $0
Aggregated Statistics For Year 2004(Based on 10 full tracts) A) FHA, FSA/RHS & VA B) Conventional C) Refinancings D) Home Improvement Loans E) Loans on Dwellings For 5+ Families F) Non-occupant Loans on G) Loans On Manufactured Number Average Value Number Average Value Number Average Value Number Average Value Number Average Value Number Average Value Number Average Value
LOANS ORIGINATED 39 $222,026 934 $164,594 1,559 $189,047 163 $143,540 28 $1,431,821 216 $211,667 20 $64,550 APPLICATIONS APPROVED, NOT ACCEPTED 1 $256,000 245 $177,567 323 $193,458 25 $147,960 2 $941,000 69 $209,435 22 $67,045 APPLICATIONS DENIED 4 $269,500 323 $174,015 634 $187,962 140 $101,857 5 $262,800 77 $217,351 30 $71,700 APPLICATIONS WITHDRAWN 9 $226,444 207 $174,116 445 $194,407 49 $123,265 2 $900,000 36 $203,667 8 $56,875 FILES CLOSED FOR INCOMPLETENESS 0 $0 25 $156,920 240 $206,058 13 $115,846 0 $0 13 $227,308 1 $79,000
Aggregated Statistics For Year 2003(Based on 10 full tracts) A) FHA, FSA/RHS & VA B) Conventional C) Refinancings D) Home Improvement Loans E) Loans on Dwellings For 5+ Families F) Non-occupant Loans on Number Average Value Number Average Value Number Average Value Number Average Value Number Average Value Number Average Value
LOANS ORIGINATED 95 $171,558 678 $131,830 1,744 $151,175 43 $67,884 26 $987,808 165 $169,885 APPLICATIONS APPROVED, NOT ACCEPTED 13 $166,615 173 $148,104 306 $157,879 11 $49,636 1 $275,000 54 $184,185 APPLICATIONS DENIED 13 $175,077 252 $134,321 747 $155,070 70 $37,629 0 $0 62 $158,226 APPLICATIONS WITHDRAWN 22 $181,545 136 $141,176 484 $151,390 12 $73,167 3 $409,333 31 $152,419 FILES CLOSED FOR INCOMPLETENESS 8 $172,625 27 $160,148 82 $146,232 5 $47,200 0 $0 8 $113,375
Aggregated Statistics For Year 1999(Based on 3 full and 2 partial tracts) A) FHA, FSA/RHS & VA B) Conventional C) Refinancings D) Home Improvement Loans E) Loans on Dwellings For 5+ Families F) Non-occupant Loans on Number Average Value Number Average Value Number Average Value Number Average Value Number Average Value Number Average Value
LOANS ORIGINATED 261 $118,862 217 $92,264 317 $112,353 53 $15,479 15 $426,431 61 $102,714 APPLICATIONS APPROVED, NOT ACCEPTED 18 $112,995 38 $88,207 87 $100,869 31 $26,956 2 $102,995 8 $81,798 APPLICATIONS DENIED 67 $129,786 111 $75,835 285 $93,865 65 $17,809 7 $517,970 16 $101,004 APPLICATIONS WITHDRAWN 44 $127,029 54 $112,506 139 $103,947 2 $85,715 5 $362,436 13 $109,855 FILES CLOSED FOR INCOMPLETENESS 13 $138,988 12 $119,286 66 $122,871 5 $41,668 3 $666,810 9 $114,856
Detailed mortgage data for all 10 tracts in Paramount, CA
Private Mortgage Insurance Companies Aggregated Statistics For Year 2009(Based on 9 full tracts) A) Conventional B) Refinancings C) Non-occupant Loans on Number Average Value Number Average Value Number Average Value
LOANS ORIGINATED 13 $194,308 1 $229,000 0 $0 APPLICATIONS APPROVED, NOT ACCEPTED 14 $249,714 1 $338,000 1 $185,000 APPLICATIONS DENIED 4 $128,500 0 $0 0 $0 APPLICATIONS WITHDRAWN 0 $0 0 $0 0 $0 FILES CLOSED FOR INCOMPLETENESS 1 $169,000 1 $366,000 1 $169,000
Aggregated Statistics For Year 2008(Based on 10 full tracts) A) Conventional B) Refinancings C) Non-occupant Loans on Number Average Value Number Average Value Number Average Value
LOANS ORIGINATED 47 $265,021 23 $325,522 4 $217,250 APPLICATIONS APPROVED, NOT ACCEPTED 47 $324,894 24 $360,917 3 $254,667 APPLICATIONS DENIED 14 $277,714 4 $356,500 3 $174,333 APPLICATIONS WITHDRAWN 3 $197,333 3 $379,667 0 $0 FILES CLOSED FOR INCOMPLETENESS 4 $299,750 1 $528,000 2 $381,000
Aggregated Statistics For Year 2007(Based on 10 full tracts) A) Conventional B) Refinancings Number Average Value Number Average Value
LOANS ORIGINATED 31 $353,161 45 $346,222 APPLICATIONS APPROVED, NOT ACCEPTED 3 $421,667 18 $365,222 APPLICATIONS DENIED 3 $292,667 2 $356,000 APPLICATIONS WITHDRAWN 2 $282,000 4 $372,750 FILES CLOSED FOR INCOMPLETENESS 0 $0 0 $0
Aggregated Statistics For Year 2006(Based on 9 full tracts) A) Conventional B) Refinancings C) Non-occupant Loans on Number Average Value Number Average Value Number Average Value
LOANS ORIGINATED 9 $305,556 24 $365,667 1 $257,000 APPLICATIONS APPROVED, NOT ACCEPTED 7 $321,857 12 $342,750 2 $277,500 APPLICATIONS DENIED 2 $395,000 3 $380,000 0 $0 APPLICATIONS WITHDRAWN 0 $0 10 $394,100 2 $513,000 FILES CLOSED FOR INCOMPLETENESS 0 $0 0 $0 0 $0
Aggregated Statistics For Year 2005(Based on 10 full tracts) A) Conventional B) Refinancings C) Non-occupant Loans on Number Average Value Number Average Value Number Average Value
LOANS ORIGINATED 16 $318,938 29 $294,138 2 $236,500 APPLICATIONS APPROVED, NOT ACCEPTED 8 $281,750 6 $304,000 1 $230,000 APPLICATIONS DENIED 1 $310,000 2 $292,000 1 $194,000 APPLICATIONS WITHDRAWN 0 $0 1 $333,000 0 $0 FILES CLOSED FOR INCOMPLETENESS 0 $0 0 $0 0 $0
Aggregated Statistics For Year 2004(Based on 10 full tracts) A) Conventional B) Refinancings C) Non-occupant Loans on Number Average Value Number Average Value Number Average Value
LOANS ORIGINATED 63 $242,286 31 $208,871 3 $320,000 APPLICATIONS APPROVED, NOT ACCEPTED 25 $217,920 15 $173,400 0 $0 APPLICATIONS DENIED 1 $230,000 0 $0 0 $0 APPLICATIONS WITHDRAWN 5 $210,200 6 $238,500 2 $245,000 FILES CLOSED FOR INCOMPLETENESS 1 $214,000 0 $0 0 $0
Aggregated Statistics For Year 2003(Based on 10 full tracts) A) Conventional B) Refinancings C) Non-occupant Loans on Number Average Value Number Average Value Number Average Value
LOANS ORIGINATED 131 $181,053 84 $174,702 2 $171,500 APPLICATIONS APPROVED, NOT ACCEPTED 38 $170,079 29 $185,414 4 $150,000 APPLICATIONS DENIED 6 $177,667 1 $189,000 3 $181,667 APPLICATIONS WITHDRAWN 10 $178,900 6 $169,333 2 $126,500 FILES CLOSED FOR INCOMPLETENESS 0 $0 0 $0 0 $0
Aggregated Statistics For Year 1999(Based on 3 full and 2 partial tracts) A) Conventional B) Refinancings C) Non-occupant Loans on Number Average Value Number Average Value Number Average Value
LOANS ORIGINATED 49 $123,207 58 $135,383 3 $102,573 APPLICATIONS APPROVED, NOT ACCEPTED 12 $128,063 18 $135,767 0 $0 APPLICATIONS DENIED 5 $83,712 4 $185,035 0 $0 APPLICATIONS WITHDRAWN 1 $97,910 3 $132,137 0 $0 FILES CLOSED FOR INCOMPLETENESS 0 $0 2 $109,300 0 $0
Most common first names in Paramount, CA among deceased individuals Name Count Lived (average)
John 166 73.0 years William 136 72.9 years Mary 125 77.3 years Robert 103 65.2 years George 101 73.5 years Charles 90 71.9 years James 89 66.8 years Maria 83 73.2 years Helen 72 76.0 years Dorothy 55 75.1 years
Most common last names in Paramount, CA among deceased individuals Last name Count Lived (average)
Smith 70 73.1 years Johnson 56 72.1 years Garcia 52 71.0 years Brown 36 70.0 years Martinez 33 74.1 years Jones 31 71.0 years Thompson 31 73.6 years Davis 31 72.7 years Williams 30 72.4 years Miller 29 76.0 years
Paramount compared to California state average:
Hispanic race population percentage above state average. Length of stay since moving in significantly above state average. Percentage of population with a bachelor's degree or higher below state average.
#6 on the list of "Top 101 cities with the least people having Master's or Doctorate degrees (population 50,000+)"
#11 on the list of "Top 100 least-educated cities (pop. 50,000+)"
#20 on the list of "Top 101 cities with largest percentage of females in industries: transportation and warehousing (population 50,000+)"
#20 on the list of "Top 101 cities with fewest building permits per 10,000 residents (population 50,000+)"
#21 on the list of "Top 101 cities with largest percentage of males in industries: other services, except public administration (population 50,000+)"
#23 on the list of "Top 101 cities with largest percentage of females in occupations: transportation occupations (population 50,000+)"
#27 on the list of "Top 101 cities with largest percentage of females in industries: administrative and support and waste management services (population 50,000+)"
#27 on the list of "Top 101 cities with largest percentage of males in occupations: production occupations (population 50,000+)"
#28 on the list of "Top 100 cities with smallest houses (pop. 50,000+)"
#30 on the list of "Top 101 cities with the lowest percentage of English-only speaking households, population 50,000+"
#31 on the list of "Top 101 cities with largest percentage of males in industries: transportation and warehousing (population 50,000+)"
#33 on the list of "Top 101 cities with largest percentage of males in occupations: transportation occupations (population 50,000+)"
#34 on the list of "Top 101 cities with the least people having Doctorate degrees (population 50,000+)"
#37 on the list of "Top 101 cities with largest percentage of females in occupations: material moving occupations (population 50,000+)"
#41 on the list of "Top 101 cities with the least people having professional degrees (population 50,000+)"
#42 on the list of "Top 101 cities with the most cars per house, population 50,000+"
#43 on the list of "Top 101 cities with the highest ratio of murders to rapes between 2002 and 2012 (population 50,000+)"
#44 on the list of "Top 101 cities with largest percentage of females in industries: manufacturing (population 50,000+)"
#46 on the list of "Top 101 cities with the highest number of auto thefts per 100,000 residents, excludes tourist destinations and others with a lot of outsiders visiting based on city industries data (population 50,000+)"
#54 on the list of "Top 101 cities with largest percentage of males in occupations: material moving occupations (population 50,000+)"
#79 (90723) on the list of "Top 101 zip codes with the largest percentage of Arab first ancestries (pop 5,000+)"
#1 on the list of "Top 101 counties with the most Evangelical Protestant congregations"
#1 on the list of "Top 101 counties with the most Mainline Protestant congregations"
#1 on the list of "Top 101 counties with the most Orthodox adherents"
#1 on the list of "Top 101 counties with the highest ground withdrawal of fresh water for public supply (pop. 50,000+)"
#1 on the list of "Top 101 counties with the most Catholic adherents (pop. 50,000+)"
Top Patent Applicants
Eduardo Jimenez (6)
Dan Blom (6)
Huisok Pyon (5)
Anand Kapoor (3)
Latif Mahjoob (2)
Jose A. Rodriguez (2)
Aluizio M. Cruz (2)
Michael Joseph Chudilowsky (1)
Diana Garcia (1)
Eitam Scharf (1)
Total of 45 patent applications in 2008-2024.
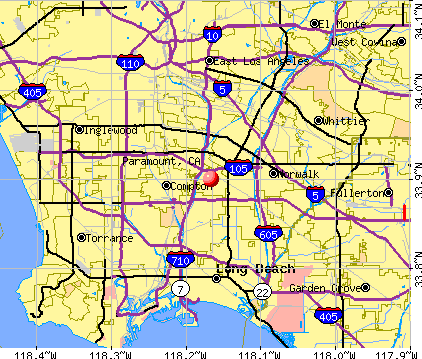


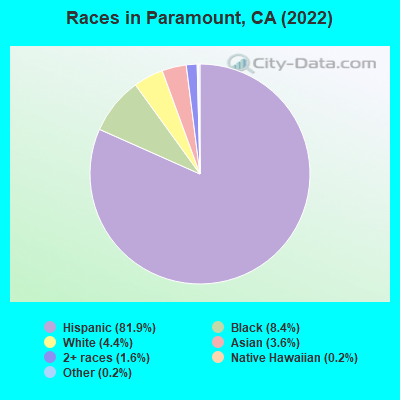
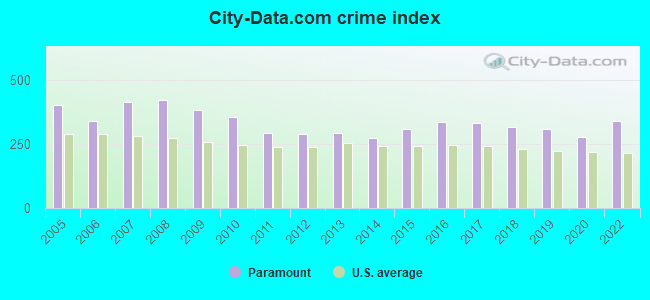
 Recent articles from our blog. Our writers, many of them Ph.D. graduates or candidates, create easy-to-read articles on a wide variety of topics.

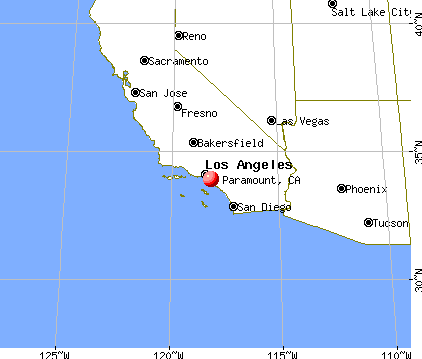
 (6.6 miles
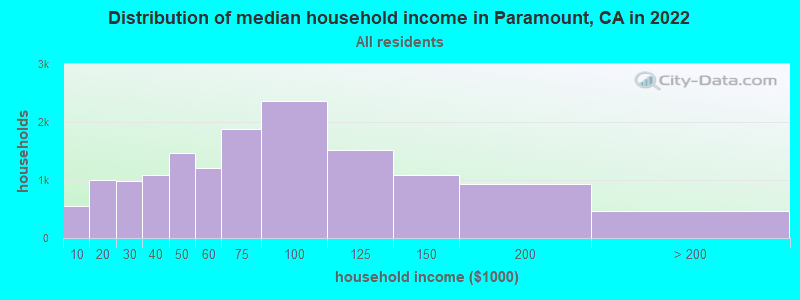
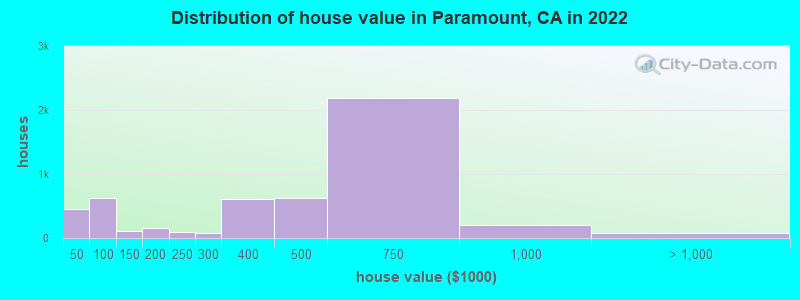
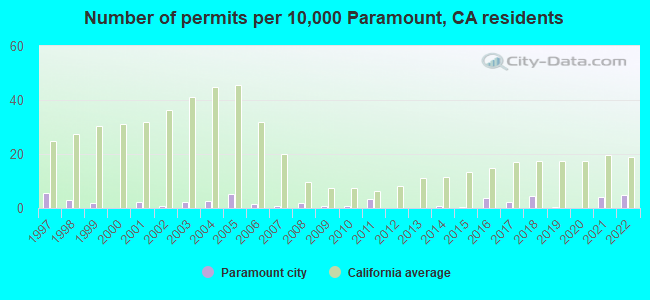
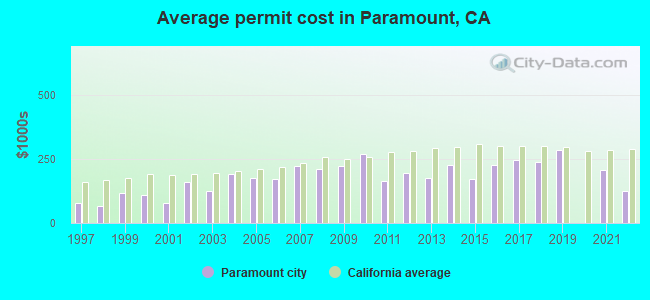
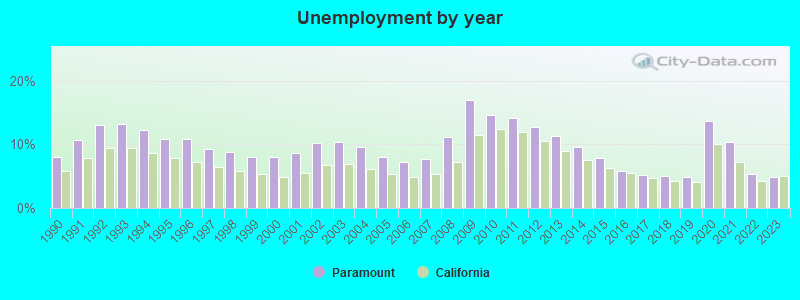
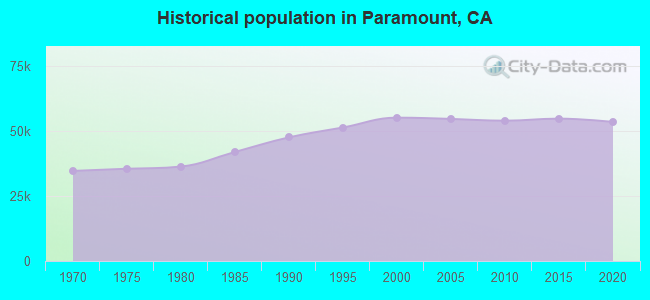
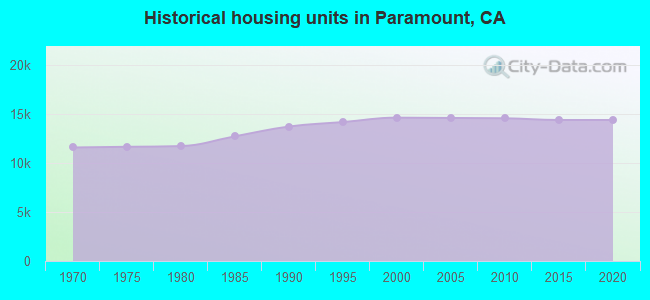
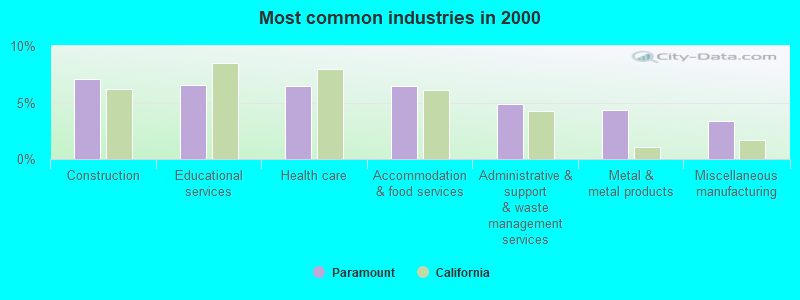
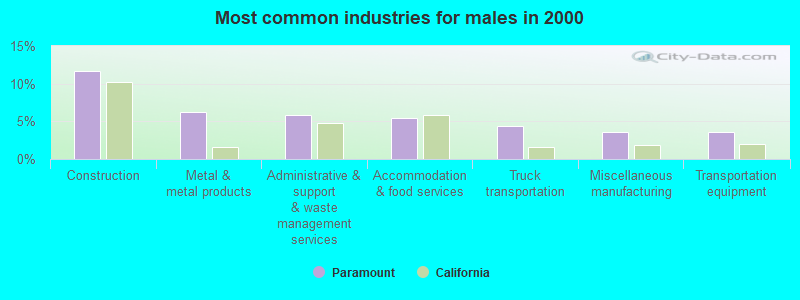
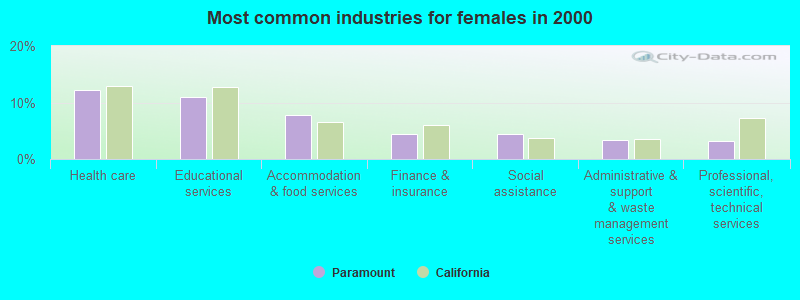
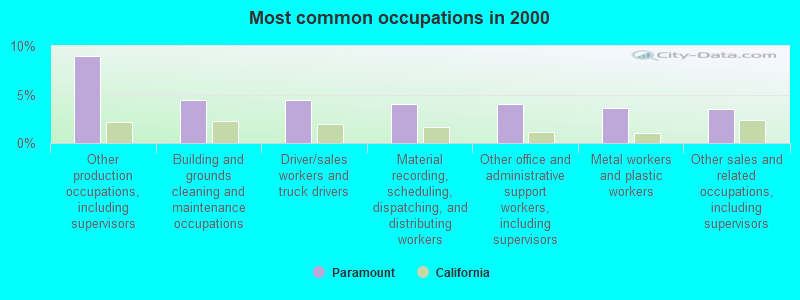
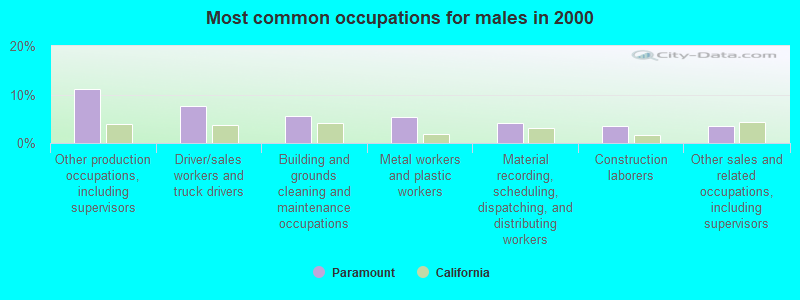
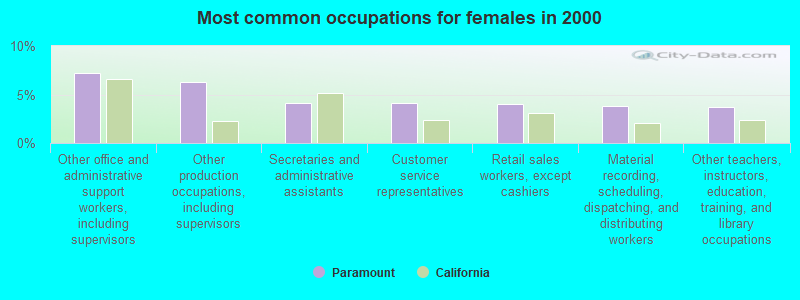
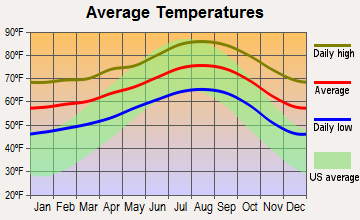
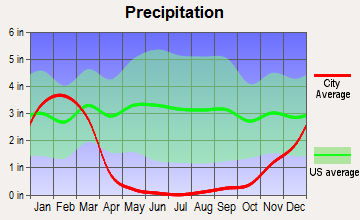
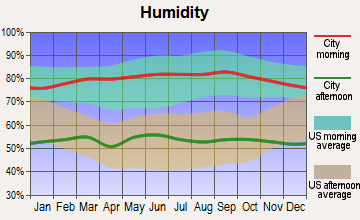
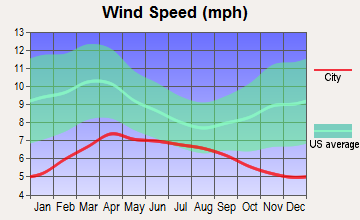
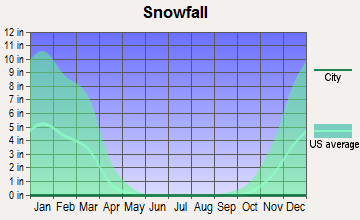
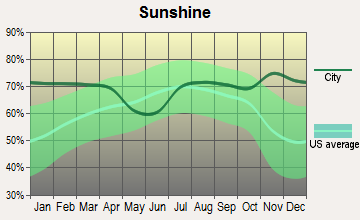
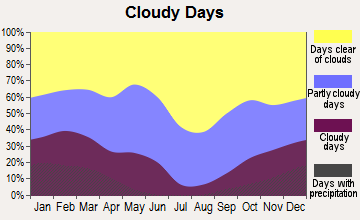


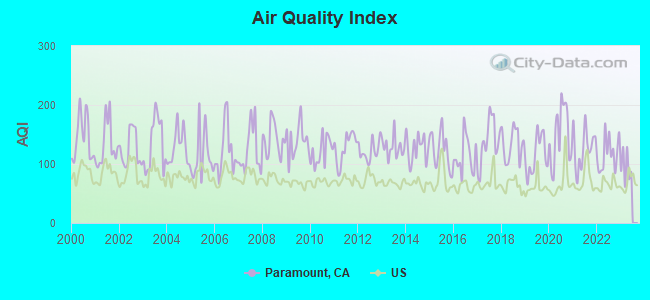
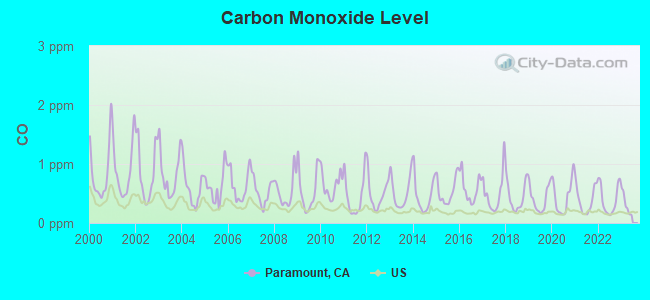
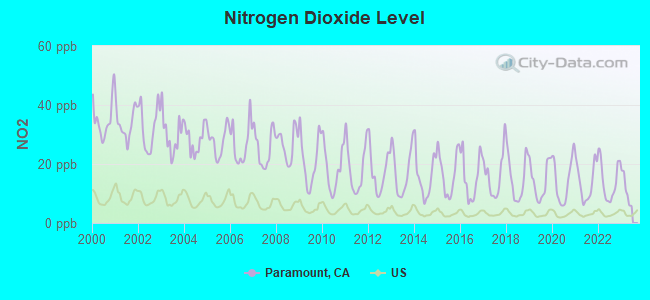
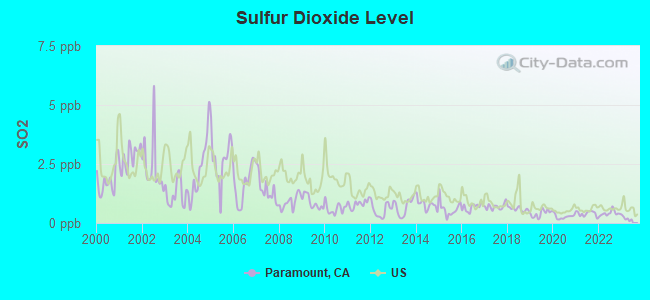
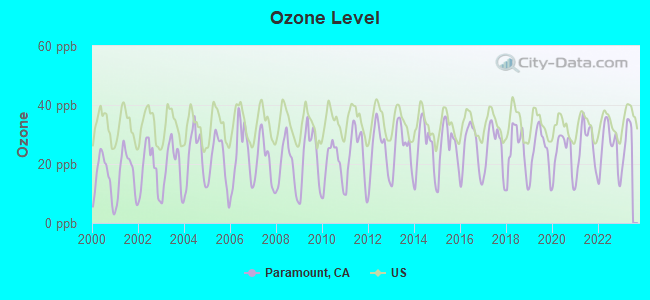
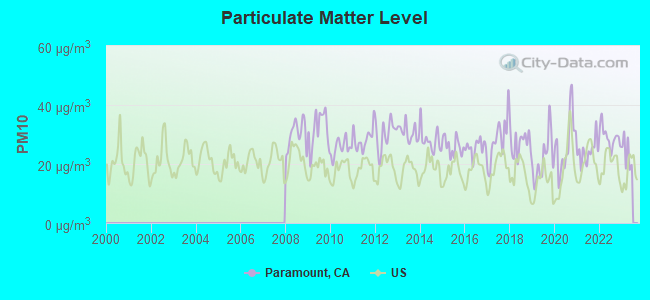
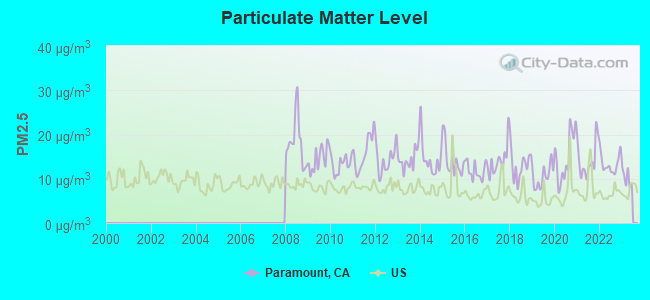

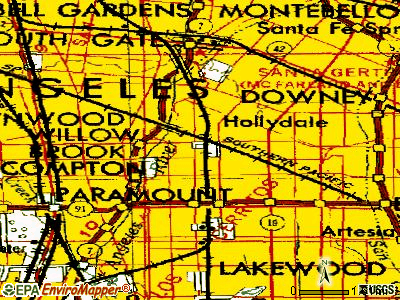
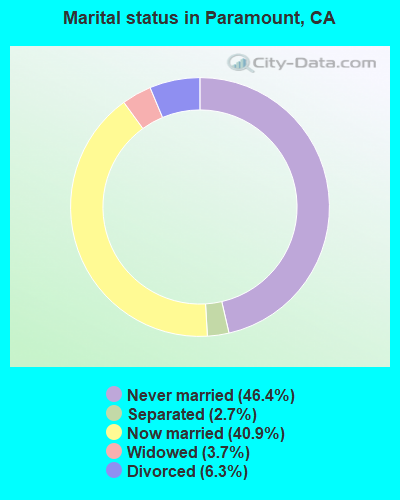
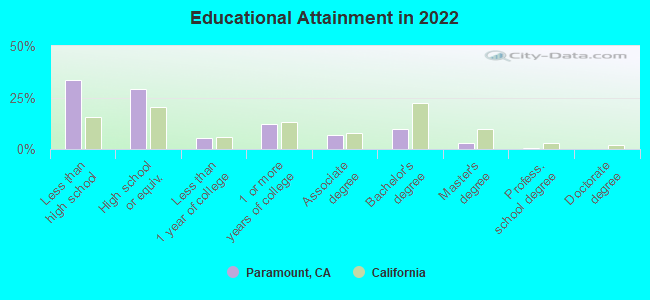
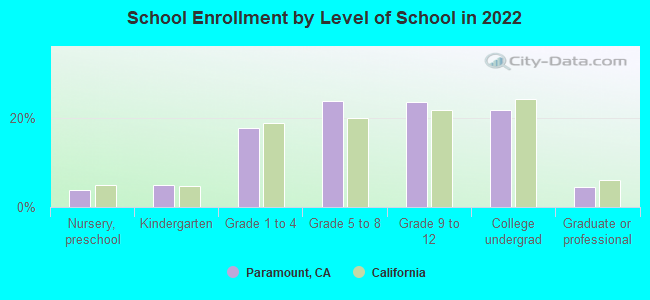
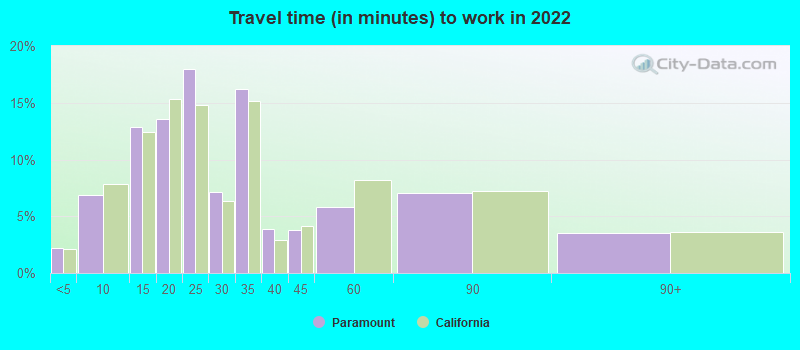
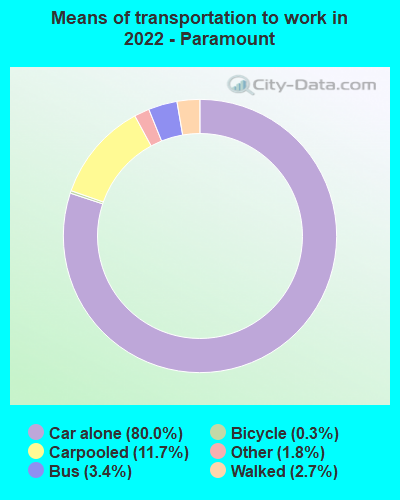


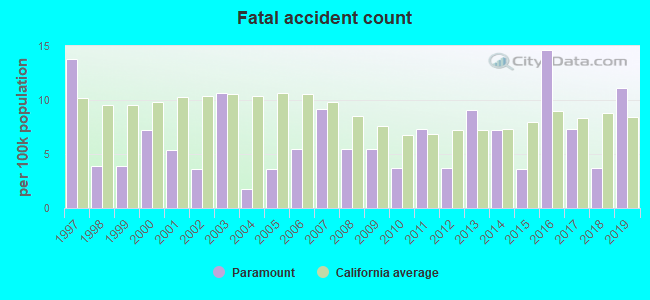
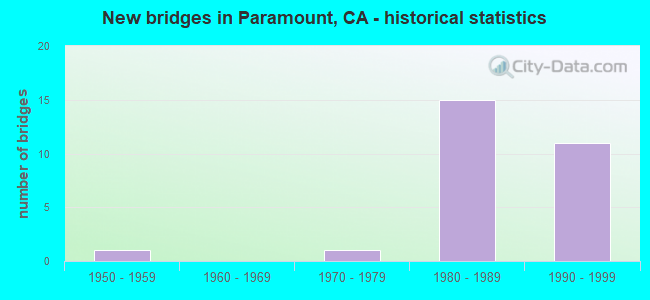
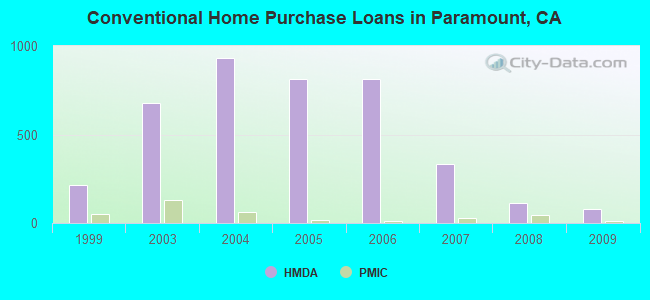
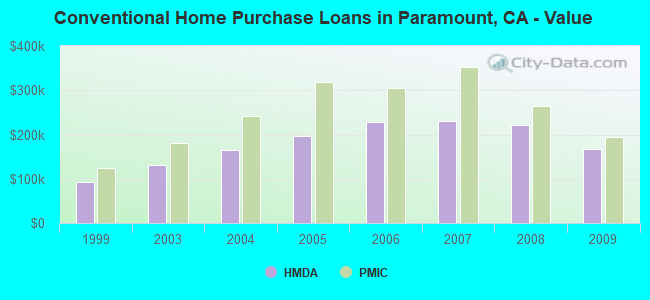
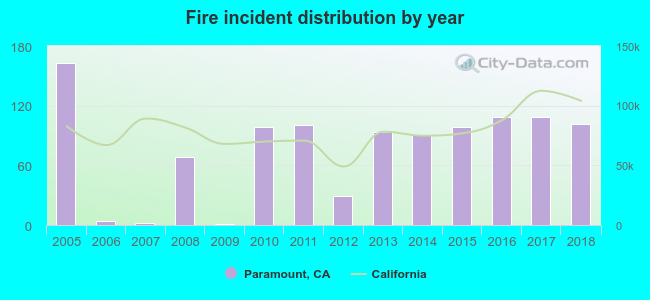 According to the data from the years 2005 - 2018 the average number of fires per year is 77. The highest number of fire incidents - 163 took place in 2005, and the least - 1 in 2009. The data has a decreasing trend.
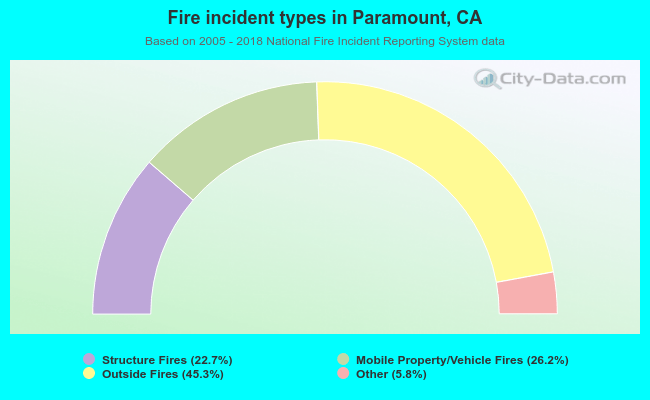 When looking into fire subcategories, the most incidents belonged to: Outside Fires (45.3%), and Mobile Property/Vehicle Fires (26.2%).