Mission, Texas Submit your own pictures of this city and show them to the world
OSM Map
General Map
Google Map
MSN Map
OSM Map
General Map
Google Map
MSN Map
OSM Map
General Map
Google Map
MSN Map
OSM Map
General Map
Google Map
MSN Map
Please wait while loading the map...
Population in 2022: 86,635 (98% urban, 2% rural). Population change since 2000: +90.8%Males: 42,490 Females: 44,145
March 2022 cost of living index in Mission: 81.6 (low, U.S. average is 100) Percentage of residents living in poverty in 2022: 20.1%for White Non-Hispanic residents , 25.4% for Black residents , 20.6% for Hispanic or Latino residents , 24.0% for American Indian residents , 29.3% for other race residents , 21.5% for two or more races residents )
Profiles of local businesses
Business Search - 14 Million verified businesses
Data:
Median household income ($)
Median household income (% change since 2000)
Household income diversity
Ratio of average income to average house value (%)
Ratio of average income to average rent
Median household income ($) - White
Median household income ($) - Black or African American
Median household income ($) - Asian
Median household income ($) - Hispanic or Latino
Median household income ($) - American Indian and Alaska Native
Median household income ($) - Multirace
Median household income ($) - Other Race
Median household income for houses/condos with a mortgage ($)
Median household income for apartments without a mortgage ($)
Races - White alone (%)
Races - White alone (% change since 2000)
Races - Black alone (%)
Races - Black alone (% change since 2000)
Races - American Indian alone (%)
Races - American Indian alone (% change since 2000)
Races - Asian alone (%)
Races - Asian alone (% change since 2000)
Races - Hispanic (%)
Races - Hispanic (% change since 2000)
Races - Native Hawaiian and Other Pacific Islander alone (%)
Races - Native Hawaiian and Other Pacific Islander alone (% change since 2000)
Races - Two or more races (%)
Races - Two or more races (% change since 2000)
Races - Other race alone (%)
Races - Other race alone (% change since 2000)
Racial diversity
Unemployment (%)
Unemployment (% change since 2000)
Unemployment (%) - White
Unemployment (%) - Black or African American
Unemployment (%) - Asian
Unemployment (%) - Hispanic or Latino
Unemployment (%) - American Indian and Alaska Native
Unemployment (%) - Multirace
Unemployment (%) - Other Race
Population density (people per square mile)
Population - Males (%)
Population - Females (%)
Population - Males (%) - White
Population - Males (%) - Black or African American
Population - Males (%) - Asian
Population - Males (%) - Hispanic or Latino
Population - Males (%) - American Indian and Alaska Native
Population - Males (%) - Multirace
Population - Males (%) - Other Race
Population - Females (%) - White
Population - Females (%) - Black or African American
Population - Females (%) - Asian
Population - Females (%) - Hispanic or Latino
Population - Females (%) - American Indian and Alaska Native
Population - Females (%) - Multirace
Population - Females (%) - Other Race
Coronavirus confirmed cases (Jun 07, 2024)
Deaths caused by coronavirus (Jun 07, 2024)
Coronavirus confirmed cases (per 100k population) (Jun 07, 2024)
Deaths caused by coronavirus (per 100k population) (Jun 07, 2024)
Daily increase in number of cases (Jun 07, 2024)
Weekly increase in number of cases (Jun 07, 2024)
Cases doubled (in days) (Jun 07, 2024)
Hospitalized patients (Apr 18, 2022)
Negative test results (Apr 18, 2022)
Total test results (Apr 18, 2022)
COVID Vaccine doses distributed (per 100k population) (Sep 19, 2023)
COVID Vaccine doses administered (per 100k population) (Sep 19, 2023)
COVID Vaccine doses distributed (Sep 19, 2023)
COVID Vaccine doses administered (Sep 19, 2023)
Likely homosexual households (%)
Likely homosexual households (% change since 2000)
Likely homosexual households - Lesbian couples (%)
Likely homosexual households - Lesbian couples (% change since 2000)
Likely homosexual households - Gay men (%)
Likely homosexual households - Gay men (% change since 2000)
Cost of living index
Median gross rent ($)
Median contract rent ($)
Median monthly housing costs ($)
Median house or condo value ($)
Median house or condo value ($ change since 2000)
Mean house or condo value by units in structure - 1, detached ($)
Mean house or condo value by units in structure - 1, attached ($)
Mean house or condo value by units in structure - 2 ($)
Mean house or condo value by units in structure by units in structure - 3 or 4 ($)
Mean house or condo value by units in structure - 5 or more ($)
Mean house or condo value by units in structure - Boat, RV, van, etc. ($)
Mean house or condo value by units in structure - Mobile home ($)
Median house or condo value ($) - White
Median house or condo value ($) - Black or African American
Median house or condo value ($) - Asian
Median house or condo value ($) - Hispanic or Latino
Median house or condo value ($) - American Indian and Alaska Native
Median house or condo value ($) - Multirace
Median house or condo value ($) - Other Race
Median resident age
Resident age diversity
Median resident age - Males
Median resident age - Females
Median resident age - White
Median resident age - Black or African American
Median resident age - Asian
Median resident age - Hispanic or Latino
Median resident age - American Indian and Alaska Native
Median resident age - Multirace
Median resident age - Other Race
Median resident age - Males - White
Median resident age - Males - Black or African American
Median resident age - Males - Asian
Median resident age - Males - Hispanic or Latino
Median resident age - Males - American Indian and Alaska Native
Median resident age - Males - Multirace
Median resident age - Males - Other Race
Median resident age - Females - White
Median resident age - Females - Black or African American
Median resident age - Females - Asian
Median resident age - Females - Hispanic or Latino
Median resident age - Females - American Indian and Alaska Native
Median resident age - Females - Multirace
Median resident age - Females - Other Race
Commute - mean travel time to work (minutes)
Travel time to work - Less than 5 minutes (%)
Travel time to work - Less than 5 minutes (% change since 2000)
Travel time to work - 5 to 9 minutes (%)
Travel time to work - 5 to 9 minutes (% change since 2000)
Travel time to work - 10 to 19 minutes (%)
Travel time to work - 10 to 19 minutes (% change since 2000)
Travel time to work - 20 to 29 minutes (%)
Travel time to work - 20 to 29 minutes (% change since 2000)
Travel time to work - 30 to 39 minutes (%)
Travel time to work - 30 to 39 minutes (% change since 2000)
Travel time to work - 40 to 59 minutes (%)
Travel time to work - 40 to 59 minutes (% change since 2000)
Travel time to work - 60 to 89 minutes (%)
Travel time to work - 60 to 89 minutes (% change since 2000)
Travel time to work - 90 or more minutes (%)
Travel time to work - 90 or more minutes (% change since 2000)
Marital status - Never married (%)
Marital status - Now married (%)
Marital status - Separated (%)
Marital status - Widowed (%)
Marital status - Divorced (%)
Median family income ($)
Median family income (% change since 2000)
Median non-family income ($)
Median non-family income (% change since 2000)
Median per capita income ($)
Median per capita income (% change since 2000)
Median family income ($) - White
Median family income ($) - Black or African American
Median family income ($) - Asian
Median family income ($) - Hispanic or Latino
Median family income ($) - American Indian and Alaska Native
Median family income ($) - Multirace
Median family income ($) - Other Race
Median year house/condo built
Median year apartment built
Year house built - Built 2005 or later (%)
Year house built - Built 2000 to 2004 (%)
Year house built - Built 1990 to 1999 (%)
Year house built - Built 1980 to 1989 (%)
Year house built - Built 1970 to 1979 (%)
Year house built - Built 1960 to 1969 (%)
Year house built - Built 1950 to 1959 (%)
Year house built - Built 1940 to 1949 (%)
Year house built - Built 1939 or earlier (%)
Average household size
Household density (households per square mile)
Average household size - White
Average household size - Black or African American
Average household size - Asian
Average household size - Hispanic or Latino
Average household size - American Indian and Alaska Native
Average household size - Multirace
Average household size - Other Race
Occupied housing units (%)
Vacant housing units (%)
Owner occupied housing units (%)
Renter occupied housing units (%)
Vacancy status - For rent (%)
Vacancy status - For sale only (%)
Vacancy status - Rented or sold, not occupied (%)
Vacancy status - For seasonal, recreational, or occasional use (%)
Vacancy status - For migrant workers (%)
Vacancy status - Other vacant (%)
Residents with income below the poverty level (%)
Residents with income below 50% of the poverty level (%)
Children below poverty level (%)
Poor families by family type - Married-couple family (%)
Poor families by family type - Male, no wife present (%)
Poor families by family type - Female, no husband present (%)
Poverty status for native-born residents (%)
Poverty status for foreign-born residents (%)
Poverty among high school graduates not in families (%)
Poverty among people who did not graduate high school not in families (%)
Residents with income below the poverty level (%) - White
Residents with income below the poverty level (%) - Black or African American
Residents with income below the poverty level (%) - Asian
Residents with income below the poverty level (%) - Hispanic or Latino
Residents with income below the poverty level (%) - American Indian and Alaska Native
Residents with income below the poverty level (%) - Multirace
Residents with income below the poverty level (%) - Other Race
Air pollution - Air Quality Index (AQI)
Air pollution - CO
Air pollution - NO2
Air pollution - SO2
Air pollution - Ozone
Air pollution - PM10
Air pollution - PM25
Air pollution - Pb
Crime - Murders per 100,000 population
Crime - Rapes per 100,000 population
Crime - Robberies per 100,000 population
Crime - Assaults per 100,000 population
Crime - Burglaries per 100,000 population
Crime - Thefts per 100,000 population
Crime - Auto thefts per 100,000 population
Crime - Arson per 100,000 population
Crime - City-data.com crime index
Crime - Violent crime index
Crime - Property crime index
Crime - Murders per 100,000 population (5 year average)
Crime - Rapes per 100,000 population (5 year average)
Crime - Robberies per 100,000 population (5 year average)
Crime - Assaults per 100,000 population (5 year average)
Crime - Burglaries per 100,000 population (5 year average)
Crime - Thefts per 100,000 population (5 year average)
Crime - Auto thefts per 100,000 population (5 year average)
Crime - Arson per 100,000 population (5 year average)
Crime - City-data.com crime index (5 year average)
Crime - Violent crime index (5 year average)
Crime - Property crime index (5 year average)
1996 Presidential Elections Results (%) - Democratic Party (Clinton)
1996 Presidential Elections Results (%) - Republican Party (Dole)
1996 Presidential Elections Results (%) - Other
2000 Presidential Elections Results (%) - Democratic Party (Gore)
2000 Presidential Elections Results (%) - Republican Party (Bush)
2000 Presidential Elections Results (%) - Other
2004 Presidential Elections Results (%) - Democratic Party (Kerry)
2004 Presidential Elections Results (%) - Republican Party (Bush)
2004 Presidential Elections Results (%) - Other
2008 Presidential Elections Results (%) - Democratic Party (Obama)
2008 Presidential Elections Results (%) - Republican Party (McCain)
2008 Presidential Elections Results (%) - Other
2012 Presidential Elections Results (%) - Democratic Party (Obama)
2012 Presidential Elections Results (%) - Republican Party (Romney)
2012 Presidential Elections Results (%) - Other
2016 Presidential Elections Results (%) - Democratic Party (Clinton)
2016 Presidential Elections Results (%) - Republican Party (Trump)
2016 Presidential Elections Results (%) - Other
2020 Presidential Elections Results (%) - Democratic Party (Biden)
2020 Presidential Elections Results (%) - Republican Party (Trump)
2020 Presidential Elections Results (%) - Other
Ancestries Reported - Arab (%)
Ancestries Reported - Czech (%)
Ancestries Reported - Danish (%)
Ancestries Reported - Dutch (%)
Ancestries Reported - English (%)
Ancestries Reported - French (%)
Ancestries Reported - French Canadian (%)
Ancestries Reported - German (%)
Ancestries Reported - Greek (%)
Ancestries Reported - Hungarian (%)
Ancestries Reported - Irish (%)
Ancestries Reported - Italian (%)
Ancestries Reported - Lithuanian (%)
Ancestries Reported - Norwegian (%)
Ancestries Reported - Polish (%)
Ancestries Reported - Portuguese (%)
Ancestries Reported - Russian (%)
Ancestries Reported - Scotch-Irish (%)
Ancestries Reported - Scottish (%)
Ancestries Reported - Slovak (%)
Ancestries Reported - Subsaharan African (%)
Ancestries Reported - Swedish (%)
Ancestries Reported - Swiss (%)
Ancestries Reported - Ukrainian (%)
Ancestries Reported - United States (%)
Ancestries Reported - Welsh (%)
Ancestries Reported - West Indian (%)
Ancestries Reported - Other (%)
Educational Attainment - No schooling completed (%)
Educational Attainment - Less than high school (%)
Educational Attainment - High school or equivalent (%)
Educational Attainment - Less than 1 year of college (%)
Educational Attainment - 1 or more years of college (%)
Educational Attainment - Associate degree (%)
Educational Attainment - Bachelor's degree (%)
Educational Attainment - Master's degree (%)
Educational Attainment - Professional school degree (%)
Educational Attainment - Doctorate degree (%)
School Enrollment - Nursery, preschool (%)
School Enrollment - Kindergarten (%)
School Enrollment - Grade 1 to 4 (%)
School Enrollment - Grade 5 to 8 (%)
School Enrollment - Grade 9 to 12 (%)
School Enrollment - College undergrad (%)
School Enrollment - Graduate or professional (%)
School Enrollment - Not enrolled in school (%)
School enrollment - Public schools (%)
School enrollment - Private schools (%)
School enrollment - Not enrolled (%)
Median number of rooms in houses and condos
Median number of rooms in apartments
Housing units lacking complete plumbing facilities (%)
Housing units lacking complete kitchen facilities (%)
Density of houses
Urban houses (%)
Rural houses (%)
Households with people 60 years and over (%)
Households with people 65 years and over (%)
Households with people 75 years and over (%)
Households with one or more nonrelatives (%)
Households with no nonrelatives (%)
Population in households (%)
Family households (%)
Nonfamily households (%)
Population in families (%)
Family households with own children (%)
Median number of bedrooms in owner occupied houses
Mean number of bedrooms in owner occupied houses
Median number of bedrooms in renter occupied houses
Mean number of bedrooms in renter occupied houses
Median number of vehichles in owner occupied houses
Mean number of vehichles in owner occupied houses
Median number of vehichles in renter occupied houses
Mean number of vehichles in renter occupied houses
Mortgage status - with mortgage (%)
Mortgage status - with second mortgage (%)
Mortgage status - with home equity loan (%)
Mortgage status - with both second mortgage and home equity loan (%)
Mortgage status - without a mortgage (%)
Average family size
Average family size - White
Average family size - Black or African American
Average family size - Asian
Average family size - Hispanic or Latino
Average family size - American Indian and Alaska Native
Average family size - Multirace
Average family size - Other Race
Geographical mobility - Same house 1 year ago (%)
Geographical mobility - Moved within same county (%)
Geographical mobility - Moved from different county within same state (%)
Geographical mobility - Moved from different state (%)
Geographical mobility - Moved from abroad (%)
Place of birth - Born in state of residence (%)
Place of birth - Born in other state (%)
Place of birth - Native, outside of US (%)
Place of birth - Foreign born (%)
Housing units in structures - 1, detached (%)
Housing units in structures - 1, attached (%)
Housing units in structures - 2 (%)
Housing units in structures - 3 or 4 (%)
Housing units in structures - 5 to 9 (%)
Housing units in structures - 10 to 19 (%)
Housing units in structures - 20 to 49 (%)
Housing units in structures - 50 or more (%)
Housing units in structures - Mobile home (%)
Housing units in structures - Boat, RV, van, etc. (%)
House/condo owner moved in on average (years ago)
Renter moved in on average (years ago)
Year householder moved into unit - Moved in 1999 to March 2000 (%)
Year householder moved into unit - Moved in 1995 to 1998 (%)
Year householder moved into unit - Moved in 1990 to 1994 (%)
Year householder moved into unit - Moved in 1980 to 1989 (%)
Year householder moved into unit - Moved in 1970 to 1979 (%)
Year householder moved into unit - Moved in 1969 or earlier (%)
Means of transportation to work - Drove car alone (%)
Means of transportation to work - Carpooled (%)
Means of transportation to work - Public transportation (%)
Means of transportation to work - Bus or trolley bus (%)
Means of transportation to work - Streetcar or trolley car (%)
Means of transportation to work - Subway or elevated (%)
Means of transportation to work - Railroad (%)
Means of transportation to work - Ferryboat (%)
Means of transportation to work - Taxicab (%)
Means of transportation to work - Motorcycle (%)
Means of transportation to work - Bicycle (%)
Means of transportation to work - Walked (%)
Means of transportation to work - Other means (%)
Working at home (%)
Industry diversity
Most Common Industries - Agriculture, forestry, fishing and hunting, and mining (%)
Most Common Industries - Agriculture, forestry, fishing and hunting (%)
Most Common Industries - Mining, quarrying, and oil and gas extraction (%)
Most Common Industries - Construction (%)
Most Common Industries - Manufacturing (%)
Most Common Industries - Wholesale trade (%)
Most Common Industries - Retail trade (%)
Most Common Industries - Transportation and warehousing, and utilities (%)
Most Common Industries - Transportation and warehousing (%)
Most Common Industries - Utilities (%)
Most Common Industries - Information (%)
Most Common Industries - Finance and insurance, and real estate and rental and leasing (%)
Most Common Industries - Finance and insurance (%)
Most Common Industries - Real estate and rental and leasing (%)
Most Common Industries - Professional, scientific, and management, and administrative and waste management services (%)
Most Common Industries - Professional, scientific, and technical services (%)
Most Common Industries - Management of companies and enterprises (%)
Most Common Industries - Administrative and support and waste management services (%)
Most Common Industries - Educational services, and health care and social assistance (%)
Most Common Industries - Educational services (%)
Most Common Industries - Health care and social assistance (%)
Most Common Industries - Arts, entertainment, and recreation, and accommodation and food services (%)
Most Common Industries - Arts, entertainment, and recreation (%)
Most Common Industries - Accommodation and food services (%)
Most Common Industries - Other services, except public administration (%)
Most Common Industries - Public administration (%)
Occupation diversity
Most Common Occupations - Management, business, science, and arts occupations (%)
Most Common Occupations - Management, business, and financial occupations (%)
Most Common Occupations - Management occupations (%)
Most Common Occupations - Business and financial operations occupations (%)
Most Common Occupations - Computer, engineering, and science occupations (%)
Most Common Occupations - Computer and mathematical occupations (%)
Most Common Occupations - Architecture and engineering occupations (%)
Most Common Occupations - Life, physical, and social science occupations (%)
Most Common Occupations - Education, legal, community service, arts, and media occupations (%)
Most Common Occupations - Community and social service occupations (%)
Most Common Occupations - Legal occupations (%)
Most Common Occupations - Education, training, and library occupations (%)
Most Common Occupations - Arts, design, entertainment, sports, and media occupations (%)
Most Common Occupations - Healthcare practitioners and technical occupations (%)
Most Common Occupations - Health diagnosing and treating practitioners and other technical occupations (%)
Most Common Occupations - Health technologists and technicians (%)
Most Common Occupations - Service occupations (%)
Most Common Occupations - Healthcare support occupations (%)
Most Common Occupations - Protective service occupations (%)
Most Common Occupations - Fire fighting and prevention, and other protective service workers including supervisors (%)
Most Common Occupations - Law enforcement workers including supervisors (%)
Most Common Occupations - Food preparation and serving related occupations (%)
Most Common Occupations - Building and grounds cleaning and maintenance occupations (%)
Most Common Occupations - Personal care and service occupations (%)
Most Common Occupations - Sales and office occupations (%)
Most Common Occupations - Sales and related occupations (%)
Most Common Occupations - Office and administrative support occupations (%)
Most Common Occupations - Natural resources, construction, and maintenance occupations (%)
Most Common Occupations - Farming, fishing, and forestry occupations (%)
Most Common Occupations - Construction and extraction occupations (%)
Most Common Occupations - Installation, maintenance, and repair occupations (%)
Most Common Occupations - Production, transportation, and material moving occupations (%)
Most Common Occupations - Production occupations (%)
Most Common Occupations - Transportation occupations (%)
Most Common Occupations - Material moving occupations (%)
People in Group quarters - Institutionalized population (%)
People in Group quarters - Correctional institutions (%)
People in Group quarters - Federal prisons and detention centers (%)
People in Group quarters - Halfway houses (%)
People in Group quarters - Local jails and other confinement facilities (including police lockups) (%)
People in Group quarters - Military disciplinary barracks (%)
People in Group quarters - State prisons (%)
People in Group quarters - Other types of correctional institutions (%)
People in Group quarters - Nursing homes (%)
People in Group quarters - Hospitals/wards, hospices, and schools for the handicapped (%)
People in Group quarters - Hospitals/wards and hospices for chronically ill (%)
People in Group quarters - Hospices or homes for chronically ill (%)
People in Group quarters - Military hospitals or wards for chronically ill (%)
People in Group quarters - Other hospitals or wards for chronically ill (%)
People in Group quarters - Hospitals or wards for drug/alcohol abuse (%)
People in Group quarters - Mental (Psychiatric) hospitals or wards (%)
People in Group quarters - Schools, hospitals, or wards for the mentally retarded (%)
People in Group quarters - Schools, hospitals, or wards for the physically handicapped (%)
People in Group quarters - Institutions for the deaf (%)
People in Group quarters - Institutions for the blind (%)
People in Group quarters - Orthopedic wards and institutions for the physically handicapped (%)
People in Group quarters - Wards in general hospitals for patients who have no usual home elsewhere (%)
People in Group quarters - Wards in military hospitals for patients who have no usual home elsewhere (%)
People in Group quarters - Juvenile institutions (%)
People in Group quarters - Long-term care (%)
People in Group quarters - Homes for abused, dependent, and neglected children (%)
People in Group quarters - Residential treatment centers for emotionally disturbed children (%)
People in Group quarters - Training schools for juvenile delinquents (%)
People in Group quarters - Short-term care, detention or diagnostic centers for delinquent children (%)
People in Group quarters - Type of juvenile institution unknown (%)
People in Group quarters - Noninstitutionalized population (%)
People in Group quarters - College dormitories (includes college quarters off campus) (%)
People in Group quarters - Military quarters (%)
People in Group quarters - On base (%)
People in Group quarters - Barracks, unaccompanied personnel housing (UPH), (Enlisted/Officer), ;and similar group living quarters for military personnel (%)
People in Group quarters - Transient quarters for temporary residents (%)
People in Group quarters - Military ships (%)
People in Group quarters - Group homes (%)
People in Group quarters - Homes or halfway houses for drug/alcohol abuse (%)
People in Group quarters - Homes for the mentally ill (%)
People in Group quarters - Homes for the mentally retarded (%)
People in Group quarters - Homes for the physically handicapped (%)
People in Group quarters - Other group homes (%)
People in Group quarters - Religious group quarters (%)
People in Group quarters - Dormitories (%)
People in Group quarters - Agriculture workers' dormitories on farms (%)
People in Group quarters - Job Corps and vocational training facilities (%)
People in Group quarters - Other workers' dormitories (%)
People in Group quarters - Crews of maritime vessels (%)
People in Group quarters - Other nonhousehold living situations (%)
People in Group quarters - Other noninstitutional group quarters (%)
Residents speaking English at home (%)
Residents speaking English at home - Born in the United States (%)
Residents speaking English at home - Native, born elsewhere (%)
Residents speaking English at home - Foreign born (%)
Residents speaking Spanish at home (%)
Residents speaking Spanish at home - Born in the United States (%)
Residents speaking Spanish at home - Native, born elsewhere (%)
Residents speaking Spanish at home - Foreign born (%)
Residents speaking other language at home (%)
Residents speaking other language at home - Born in the United States (%)
Residents speaking other language at home - Native, born elsewhere (%)
Residents speaking other language at home - Foreign born (%)
Class of Workers - Employee of private company (%)
Class of Workers - Self-employed in own incorporated business (%)
Class of Workers - Private not-for-profit wage and salary workers (%)
Class of Workers - Local government workers (%)
Class of Workers - State government workers (%)
Class of Workers - Federal government workers (%)
Class of Workers - Self-employed workers in own not incorporated business and Unpaid family workers (%)
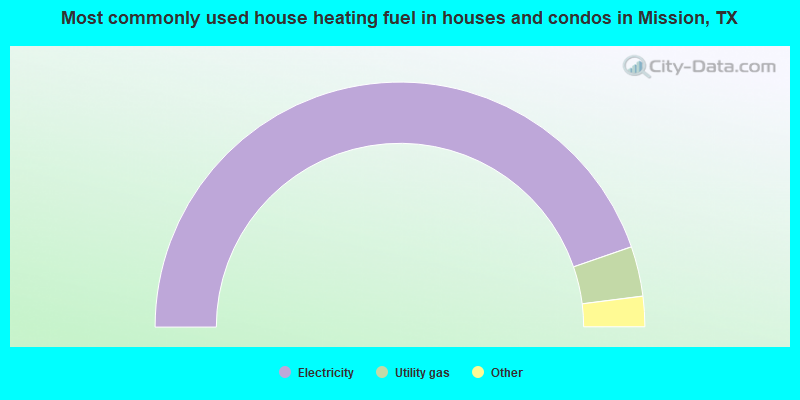
House heating fuel used in houses and condos - Utility gas (%)
House heating fuel used in houses and condos - Bottled, tank, or LP gas (%)
House heating fuel used in houses and condos - Electricity (%)
House heating fuel used in houses and condos - Fuel oil, kerosene, etc. (%)
House heating fuel used in houses and condos - Coal or coke (%)
House heating fuel used in houses and condos - Wood (%)
House heating fuel used in houses and condos - Solar energy (%)
House heating fuel used in houses and condos - Other fuel (%)
House heating fuel used in houses and condos - No fuel used (%)
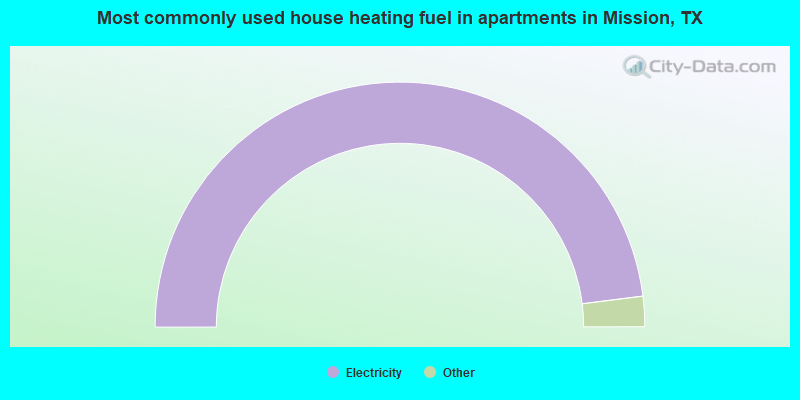
House heating fuel used in apartments - Utility gas (%)
House heating fuel used in apartments - Bottled, tank, or LP gas (%)
House heating fuel used in apartments - Electricity (%)
House heating fuel used in apartments - Fuel oil, kerosene, etc. (%)
House heating fuel used in apartments - Coal or coke (%)
House heating fuel used in apartments - Wood (%)
House heating fuel used in apartments - Solar energy (%)
House heating fuel used in apartments - Other fuel (%)
House heating fuel used in apartments - No fuel used (%)
Armed forces status - In Armed Forces (%)
Armed forces status - Civilian (%)
Armed forces status - Civilian - Veteran (%)
Armed forces status - Civilian - Nonveteran (%)
Fatal accidents locations in years 2005-2021
Fatal accidents locations in 2005
Fatal accidents locations in 2006
Fatal accidents locations in 2007
Fatal accidents locations in 2008
Fatal accidents locations in 2009
Fatal accidents locations in 2010
Fatal accidents locations in 2011
Fatal accidents locations in 2012
Fatal accidents locations in 2013
Fatal accidents locations in 2014
Fatal accidents locations in 2015
Fatal accidents locations in 2016
Fatal accidents locations in 2017
Fatal accidents locations in 2018
Fatal accidents locations in 2019
Fatal accidents locations in 2020
Fatal accidents locations in 2021
Alcohol use - People drinking some alcohol every month (%)
Alcohol use - People not drinking at all (%)
Alcohol use - Average days/month drinking alcohol
Alcohol use - Average drinks/week
Alcohol use - Average days/year people drink much
Audiometry - Average condition of hearing (%)
Audiometry - People that can hear a whisper from across a quiet room (%)
Audiometry - People that can hear normal voice from across a quiet room (%)
Audiometry - Ears ringing, roaring, buzzing (%)
Audiometry - Had a job exposure to loud noise (%)
Audiometry - Had off-work exposure to loud noise (%)
Blood Pressure & Cholesterol - Has high blood pressure (%)
Blood Pressure & Cholesterol - Checking blood pressure at home (%)
Blood Pressure & Cholesterol - Frequently checking blood cholesterol (%)
Blood Pressure & Cholesterol - Has high cholesterol level (%)
Consumer Behavior - Money monthly spent on food at supermarket/grocery store
Consumer Behavior - Money monthly spent on food at other stores
Consumer Behavior - Money monthly spent on eating out
Consumer Behavior - Money monthly spent on carryout/delivered foods
Consumer Behavior - Income spent on food at supermarket/grocery store (%)
Consumer Behavior - Income spent on food at other stores (%)
Consumer Behavior - Income spent on eating out (%)
Consumer Behavior - Income spent on carryout/delivered foods (%)
Current Health Status - General health condition (%)
Current Health Status - Blood donors (%)
Current Health Status - Has blood ever tested for HIV virus (%)
Current Health Status - Left-handed people (%)
Dermatology - People using sunscreen (%)
Diabetes - Diabetics (%)
Diabetes - Had a blood test for high blood sugar (%)
Diabetes - People taking insulin (%)
Diet Behavior & Nutrition - Diet health (%)
Diet Behavior & Nutrition - Milk product consumption (# of products/month)
Diet Behavior & Nutrition - Meals not home prepared (#/week)
Diet Behavior & Nutrition - Meals from fast food or pizza place (#/week)
Diet Behavior & Nutrition - Ready-to-eat foods (#/month)
Diet Behavior & Nutrition - Frozen meals/pizza (#/month)
Drug Use - People that ever used marijuana or hashish (%)
Drug Use - Ever used hard drugs (%)
Drug Use - Ever used any form of cocaine (%)
Drug Use - Ever used heroin (%)
Drug Use - Ever used methamphetamine (%)
Health Insurance - People covered by health insurance (%)
Kidney Conditions-Urology - Avg. # of times urinating at night
Medical Conditions - People with asthma (%)
Medical Conditions - People with anemia (%)
Medical Conditions - People with psoriasis (%)
Medical Conditions - People with overweight (%)
Medical Conditions - Elderly people having difficulties in thinking or remembering (%)
Medical Conditions - People who ever received blood transfusion (%)
Medical Conditions - People having trouble seeing even with glass/contacts (%)
Medical Conditions - People with arthritis (%)
Medical Conditions - People with gout (%)
Medical Conditions - People with congestive heart failure (%)
Medical Conditions - People with coronary heart disease (%)
Medical Conditions - People with angina pectoris (%)
Medical Conditions - People who ever had heart attack (%)
Medical Conditions - People who ever had stroke (%)
Medical Conditions - People with emphysema (%)
Medical Conditions - People with thyroid problem (%)
Medical Conditions - People with chronic bronchitis (%)
Medical Conditions - People with any liver condition (%)
Medical Conditions - People who ever had cancer or malignancy (%)
Mental Health - People who have little interest in doing things (%)
Mental Health - People feeling down, depressed, or hopeless (%)
Mental Health - People who have trouble sleeping or sleeping too much (%)
Mental Health - People feeling tired or having little energy (%)
Mental Health - People with poor appetite or overeating (%)
Mental Health - People feeling bad about themself (%)
Mental Health - People who have trouble concentrating on things (%)
Mental Health - People moving or speaking slowly or too fast (%)
Mental Health - People having thoughts they would be better off dead (%)
Oral Health - Average years since last visit a dentist
Oral Health - People embarrassed because of mouth (%)
Oral Health - People with gum disease (%)
Oral Health - General health of teeth and gums (%)
Oral Health - Average days a week using dental floss/device
Oral Health - Average days a week using mouthwash for dental problem
Oral Health - Average number of teeth
Pesticide Use - Households using pesticides to control insects (%)
Pesticide Use - Households using pesticides to kill weeds (%)
Physical Activity - People doing vigorous-intensity work activities (%)
Physical Activity - People doing moderate-intensity work activities (%)
Physical Activity - People walking or bicycling (%)
Physical Activity - People doing vigorous-intensity recreational activities (%)
Physical Activity - People doing moderate-intensity recreational activities (%)
Physical Activity - Average hours a day doing sedentary activities
Physical Activity - Average hours a day watching TV or videos
Physical Activity - Average hours a day using computer
Physical Functioning - People having limitations keeping them from working (%)
Physical Functioning - People limited in amount of work they can do (%)
Physical Functioning - People that need special equipment to walk (%)
Physical Functioning - People experiencing confusion/memory problems (%)
Physical Functioning - People requiring special healthcare equipment (%)
Prescription Medications - Average number of prescription medicines taking
Preventive Aspirin Use - Adults 40+ taking low-dose aspirin (%)
Reproductive Health - Vaginal deliveries (%)
Reproductive Health - Cesarean deliveries (%)
Reproductive Health - Deliveries resulted in a live birth (%)
Reproductive Health - Pregnancies resulted in a delivery (%)
Reproductive Health - Women breastfeeding newborns (%)
Reproductive Health - Women that had a hysterectomy (%)
Reproductive Health - Women that had both ovaries removed (%)
Reproductive Health - Women that have ever taken birth control pills (%)
Reproductive Health - Women taking birth control pills (%)
Reproductive Health - Women that have ever used Depo-Provera or injectables (%)
Reproductive Health - Women that have ever used female hormones (%)
Sexual Behavior - People 18+ that ever had sex (vaginal, anal, or oral) (%)
Sexual Behavior - Males 18+ that ever had vaginal sex with a woman (%)
Sexual Behavior - Males 18+ that ever performed oral sex on a woman (%)
Sexual Behavior - Males 18+ that ever had anal sex with a woman (%)
Sexual Behavior - Males 18+ that ever had any sex with a man (%)
Sexual Behavior - Females 18+ that ever had vaginal sex with a man (%)
Sexual Behavior - Females 18+ that ever performed oral sex on a man (%)
Sexual Behavior - Females 18+ that ever had anal sex with a man (%)
Sexual Behavior - Females 18+ that ever had any kind of sex with a woman (%)
Sexual Behavior - Average age people first had sex
Sexual Behavior - Average number of female sex partners in lifetime (males 18+)
Sexual Behavior - Average number of female vaginal sex partners in lifetime (males 18+)
Sexual Behavior - Average age people first performed oral sex on a woman (18+)
Sexual Behavior - Average number of woman performed oral sex on in lifetime (18+)
Sexual Behavior - Average number of male sex partners in lifetime (males 18+)
Sexual Behavior - Average number of male anal sex partners in lifetime (males 18+)
Sexual Behavior - Average age people first performed oral sex on a man (18+)
Sexual Behavior - Average number of male oral sex partners in lifetime (18+)
Sexual Behavior - People using protection when performing oral sex (%)
Sexual Behavior - Average number of times people have vaginal or anal sex a year
Sexual Behavior - People having sex without condom (%)
Sexual Behavior - Average number of male sex partners in lifetime (females 18+)
Sexual Behavior - Average number of male vaginal sex partners in lifetime (females 18+)
Sexual Behavior - Average number of female sex partners in lifetime (females 18+)
Sexual Behavior - Circumcised males 18+ (%)
Sleep Disorders - Average hours sleeping at night
Sleep Disorders - People that has trouble sleeping (%)
Smoking-Cigarette Use - People smoking cigarettes (%)
Taste & Smell - People 40+ having problems with smell (%)
Taste & Smell - People 40+ having problems with taste (%)
Taste & Smell - People 40+ that ever had wisdom teeth removed (%)
Taste & Smell - People 40+ that ever had tonsils teeth removed (%)
Taste & Smell - People 40+ that ever had a loss of consciousness because of a head injury (%)
Taste & Smell - People 40+ that ever had a broken nose or other serious injury to face or skull (%)
Taste & Smell - People 40+ that ever had two or more sinus infections (%)
Weight - Average height (inches)
Weight - Average weight (pounds)
Weight - Average BMI
Weight - People that are obese (%)
Weight - People that ever were obese (%)
Weight - People trying to lose weight (%)
According to our research of Texas and other state lists, there were 212 registered sex offenders living in Mission, Texas as of June 07, 2024 . The ratio of all residents to sex offenders in Mission is 398 to 1.The ratio of registered sex offenders to all residents in this city is near the state average.
The City-Data.com crime index weighs serious crimes and violent crimes more heavily. Higher means more crime, U.S. average is 246.1. It adjusts for the number of visitors and daily workers commuting into cities.
- means the value is smaller than the state average.
- means the value is about the same as the state average.
- means the value is bigger than the state average.
- means the value is much bigger than the state average.
Crime rate in Mission detailed stats: murders, rapes, robberies, assaults, burglaries, thefts, arson Officers per 1,000 residents here:
1.93Texas average:
2.07
Latest news from Mission, TX collected exclusively by city-data.com from local newspapers, TV, and radio stations
Ancestries: German (1.6%), American (1.4%).
Current Local Time:
Land area: 24.1 square miles.
Population density: 3,591 people per square mile (average).
24,876 residents are foreign born (26.3% Latin America ).
This city:
28.5%Texas:
17.1%
Median real estate property taxes paid for housing units with mortgages in 2022: $4,674 (2.1%)Median real estate property taxes paid for housing units with no mortgage in 2022: $2,250 (1.9%)
Nearest city with pop. 50,000+: McAllen, TX
Nearest city with pop. 200,000+: Corpus Christi, TX
Nearest city with pop. 1,000,000+: San Antonio, TX
Nearest cities:
Latitude: 26.21 N, Longitude: 98.32 W
Daytime population change due to commuting: -1,576 (-1.8%)Workers who live and work in this city: 12,516 (35.3%)
Property values in Mission, TX
Single-family new house construction building permits:
2022: 372 buildings , average cost: $228,5002021: 536 buildings , average cost: $164,6002020: 381 buildings , average cost: $133,2002019: 377 buildings , average cost: $126,5002018: 307 buildings , average cost: $126,4002017: 287 buildings , average cost: $130,8002016: 281 buildings , average cost: $119,3002015: 302 buildings , average cost: $126,7002014: 299 buildings , average cost: $123,6002013: 233 buildings , average cost: $156,4002012: 249 buildings , average cost: $126,0002011: 326 buildings , average cost: $144,3002010: 346 buildings , average cost: $143,1002009: 296 buildings , average cost: $134,4002008: 389 buildings , average cost: $136,6002007: 634 buildings , average cost: $130,0002006: 775 buildings , average cost: $123,3002005: 901 buildings , average cost: $111,3002004: 1061 buildings , average cost: $92,3002003: 1166 buildings , average cost: $82,0002002: 1182 buildings , average cost: $81,1002001: 1043 buildings , average cost: $75,3002000: 823 buildings , average cost: $72,4001999: 683 buildings , average cost: $64,7001998: 608 buildings , average cost: $64,3001997: 401 buildings , average cost: $66,800Unemployment in December 2023:
Population change in the 1990s: +14,222 (+45.6%).
Most common occupations in Mission, TX (%)
Both Males Females
Preschool, kindergarten, elementary, and middle school teachers (7.0%)
Other sales and related occupations, including supervisors (4.6%)
Other management occupations, except farmers and farm managers (4.3%)
Other office and administrative support workers, including supervisors (4.0%)
Building and grounds cleaning and maintenance occupations (3.9%)
Retail sales workers, except cashiers (3.8%)
Other production occupations, including supervisors (3.4%)
Other sales and related occupations, including supervisors (5.7%)
Driver/sales workers and truck drivers (5.1%)
Other management occupations, except farmers and farm managers (4.6%)
Preschool, kindergarten, elementary, and middle school teachers (4.3%)
Building and grounds cleaning and maintenance occupations (4.0%)
Other production occupations, including supervisors (3.8%)
Vehicle and mobile equipment mechanics, installers, and repairers (3.8%)
Preschool, kindergarten, elementary, and middle school teachers (10.3%)
Other office and administrative support workers, including supervisors (5.7%)
Secretaries and administrative assistants (4.9%)
Cashiers (4.8%)
Information and record clerks, except customer service representatives (4.5%)
Retail sales workers, except cashiers (4.1%)
Other management occupations, except farmers and farm managers (4.0%)
Air pollution and air quality trends(lower is better)
AQI Ozone PM2.5
Tornado activity:
Mission-area historical tornado activity is significantly below Texas state average. It is 79% smaller than the overall U.S. average.
On 4/19/1965, a category F3 (max. wind speeds 158-206 mph) tornado 33.8 miles away from the Mission city center .
On 4/26/1967, a category F2 (max. wind speeds 113-157 mph) tornado 9.3 miles away from the city center caused between $5000 and $50,000 in damages.
Earthquake activity:
Mission-area historical earthquake activity is slightly below Texas state average. It is 80% smaller than the overall U.S. average. On 10/20/2011 at 12:24:41, a magnitude 4.8 (4.8 MW, Depth: 3.1 mi, Class: Light, Intensity: IV - V) earthquake occurred 184.1 miles away from the city center On 4/14/1995 at 00:32:56, a magnitude 5.7 (5.6 MB, 5.7 MS, 5.7 MW, Depth: 11.1 mi, Class: Moderate, Intensity: VI - VII) earthquake occurred 416.6 miles away from Mission center On 4/9/1993 at 12:29:19, a magnitude 4.3 (4.1 MB, 4.3 LG, Depth: 3.1 mi) earthquake occurred 180.2 miles away from the city center On 4/25/2010 at 02:10:42, a magnitude 3.9 (3.9 MB, Depth: 3.1 mi, Class: Light, Intensity: II - III) earthquake occurred 107.6 miles away from the city center On 11/13/2017 at 11:23:01, a magnitude 3.9 (3.9 MD, Depth: 3.1 mi) earthquake occurred 117.0 miles away from the city center On 3/24/1997 at 22:31:34, a magnitude 3.8 (3.8 LG, Depth: 3.1 mi) earthquake occurred 105.4 miles away from the city center Magnitude types: regional Lg-wave magnitude (LG), body-wave magnitude (MB), duration magnitude (MD), surface-wave magnitude (MS), moment magnitude (MW) Natural disasters: The number of natural disasters in Hidalgo County (22) is greater than the US average (15).Major Disasters (Presidential) Declared: 12Emergencies Declared: 7Hurricanes: 12, Floods: 7, Storms: 6, Tornadoes: 3, Winds: 3, Fire: 1, Heavy Rain: 1, Tropical Storm: 1, Other: 1 (Note: some incidents may be assigned to more than one category). Hospitals in Mission: BRIARWOOD HOME (2406 BRIARWOOD) MISSION REGIONAL MEDICAL CENTER (Voluntary non-profit - Private, 900 SOUTH BRYAN ROAD) Nursing Homes in Mission: MISSION NURSING AND REHABILITATION CENTER (1013 S BRYAN RD) Dialysis Facilities in Mission: MISSION KIDNEY CENTER (901 PLAZA DR) MISSION VALLEY DIALYSIS (1203 ST CLARE BLVD, SUITE 9B) SOUTH TEXAS DIALYSIS CENTER (1615 E EXPY 83) US RENAL CARE MISSION DIALYSIS (1300 SOUTH BRYAN ROAD) Home Health Centers in Mission: A NEW HOPE HEALTH CARE INC (1902 W GRIFFIN PARKWAY) AIMA HOME HEALTH (2901 N LA HOMA BLVD SUITE B) AMADO HOME HEALTH CARE (2020 E GRIFFIN PARKWAY) ARISE HOME HEALTH CARE INC (215 W 9TH STREET SUITE A) CRITERION HEALTH CARE INC (1022 EAST GRIFFIN PARKWAY SUITE 106) EXPERT HOME HEALTH CARE INC (909 BUSINESS PARK SUITE 10) HIGH POINT HOME HEALTH (1700 WEST GRIFFIN PARKWAY) KELLYS HEALTH CARE INC (2007 N CONWAY) MASES HOME HEALTH INC (5305 N INSPIRATION ROAD) PROFICIENT HOME CARE SOLUTIONS (318 A MILLER AVENUE) Airports located in Mission: Amtrak station near Mission: 6 miles: MCALLEN (120 S. 16TH ST.) - Bus Station Services: enclosed waiting area, intercity bus service.
College/University in Mission: University of Phoenix-McAllen Campus Full-time enrollment: 83; Location: 4201 South Shary Road; Private, for-profit; Website: www.phoenix.edu; Offers Master's degree )
Colleges/universities with over 2000 students nearest to Mission:
South Texas College (about 5 miles; McAllen, TX ; Full-time enrollment: 19,701)
The University of Texas-Pan American (about 12 miles; Edinburg, TX ; FT enrollment: 16,766)
Texas State Technical College-Harlingen (about 41 miles; Harlingen, TX ; FT enrollment: 3,700)
The University of Texas at Brownsville (about 57 miles; Brownsville, TX ; FT enrollment: 9,165)
Texas A & M University-Kingsville (about 95 miles; Kingsville, TX ; FT enrollment: 9,295)
Laredo Community College (about 117 miles; Laredo, TX ; FT enrollment: 9,743)
Texas A & M International University (about 117 miles; Laredo, TX ; FT enrollment: 5,203)
Biggest public high schools in Mission: LA JOYA PALMVIEW H S Students: 2,769, Location: 3901 N LA HOMA RD, Grades: 9-12)SHARYLAND H S Students: 2,765, Location: 1106 N SHARY RD, Grades: 9-12)VETERANS MEMORIAL H S Students: 1,869, Location: 700 E TWO MILE RD, Grades: 9-12)IRENE M GARCIA MIDDLE Students: 921, Location: 933 PAULA DR, Grades: 6-9)MISSION H S Students: 876, Location: 1802 W 18TH ST, Grades: 9-12)ANN RICHARDS MIDDLE Students: 829, Location: 7005 ANN RICHARDS RD, Grades: 6-9)CESAR CHAVEZ MIDDLE Students: 791, Location: 78 SHOWERS RD, Grades: 6-9)JUAN DE DIOS SALINAS MIDDLE Students: 698, Location: 6101 N BENTSEN PALM DR, Grades: 6-9)IDEA COLLEGE PREPARATORY MISSION Students: 348, Location: 1600 S SCHUERBACH RD, Grades: 6-12, Charter school )HIDALGO CO J J A E P Students: 12, Location: 1201 BRYCE DR, Grades: 9-12)Biggest public elementary/middle schools in Mission: MISSION J H Students: 2,146, Location: 415 E 14TH ST, Grades: 6-8)WHITE J H Students: 958, Location: 1101 W GRIFFIN PKWY, Grades: 6-8)JUAN SEGUIN EL Students: 840, Location: 8500 N WESTERN RD, Grades: PK-5)JOSE DE ESCANDON EL Students: 814, Location: 700 N SCHUEBACH RD, Grades: PK-5)EVANGELINA GARZA EL Students: 804, Location: 8731 N DOFFING RD, Grades: PK-5)E B REYNA EL Students: 793, Location: 900 E VETERANS BLVD, Grades: PK-5)ROMULO D MARTINEZ EL Students: 780, Location: 2571 E 4TH ST, Grades: PK-6)EMILIANO ZAPATA EL Students: 779, Location: 9100 N LA HOMA, Grades: PK-5)ENRIQUE KIKI CAMARENA EL Students: 774, Location: 2612 N MOOREFIELD RD, Grades: PK-5)B L GRAY J H Students: 754, Location: 4400 S GLASSCOCK RD, Grades: 7-8)Private elementary/middle schools in Mission: AGAPE CHRISTIAN SCHOOL Students: 268, Location: 1401 E 24TH ST, Grades: PK-6)
OUR LADY OF GUADALUPE CATHOLIC SCHOOL Students: 106, Location: 611 N DUNLAP AVE, Grades: PK-6)
THE FUN OF LEARNING MONTESSORI CENTER Students: 28, Location: 7 1/4 N SHARY RD, Grades: PK-T1)
See full list of schools located in Mission Library in Mission: SPEER MEMORIAL LIBRARY Operating income: $1,342,025; Location: 801 E 12TH ST; 99,648 books ; 1 e-books ; 3,485 audio materials ; 2,408 video materials ; 3 local licensed databases ; 50 state licensed databases ; 119 print serial subscriptions )
Notable locations in Mission: (A) , Lomita Boulevard Commercial Historic District (B) , La Lomita Farm (C) , Mission Fire Department Central Station (D) , Mission Fire Department Station 2 (E) , Mission Fire Prevention Bureau (F) , McAllen Police Department (G) , Mission Police Department (H) , Mission Police Department Jail (I) , Palmhurst Police Department (J) , Hidalgo County Library System (K) , Speer Memorial Library (L) , Mission Fire Department Station 4 (M) , Mission Fire Department Station 3 (N) , Preferred Ambulance (O) , Medic 1 Emergency Medical Services (P) , Border Theater (Q) . Display/hide their locations on the map
Churches in Mission include: (A) , Conway Avenue Baptist Church (B) , Trinity Lutheran Church (C) , Saint Peter Church of the Nazarene (D) , Church of Christ (E) , Our Lady of the Holy Rosary Catholic Church (F) , First Baptist Church of Sharyland (G) , Seventh Day Adventist Church (H) , La Lomita Mission (I) . Display/hide their locations on the map
Cemetery: (1) . Display/hide its location on the map
Parks in Mission include: (1) , Rotary Park (2) , Nell Tolle Park (3) , McKinney Park (4) , Oblate Park (5) , Nelle Tolle Park (6) , Jaycee Park (7) , Rotary Park (8) , Baha Park (9) . Display/hide their locations on the map
Tourist attraction: (1) . Display/hide its approximate location on the map
Hotel: (1) . Display/hide its approximate location on the map
Birthplace of: Lloyd Bentsen - (b. 1921), former D. Senator from Texas, former Treasury Secretary, D. V-P. candidate, Fortunato Benavides - Judge, Lena Guerrero - Politician, Tom Landry - (1924-2000), football coach, Bobby Ply - Football player, Matt Koeneke - College basketball player (Texas A&M Aggies), Trinidad Silva - Actor.
Hidalgo County has a predicted average indoor radon screening level less than 2 pCi/L (pico curies per liter) - Low Potential Drinking water stations with addresses in Mission and their reported violations in the past:
AGUA SUD (Population served: 43,329, Surface water):
Past monitoring violations:
Lead Consumer Notice - In DEC-30-2013, Contaminant: Lead and Copper Rule. Follow-up actions: St Compliance achieved (MAY-28-2014)
Monitoring and Reporting (DBP) - In JUN-2012, Contaminant: Chlorite. Follow-up actions: St Public Notif requested (JUL-02-2012), St Violation/Reminder Notice (JUL-02-2012), St Public Notif received (JUL-25-2012)
Population served: 40, Groundwater):
Past monitoring violations:
3 routine major monitoring violations
Average household size: This city:
3.3 peopleTexas:
2.8 people
Percentage of family households: This city:
82.5%Whole state:
69.9%
Percentage of households with unmarried partners: This city:
4.2%Whole state:
6.0%
Likely homosexual households (counted as self-reported same-sex unmarried-partner households)
Lesbian couples: 0.4% of all households Gay men: 0.3% of all households
People in group quarters in Mission in 2010:
162 people in nursing facilities/skilled-nursing facilities
13 people in college/university student housing
4 people in other noninstitutional facilities
People in group quarters in Mission in 2000:
105 people in nursing homes
2 people in religious group quarters
2 people in other nonhousehold living situations
Banks with most branches in Mission (2011 data):
Inter National Bank: Mission Branch, Shary Express #3 Branch, Plantation Grove Branch, Sharyland Branch. Info updated 2006/11/03: Bank assets: $2,065.7 mil, Deposits: $1,646.7 mil, headquarters in Mcallen, TX, positive income , Commercial Lending Specialization, 20 total offices , Holding Company: Grupo Financiero Banorte, S.A. De C.V.
International Bank of Commerce: Mission Branch, In-Store H.E.b Mission, In-Store Walmart Mission. Info updated 2007/03/28: Bank assets: $9,621.9 mil, Deposits: $6,548.8 mil, headquarters in Laredo, TX, positive income , Commercial Lending Specialization, 197 total offices , Holding Company: International Bancshares Corporation
Compass Bank: Sharyland Branch, Mission East Branch, Mission Main Branch. Info updated 2011/02/24: Bank assets: $63,107.0 mil, Deposits: $46,232.4 mil, headquarters in Birmingham, AL, negative income in the last year , Commercial Lending Specialization, 720 total offices , Holding Company: Banco Bilbao Vizcaya Argentaria, S.A.
Lone Star National Bank: Mission Medical Branch, Mission Branch, Palmview Branch. Info updated 2010/05/05: Bank assets: $2,174.7 mil, Deposits: $1,815.0 mil, headquarters in Pharr, TX, positive income , Commercial Lending Specialization, 27 total offices , Holding Company: Lone Star National Bancshares--texas, Inc.
Capital One, National Association: Mission Branch at 2000 North Conway, branch established on 1956/01/01; Shary Road Branch at 124 S. Shary Road, branch established on 2008/02/11. Info updated 2011/07/01: Bank assets: $133,477.8 mil, Deposits: $97,063.7 mil, headquarters in Mclean, VA, positive income , 984 total offices , Holding Company: Capital One Financial Corporation
First National Bank: Mission Branch at 1709 North Conway, branch established on 1998/08/01. Info updated 2007/09/20: Bank assets: $3,517.0 mil, Deposits: $2,598.8 mil, headquarters in Edinburg, TX, negative income in the last year , Commercial Lending Specialization, 58 total offices , Holding Company: First National Bank Group, Inc.
Wells Fargo Bank, National Association: Mission Branch at 2405 N Conway Ave, branch established on 1996/06/24. Info updated 2011/04/05: Bank assets: $1,161,490.0 mil, Deposits: $905,653.0 mil, headquarters in Sioux Falls, SD, positive income , 6395 total offices , Holding Company: Wells Fargo & Company
Rio Bank: Palmview Branch at 401 North Bentsen Palm Drive, branch established on 2002/05/20. Info updated 2006/11/03: Bank assets: $206.9 mil, Deposits: $173.8 mil, headquarters in Mcallen, TX, positive income , Commercial Lending Specialization, 7 total offices , Holding Company: Rio Financial Services, Inc.
JPMorgan Chase Bank, National Association: Sharyland Branch at 207 S Shary Rd, branch established on 2006/06/27. Info updated 2011/11/10: Bank assets: $1,811,678.0 mil, Deposits: $1,190,738.0 mil, headquarters in Columbus, OH, positive income , International Specialization, 5577 total offices , Holding Company: Jpmorgan Chase & Co.
2 other banks with 2 local branches
For population 15 years and over in Mission:
Never married: 33.6%Now married: 50.8%Separated: 2.4%Widowed: 3.6%Divorced: 9.7% For population 25 years and over in Mission:
High school or higher: 79.9%Bachelor's degree or higher: 31.7%Graduate or professional degree: 9.6%Unemployed: 10.6%Mean travel time to work (commute): 19.7 minutes
Education Gini index (Inequality in education) Here:
15.5Texas average:
14.0
Religion statistics for Mission, TX (based on Hidalgo County data)
Religion Adherents Congregations Catholic 269,071 56 Evangelical Protestant 75,327 525 Other 18,510 43 Mainline Protestant 14,394 52 Orthodox 160 1 None 397,307 -
Source: Clifford Grammich, Kirk Hadaway, Richard Houseal, Dale E.Jones, Alexei Krindatch, Richie Stanley and Richard H.Taylor. 2012. 2010 U.S.Religion Census: Religious Congregations & Membership Study. Association of Statisticians of American Religious Bodies. Jones, Dale E., et al. 2002. Congregations and Membership in the United States 2000. Nashville, TN: Glenmary Research Center. Graphs represent county-level data
Food Environment Statistics: Number of grocery stores : 79This county :
1.12 / 10,000 pop.State :
1.47 / 10,000 pop.
Number of supercenters and club stores : 6This county :
0.09 / 10,000 pop.Texas :
0.14 / 10,000 pop.
Number of convenience stores (no gas) : 67Hidalgo County :
0.95 / 10,000 pop.Texas :
1.11 / 10,000 pop.
Number of convenience stores (with gas) : 240This county :
3.40 / 10,000 pop.Texas :
3.95 / 10,000 pop.
Number of full-service restaurants : 337This county :
4.78 / 10,000 pop.Texas :
6.13 / 10,000 pop.
Adult diabetes rate : Hidalgo County :
9.7%Texas :
8.9%
Adult obesity rate : Hidalgo County :
28.7%State :
26.6%
Low-income preschool obesity rate : This county :
15.8%State :
15.7%
Health and Nutrition:
Average overall health of teeth and gums : People feeling badly about themselves : This city:
18.7%Texas:
20.6%
People not drinking alcohol at all : This city:
10.6%Texas:
10.3%
Average hours sleeping at night : General health condition : Average condition of hearing : This city:
80.9%Texas:
80.7%
More about Health and Nutrition of Mission, TX Residents
Local government employment and payroll (March 2022)
Function
Full-time employees
Monthly full-time payroll
Average yearly full-time wage
Part-time employees
Monthly part-time payroll
Police Protection - Officers
164 $1,030,185 $75,379 0 $0 Water Supply
87 $294,578 $40,631 0 $0 Firefighters
78 $541,138 $83,252 0 $0 Other Government Administration
59 $273,953 $55,719 0 $0 Parks and Recreation
56 $154,812 $33,174 32 $30,472 Police - Other
50 $159,787 $38,349 0 $0 Streets and Highways
40 $101,529 $30,459 0 $0 Solid Waste Management
29 $132,856 $54,975 0 $0 Financial Administration
23 $102,077 $53,258 0 $0 Local Libraries
19 $60,888 $38,456 12 $16,556 Judicial and Legal
18 $68,502 $45,668 0 $0 Sewerage
14 $47,081 $40,355 0 $0 Health
11 $34,631 $37,779 0 $0 Fire - Other
8 $25,998 $38,997 0 $0 Housing and Community Development (Local)
3 $13,389 $53,556 0 $0
Totals for Government
659 $3,041,404 $55,382 44 $47,028
Mission government finances - Expenditure in 2021 (per resident):
Construction - General - Other: $2,908,000 ($33.57)
Sewerage: $2,425,000 ($27.99)Water Utilities: $2,203,000 ($25.43)Regular Highways: $1,258,000 ($14.52)Central Staff Services: $307,000 ($3.54)Parks and Recreation: $13,000 ($0.15)Health - Other: $12,000 ($0.14)Current Operations - Police Protection: $17,433,000 ($201.22)
General - Other: $9,658,000 ($111.48)Water Utilities: $8,955,000 ($103.36)Local Fire Protection: $7,831,000 ($90.39)Solid Waste Management: $5,533,000 ($63.87)Parks and Recreation: $4,244,000 ($48.99)Regular Highways: $3,669,000 ($42.35)Sewerage: $3,642,000 ($42.04)Central Staff Services: $3,376,000 ($38.97)Libraries: $1,533,000 ($17.69)Housing and Community Development: $1,365,000 ($15.76)Protective Inspection and Regulation - Other: $925,000 ($10.68)Judicial and Legal Services: $907,000 ($10.47)General Public Buildings: $859,000 ($9.92)Financial Administration: $682,000 ($7.87)Health - Other: $454,000 ($5.24)Miscellaneous Commercial Activities - Other: $1,000 ($0.01)General - Interest on Debt: $11,943,000 ($137.85)
Other Capital Outlay - Solid Waste Management: $85,000 ($0.98)
Local Fire Protection: $56,000 ($0.65)Miscellaneous Commercial Activities - Other: $2,000 ($0.02)Parks and Recreation: $1,000 ($0.01)Total Salaries and Wages: $23,465,000 ($270.85)
Water Utilities - Interest on Debt: $806,000 ($9.30)
Mission government finances - Revenue in 2021 (per resident):
Charges - Solid Waste Management: $7,507,000 ($86.65)
Sewerage: $7,044,000 ($81.31)Parks and Recreation: $1,354,000 ($15.63)Other: $876,000 ($10.11)Miscellaneous Commercial Activities: $10,000 ($0.12)Federal Intergovernmental - Housing and Community Development: $1,545,000 ($17.83)
Local Intergovernmental - Other: $3,347,000 ($38.63)
Highways: $313,000 ($3.61)Miscellaneous - Interest Earnings: $15,779,000 ($182.13)
General Revenue - Other: $1,452,000 ($16.76)Special Assessments: $1,152,000 ($13.30)Fines and Forfeits: $1,083,000 ($12.50)Sale of Property: $70,000 ($0.81)Revenue - Water Utilities: $13,563,000 ($156.55)
State Intergovernmental - Other: $2,761,000 ($31.87)
Highways: $177,000 ($2.04)General Local Government Support: $31,000 ($0.36)Tax - Property: $24,239,000 ($279.78)
General Sales and Gross Receipts: $19,505,000 ($225.14)Public Utilities Sales: $3,378,000 ($38.99)Other Selective Sales: $956,000 ($11.03)Other License: $701,000 ($8.09)
Mission government finances - Debt in 2021 (per resident):
Long Term Debt - Beginning Outstanding - Public Debt for Private Purpose: $258,540,000 ($2984.24)
Outstanding Nonguaranteed - Industrial Revenue: $249,298,000 ($2877.57)Beginning Outstanding - Unspecified Public Purpose: $54,620,000 ($630.46)Outstanding Unspecified Public Purpose: $47,905,000 ($552.95)Retired Nonguaranteed - Public Debt for Private Purpose: $9,242,000 ($106.68)Retired Unspecified Public Purpose: $6,715,000 ($77.51)
Mission government finances - Cash and Securities in 2021 (per resident):
Bond Funds - Cash and Securities: $1,557,000 ($17.97)
Other Funds - Cash and Securities: $39,686,000 ($458.08)
Sinking Funds - Cash and Securities: $344,871,000 ($3980.74)
2.90% of this county's 2021 resident taxpayers lived in other counties in 2020 ($46,406 average adjusted gross income )
Here:
2.90%Texas average:
8.12%
0.01% of residents moved from foreign countries ($200 average AGI )Hidalgo County:
0.01%Texas average:
0.04%
Top counties from which taxpayers relocated into this county between 2020 and 2021:
2.73% of this county's 2020 resident taxpayers moved to other counties in 2021 ($45,511 average adjusted gross income )
Here:
2.73%Texas average:
7.40%
0.01% of residents moved to foreign countries ($147 average AGI )Hidalgo County:
0.01%Texas average:
0.03%
Top counties to which taxpayers relocated from this county between 2020 and 2021:
Businesses in Mission, TX
Name Count Name Count
AT&T 1 KFC 1 Advance Auto Parts 1 Kohl's 1 AutoZone 3 La Quinta 1 Baskin-Robbins 1 Lane Bryant 1 Best Western 1 Lane Furniture 1 Blockbuster 2 Little Caesars Pizza 3 Burger King 2 Long John Silver's 1 Chevrolet 1 Mazda 1 Chick-Fil-A 1 McDonald's 3 Church's Chicken 2 Motel 6 1 ColorTyme 1 Nike 4 Comfort Inn 1 Office Depot 1 Cricket Wireless 20 Penske 1 Curves 1 Pizza Hut 4 DHL 1 Quiznos 2 Dairy Queen 1 RadioShack 2 Dennys 1 Sprint Nextel 2 Domino's Pizza 1 Starbucks 1 Famous Footwear 1 Subway 6 FedEx 6 T-Mobile 6 Firestone Complete Auto Care 1 T.J.Maxx 1 GNC 1 Taco Bell 1 GameStop 1 Target 1 H&R Block 3 U-Haul 3 Hilton 1 UPS 6 Holiday Inn 1 Volkswagen 1 Home Depot 1 Walgreens 1 IHOP 1 Walmart 1 Jack In The Box 1 Wendy's 1
Strongest AM radio stations in Mission:
KURV (710 AM; 10 kW; EDINBURG, TX; Owner: VOICE OF VALLEY AGRICULTURE, INC.)
KRIO (910 AM; 5 kW; MCALLEN, TX; Owner: RIO GRANDE BIBLE INSTITUTE, INC.)
KGBT (1530 AM; 50 kW; HARLINGEN, TX; Owner: TICHENOR LICENSE CORPORATION)
KUBR (1210 AM; 10 kW; SAN JUAN, TX; Owner: PAULINO BERNAL)
KVJY (840 AM; 5 kW; PHARR, TX; Owner: RADIO UNICA OF MCALLEN LICENSE CORP.)
KIRT (1580 AM; 1 kW; MISSION, TX; Owner: BRAVO BROADCASTING COMPANY, INC.)
KRGE (1290 AM; 5 kW; WESLACO, TX; Owner: CHRISTIAN MINISTRIES OF THE VALLEY)
KQXX (1700 AM; 10 kW; BROWNSVILLE, TX; Owner: LA NUEVA KBOR, INC.)
KCTA (1030 AM; 50 kW; CORPUS CHRISTI, TX; Owner: BROADCASTING CORPORATION OF THE SOUTHWEST)
KBOR (1600 AM; 10 kW; BROWNSVILLE, TX; Owner: LA NUEVA KBOR, INC.)
KKYX (680 AM; 50 kW; SAN ANTONIO, TX; Owner: CXR HOLDINGS, INC.)
KTKR (760 AM; 50 kW; SAN ANTONIO, TX; Owner: CCB TEXAS LICENSES, L.P.)
WOAI (1200 AM; 50 kW; SAN ANTONIO, TX; Owner: CCB TEXAS LICENSES, L.P.)
Strongest FM radio stations in Mission:
KQXX-FM (105.5 FM; MISSION, TX; Owner: LA NUEVA KBOR, INC.)
KVLY (107.9 FM; EDINBURG, TX; Owner: ENTRAVISION HOLDINGS, L.L.C.)
KTEX (100.3 FM; BROWNSVILLE, TX; Owner: CAPSTAR TX LIMITED PARTNERSHIP)
KOIR (88.5 FM; EDINBURG, TX; Owner: RIO GRANDE BIBLE INSTITUTE, INC.)
KBFM (104.1 FM; EDINBURG, TX; Owner: CAPSTAR TX LIMITED PARTNERSHIP)
KVMV (96.9 FM; MCALLEN, TX; Owner: WORLD RADIO NETWORK, INC.)
KFRQ (94.5 FM; HARLINGEN, TX; Owner: ENTRAVISION HOLDINGS, L.L.C.)
KGBT-FM (98.5 FM; MCALLEN, TX; Owner: TICHENOR LICENSE CORPORATION ("TLC"))
KHID (88.1 FM; MCALLEN, TX; Owner: RGV EDUCATIONAL BROADCASTING, INC.)
KQBO (103.1 FM; RIO GRANDE CITY, TX; Owner: SOUND INVESTMENTS UNLIMITED, INC.)
KKPS (99.5 FM; BROWNSVILLE, TX; Owner: ENTRAVISION HOLDINGS, L.L.C.)
KBTQ (96.1 FM; HARLINGEN, TX; Owner: TICHENOR LICENSE CORPORATION ("TLC"))
KJAV (104.9 FM; ALAMO, TX; Owner: PAULINO BERNAL)
KCAS (91.5 FM; MCCOOK, TX; Owner: FAITH BAPTIST CHURCH INC)
KMAZ (106.3 FM; MERCEDES, TX; Owner: LA NUEVA KBOR, INC.)
TV broadcast stations around Mission:
KSFE-LP (Channel 67; McALLEN, TX; Owner: ORTIZ BROADCASTING CORPORATION)
KLIA-LP (Channel 32; McALLEN, TX; Owner: ORTIZ BROADCASTING CORPORATION)
K57FE (Channel 57; MCALLEN, TX; Owner: CHANNEL 57, INC.)
KZMC-LP (Channel 35; McALLEN, TX; Owner: ZAVALETTA BROADCASTING OF THE RIO GRANDE VALLEY, LLC)
KSTI-LP (Channel 69; McALLEN, TX; Owner: FAITH PLEASES GOD CHURCH CORPORATION)
KJST-LP (Channel 28; McALLEN, TX; Owner: FAITH PLEASES GOD CHURCH CORPORATION)
KTLM (Channel 40; RIO GRANDE CITY, TX; Owner: SUNBELT MULTIMEDIA CO.)
KRGV-TV (Channel 5; WESLACO, TX; Owner: MOBILE VIDEO TAPES, INC.)
KNVO (Channel 48; Mc ALLEN, TX; Owner: ENTRAVISION HOLDINGS, LLC)
KVEO (Channel 23; BROWNSVILLE, TX; Owner: COMCORP OF TEXAS LICENSE CORP.)
KGBT-TV (Channel 4; HARLINGEN, TX; Owner: LIBCO, INC.)
KMBH (Channel 60; HARLINGEN, TX; Owner: RGV EDUCATIONAL BROADCASTING, INC.)
KLUJ (Channel 44; HARLINGEN, TX; Owner: COMMUNITY EDUCATIONAL TELEVISION)
KFTN-LP (Channel 30; La FERIA, TX; Owner: ORTIZ BROADCASTING CORPORATION)
Medal of Honor Recipients
Medal of Honor Recipient born in Mission: Jose M. Lopez.
National Bridge Inventory (NBI) Statistics 59 Number of bridges2,657ft / 810m Total length $40,000 Total costs679,891 Total average daily traffic44,989 Total average daily truck traffic
New bridges - historical statistics
1 1930-1939 2 1960-1969 2 1970-1979 4 1980-1989 11 1990-1999 22 2000-2009 17 2010-2019
See full National Bridge Inventory statistics for Mission, TX
Home Mortgage Disclosure Act Aggregated Statistics For Year 2009(Based on 3 full and 3 partial tracts) A) FHA, FSA/RHS & VA B) Conventional C) Refinancings D) Home Improvement Loans E) Loans on Dwellings For 5+ Families F) Non-occupant Loans on G) Loans On Manufactured Number Average Value Number Average Value Number Average Value Number Average Value Number Average Value Number Average Value Number Average Value
LOANS ORIGINATED 177 $133,217 222 $160,880 269 $131,424 33 $30,659 2 $155,000 59 $141,359 6 $32,652 APPLICATIONS APPROVED, NOT ACCEPTED 7 $121,907 29 $154,413 76 $124,178 9 $41,810 0 $0 9 $130,011 0 $0 APPLICATIONS DENIED 42 $116,442 66 $129,375 332 $113,383 128 $34,602 0 $0 23 $82,704 7 $43,420 APPLICATIONS WITHDRAWN 24 $143,437 26 $166,758 104 $120,729 13 $45,797 0 $0 14 $129,411 0 $0 FILES CLOSED FOR INCOMPLETENESS 13 $126,895 7 $115,066 47 $96,630 25 $53,594 0 $0 3 $55,327 0 $0
Aggregated Statistics For Year 2008(Based on 3 full and 3 partial tracts) A) FHA, FSA/RHS & VA B) Conventional C) Refinancings D) Home Improvement Loans E) Loans on Dwellings For 5+ Families F) Non-occupant Loans on G) Loans On Manufactured Number Average Value Number Average Value Number Average Value Number Average Value Number Average Value Number Average Value Number Average Value
LOANS ORIGINATED 127 $134,208 378 $144,630 255 $123,690 94 $28,742 1 $1,490,460 99 $127,645 10 $28,702 APPLICATIONS APPROVED, NOT ACCEPTED 17 $112,512 59 $143,095 86 $130,263 21 $28,333 0 $0 13 $92,075 3 $46,253 APPLICATIONS DENIED 34 $109,529 149 $128,358 599 $120,081 211 $36,856 3 $329,597 54 $87,890 19 $28,771 APPLICATIONS WITHDRAWN 20 $129,205 53 $156,719 117 $153,131 18 $78,566 0 $0 11 $123,433 4 $53,758 FILES CLOSED FOR INCOMPLETENESS 13 $116,591 17 $134,414 51 $117,685 20 $37,976 0 $0 2 $139,160 0 $0
Aggregated Statistics For Year 2007(Based on 3 full and 3 partial tracts) A) FHA, FSA/RHS & VA B) Conventional C) Refinancings D) Home Improvement Loans E) Loans on Dwellings For 5+ Families F) Non-occupant Loans on G) Loans On Manufactured Number Average Value Number Average Value Number Average Value Number Average Value Number Average Value Number Average Value Number Average Value
LOANS ORIGINATED 71 $110,835 782 $123,526 381 $125,097 151 $40,878 8 $1,019,599 165 $125,552 18 $25,792 APPLICATIONS APPROVED, NOT ACCEPTED 3 $158,220 119 $108,303 132 $126,559 40 $62,046 1 $314,000 22 $80,850 10 $38,427 APPLICATIONS DENIED 15 $124,248 286 $122,982 725 $110,741 265 $40,500 1 $225,790 97 $112,407 19 $30,682 APPLICATIONS WITHDRAWN 11 $115,404 126 $124,889 252 $113,111 33 $73,693 1 $520,000 35 $118,631 2 $62,520 FILES CLOSED FOR INCOMPLETENESS 2 $70,565 27 $127,709 94 $147,059 22 $60,151 0 $0 4 $98,865 0 $0
Aggregated Statistics For Year 2006(Based on 3 full and 3 partial tracts) A) FHA, FSA/RHS & VA B) Conventional C) Refinancings D) Home Improvement Loans E) Loans on Dwellings For 5+ Families F) Non-occupant Loans on G) Loans On Manufactured Number Average Value Number Average Value Number Average Value Number Average Value Number Average Value Number Average Value Number Average Value
LOANS ORIGINATED 72 $119,390 978 $107,802 437 $110,853 143 $43,856 6 $571,743 167 $98,666 18 $23,617 APPLICATIONS APPROVED, NOT ACCEPTED 5 $80,890 167 $96,987 139 $118,595 36 $28,882 0 $0 17 $65,084 8 $33,111 APPLICATIONS DENIED 9 $83,524 356 $98,431 626 $105,894 254 $33,320 3 $368,333 97 $74,843 17 $27,814 APPLICATIONS WITHDRAWN 9 $101,333 163 $113,518 361 $110,485 32 $47,141 0 $0 22 $140,631 5 $40,986 FILES CLOSED FOR INCOMPLETENESS 2 $86,080 48 $105,964 86 $139,608 6 $64,035 0 $0 7 $107,116 0 $0
Aggregated Statistics For Year 2005(Based on 3 full and 3 partial tracts) A) FHA, FSA/RHS & VA B) Conventional C) Refinancings D) Home Improvement Loans E) Loans on Dwellings For 5+ Families F) Non-occupant Loans on G) Loans On Manufactured Number Average Value Number Average Value Number Average Value Number Average Value Number Average Value Number Average Value Number Average Value
LOANS ORIGINATED 78 $110,503 885 $104,192 507 $107,134 135 $55,962 6 $365,548 161 $95,942 24 $25,449 APPLICATIONS APPROVED, NOT ACCEPTED 9 $66,936 156 $82,726 113 $93,233 33 $46,504 0 $0 22 $102,950 10 $35,577 APPLICATIONS DENIED 15 $94,593 350 $86,731 731 $85,513 286 $31,857 2 $110,000 93 $77,842 32 $28,251 APPLICATIONS WITHDRAWN 9 $88,757 167 $106,223 380 $104,967 92 $158,760 0 $0 29 $96,481 2 $28,500 FILES CLOSED FOR INCOMPLETENESS 3 $119,667 35 $118,614 164 $113,978 3 $39,333 0 $0 7 $98,543 0 $0
Aggregated Statistics For Year 2004(Based on 3 full and 3 partial tracts) A) FHA, FSA/RHS & VA B) Conventional C) Refinancings D) Home Improvement Loans E) Loans on Dwellings For 5+ Families F) Non-occupant Loans on G) Loans On Manufactured Number Average Value Number Average Value Number Average Value Number Average Value Number Average Value Number Average Value Number Average Value
LOANS ORIGINATED 93 $106,067 682 $104,696 631 $95,694 109 $34,976 20 $238,842 132 $89,691 18 $28,931 APPLICATIONS APPROVED, NOT ACCEPTED 2 $108,370 128 $94,136 148 $73,249 29 $38,768 2 $188,500 12 $128,647 16 $37,823 APPLICATIONS DENIED 32 $99,409 236 $85,806 633 $79,657 153 $25,996 1 $113,210 39 $78,859 59 $36,428 APPLICATIONS WITHDRAWN 15 $3,785,587 84 $83,168 286 $90,419 18 $36,364 6 $70,167 14 $54,805 11 $52,123 FILES CLOSED FOR INCOMPLETENESS 7 $75,429 20 $105,854 154 $107,307 5 $25,316 0 $0 2 $140,645 1 $93,960
Aggregated Statistics For Year 2003(Based on 3 full and 3 partial tracts) A) FHA, FSA/RHS & VA B) Conventional C) Refinancings D) Home Improvement Loans E) Loans on Dwellings For 5+ Families F) Non-occupant Loans on Number Average Value Number Average Value Number Average Value Number Average Value Number Average Value Number Average Value
LOANS ORIGINATED 121 $95,351 584 $103,762 872 $97,806 80 $27,140 3 $118,333 107 $83,926 APPLICATIONS APPROVED, NOT ACCEPTED 10 $97,251 81 $94,212 180 $80,811 17 $36,792 0 $0 15 $79,921 APPLICATIONS DENIED 41 $92,197 185 $85,109 738 $80,555 196 $14,267 0 $0 49 $64,832 APPLICATIONS WITHDRAWN 30 $89,388 104 $106,684 282 $81,958 10 $49,404 0 $0 19 $141,755 FILES CLOSED FOR INCOMPLETENESS 5 $95,200 12 $106,516 46 $114,245 3 $57,520 0 $0 1 $55,000
Aggregated Statistics For Year 2002(Based on 2 full and 2 partial tracts) A) FHA, FSA/RHS & VA B) Conventional C) Refinancings D) Home Improvement Loans E) Loans on Dwellings For 5+ Families F) Non-occupant Loans on Number Average Value Number Average Value Number Average Value Number Average Value Number Average Value Number Average Value
LOANS ORIGINATED 97 $93,242 602 $91,468 450 $97,942 66 $19,562 1 $175,000 76 $96,393 APPLICATIONS APPROVED, NOT ACCEPTED 3 $126,233 69 $93,465 96 $90,978 14 $22,939 0 $0 12 $80,781 APPLICATIONS DENIED 17 $88,704 150 $63,909 340 $74,227 98 $13,886 0 $0 24 $56,928 APPLICATIONS WITHDRAWN 12 $91,390 45 $120,811 142 $75,224 8 $23,668 0 $0 12 $78,633 FILES CLOSED FOR INCOMPLETENESS 2 $70,220 16 $103,394 33 $96,338 0 $0 0 $0 4 $56,160
Aggregated Statistics For Year 2001(Based on 2 full and 2 partial tracts) A) FHA, FSA/RHS & VA B) Conventional C) Refinancings D) Home Improvement Loans E) Loans on Dwellings For 5+ Families F) Non-occupant Loans on Number Average Value Number Average Value Number Average Value Number Average Value Number Average Value Number Average Value
LOANS ORIGINATED 98 $86,256 426 $91,300 350 $91,192 84 $12,938 5 $143,810 85 $78,215 APPLICATIONS APPROVED, NOT ACCEPTED 2 $66,500 77 $65,611 82 $74,574 11 $11,425 0 $0 10 $54,205 APPLICATIONS DENIED 23 $75,266 194 $55,832 244 $71,463 78 $12,717 0 $0 18 $52,223 APPLICATIONS WITHDRAWN 11 $64,815 46 $87,598 134 $81,285 7 $21,997 0 $0 13 $120,963 FILES CLOSED FOR INCOMPLETENESS 2 $101,000 6 $86,208 28 $86,609 1 $16,000 0 $0 1 $54,750
Aggregated Statistics For Year 2000(Based on 2 full and 2 partial tracts) A) FHA, FSA/RHS & VA B) Conventional C) Refinancings D) Home Improvement Loans E) Loans on Dwellings For 5+ Families F) Non-occupant Loans on Number Average Value Number Average Value Number Average Value Number Average Value Number Average Value Number Average Value
LOANS ORIGINATED 71 $71,104 385 $82,072 165 $70,291 86 $15,864 2 $140,000 68 $66,017 APPLICATIONS APPROVED, NOT ACCEPTED 7 $42,560 82 $53,171 50 $74,095 13 $16,778 0 $0 2 $29,930 APPLICATIONS DENIED 23 $63,284 363 $42,634 118 $61,730 89 $11,673 0 $0 22 $33,356 APPLICATIONS WITHDRAWN 6 $93,572 43 $69,226 53 $71,156 4 $7,798 0 $0 8 $73,341 FILES CLOSED FOR INCOMPLETENESS 2 $78,000 16 $96,756 22 $74,326 0 $0 0 $0 1 $134,000
Aggregated Statistics For Year 1999(Based on 2 full and 3 partial tracts) A) FHA, FSA/RHS & VA B) Conventional C) Refinancings D) Home Improvement Loans E) Loans on Dwellings For 5+ Families F) Non-occupant Loans on Number Average Value Number Average Value Number Average Value Number Average Value Number Average Value Number Average Value
LOANS ORIGINATED 109 $68,630 456 $68,222 262 $71,479 167 $11,782 2 $176,190 89 $50,418 APPLICATIONS APPROVED, NOT ACCEPTED 3 $74,120 116 $50,427 76 $61,682 31 $14,223 0 $0 7 $94,784 APPLICATIONS DENIED 22 $60,011 399 $42,890 151 $62,150 217 $8,181 0 $0 33 $69,931 APPLICATIONS WITHDRAWN 14 $72,954 57 $91,269 114 $67,024 11 $11,775 0 $0 12 $91,133 FILES CLOSED FOR INCOMPLETENESS 3 $78,423 17 $72,774 27 $63,914 5 $22,650 0 $0 1 $37,470
Detailed HMDA statistics for the following Tracts:
0201.00
, 0202.02 , 0202.03 , 0203.00 , 0204.01 , 0204.02
Private Mortgage Insurance Companies Aggregated Statistics For Year 2009(Based on 3 full and 3 partial tracts) A) Conventional B) Refinancings C) Non-occupant Loans on Number Average Value Number Average Value Number Average Value
LOANS ORIGINATED 52 $179,670 14 $199,753 0 $0 APPLICATIONS APPROVED, NOT ACCEPTED 16 $193,872 12 $182,552 1 $44,000 APPLICATIONS DENIED 5 $137,800 3 $202,507 0 $0 APPLICATIONS WITHDRAWN 4 $153,378 3 $141,333 0 $0 FILES CLOSED FOR INCOMPLETENESS 1 $114,120 0 $0 0 $0
Aggregated Statistics For Year 2008(Based on 3 full and 3 partial tracts) A) Conventional B) Refinancings C) Non-occupant Loans on Number Average Value Number Average Value Number Average Value
LOANS ORIGINATED 138 $149,889 31 $177,104 14 $91,341 APPLICATIONS APPROVED, NOT ACCEPTED 47 $146,482 21 $155,509 3 $99,447 APPLICATIONS DENIED 14 $180,806 12 $134,418 8 $133,625 APPLICATIONS WITHDRAWN 9 $197,348 1 $181,490 1 $130,000 FILES CLOSED FOR INCOMPLETENESS 5 $143,000 2 $141,500 0 $0
Aggregated Statistics For Year 2007(Based on 3 full and 3 partial tracts) A) Conventional B) Refinancings C) Non-occupant Loans on D) Loans On Manufactured Number Average Value Number Average Value Number Average Value Number Average Value
LOANS ORIGINATED 249 $133,475 31 $138,416 33 $88,764 1 $45,000 APPLICATIONS APPROVED, NOT ACCEPTED 37 $155,406 9 $174,821 1 $148,770 0 $0 APPLICATIONS DENIED 6 $103,395 0 $0 2 $106,000 0 $0 APPLICATIONS WITHDRAWN 11 $124,000 4 $104,000 6 $108,740 0 $0 FILES CLOSED FOR INCOMPLETENESS 0 $0 0 $0 0 $0 0 $0
Aggregated Statistics For Year 2006(Based on 3 full and 3 partial tracts) A) Conventional B) Refinancings C) Non-occupant Loans on Number Average Value Number Average Value Number Average Value
LOANS ORIGINATED 150 $133,026 21 $125,820 9 $158,270 APPLICATIONS APPROVED, NOT ACCEPTED 20 $140,906 8 $109,538 3 $186,707 APPLICATIONS DENIED 3 $88,747 1 $86,000 1 $134,240 APPLICATIONS WITHDRAWN 8 $143,989 0 $0 1 $50,000 FILES CLOSED FOR INCOMPLETENESS 1 $293,000 0 $0 1 $293,000
Aggregated Statistics For Year 2005(Based on 3 full and 3 partial tracts) A) Conventional B) Refinancings C) Non-occupant Loans on Number Average Value Number Average Value Number Average Value
LOANS ORIGINATED 152 $124,144 27 $153,656 19 $114,240 APPLICATIONS APPROVED, NOT ACCEPTED 15 $176,483 8 $100,592 0 $0 APPLICATIONS DENIED 1 $74,660 1 $131,000 1 $131,000 APPLICATIONS WITHDRAWN 4 $97,370 2 $165,500 0 $0 FILES CLOSED FOR INCOMPLETENESS 1 $100,000 0 $0 0 $0
Aggregated Statistics For Year 2004(Based on 3 full and 3 partial tracts) A) Conventional B) Refinancings C) Non-occupant Loans on Number Average Value Number Average Value Number Average Value
LOANS ORIGINATED 166 $121,181 55 $118,562 15 $122,463 APPLICATIONS APPROVED, NOT ACCEPTED 27 $108,726 12 $113,062 4 $86,450 APPLICATIONS DENIED 2 $168,325 2 $73,500 0 $0 APPLICATIONS WITHDRAWN 5 $117,044 4 $113,165 1 $146,220 FILES CLOSED FOR INCOMPLETENESS 2 $158,445 2 $267,035 0 $0
Aggregated Statistics For Year 2003(Based on 3 full and 3 partial tracts) A) Conventional B) Refinancings C) Non-occupant Loans on Number Average Value Number Average Value Number Average Value
LOANS ORIGINATED 184 $116,087 126 $105,857 10 $59,383 APPLICATIONS APPROVED, NOT ACCEPTED 48 $114,832 27 $99,388 4 $49,250 APPLICATIONS DENIED 8 $94,891 5 $65,600 5 $70,200 APPLICATIONS WITHDRAWN 12 $132,099 3 $103,087 3 $46,667 FILES CLOSED FOR INCOMPLETENESS 0 $0 3 $157,667 1 $63,000
Aggregated Statistics For Year 2002(Based on 2 full and 2 partial tracts) A) Conventional B) Refinancings C) Non-occupant Loans on Number Average Value Number Average Value Number Average Value
LOANS ORIGINATED 149 $106,776 84 $110,969 8 $71,580 APPLICATIONS APPROVED, NOT ACCEPTED 21 $107,766 11 $137,823 1 $47,000 APPLICATIONS DENIED 1 $117,620 1 $86,000 0 $0 APPLICATIONS WITHDRAWN 4 $110,750 2 $180,000 0 $0 FILES CLOSED FOR INCOMPLETENESS 2 $114,300 3 $51,333 2 $47,000
Aggregated Statistics For Year 2001(Based on 2 full and 2 partial tracts) A) Conventional B) Refinancings C) Non-occupant Loans on Number Average Value Number Average Value Number Average Value
LOANS ORIGINATED 118 $108,807 46 $117,175 3 $42,587 APPLICATIONS APPROVED, NOT ACCEPTED 13 $133,498 8 $154,810 1 $82,000 APPLICATIONS DENIED 1 $87,110 2 $60,000 0 $0 APPLICATIONS WITHDRAWN 2 $197,860 2 $105,925 0 $0 FILES CLOSED FOR INCOMPLETENESS 0 $0 4 $84,238 0 $0
Aggregated Statistics For Year 2000(Based on 2 full and 2 partial tracts) A) Conventional B) Refinancings C) Non-occupant Loans on Number Average Value Number Average Value Number Average Value
LOANS ORIGINATED 87 $93,902 29 $111,663 3 $77,333 APPLICATIONS APPROVED, NOT ACCEPTED 21 $108,123 10 $108,501 0 $0 APPLICATIONS DENIED 10 $111,300 3 $107,667 0 $0 APPLICATIONS WITHDRAWN 4 $71,265 0 $0 0 $0 FILES CLOSED FOR INCOMPLETENESS 5 $91,600 3 $140,667 1 $131,000
Aggregated Statistics For Year 1999(Based on 2 full and 3 partial tracts) A) Conventional B) Refinancings C) Non-occupant Loans on Number Average Value Number Average Value Number Average Value
LOANS ORIGINATED 122 $101,511 37 $100,699 4 $67,062 APPLICATIONS APPROVED, NOT ACCEPTED 14 $96,096 10 $97,124 0 $0 APPLICATIONS DENIED 4 $176,978 3 $91,330 0 $0 APPLICATIONS WITHDRAWN 6 $111,787 0 $0 0 $0 FILES CLOSED FOR INCOMPLETENESS 3 $126,313 0 $0 0 $0
Detailed PMIC statistics for the following Tracts:
0201.00
, 0202.02 , 0202.03 , 0203.00 , 0204.01 , 0204.02 Fire-safe hotels and motels in Mission, Texas:
La Quinta Inn & Suites, 805 Travis St, Mission, Texas 78572 Phone: (956) 581-7772, Fax: (956) 580-2288
Hampton Inn & Suites-Mission, 2505 Victoria Ave, Mission, Texas 78572 Phone: (956) 682-0333, Fax: (956) 682-0332
Best Western Las Palmas Inn, 609 E Expy 83, Mission, Texas 78572 Phone: (956) 583-9290, Fax: (956) 583-9292
Motel 6, 1813 E Exressway 83, Mission, Texas 78572 Phone: (956) 581-1919, Fax: (956) 581-1966
Clarion Inn & Suites, 3700 Plantation Grove Blvd, Mission, Texas 78572 Phone: (956) 519-9696, Fax: (956) 580-0606
All 5 fire-safe hotels and motels in Mission, Texas
Most common first names in Mission, TX among deceased individuals Name Count Lived (average)
Maria 375 74.7 years Jose 250 68.6 years John 127 76.4 years Juan 126 71.2 years Guadalupe 117 75.3 years William 107 77.5 years James 103 74.3 years Jesus 98 70.8 years Robert 91 74.8 years Manuel 89 73.5 years
Most common last names in Mission, TX among deceased individuals Last name Count Lived (average)
Garza 296 73.3 years Garcia 269 72.6 years Gonzalez 180 72.8 years Rodriguez 168 75.1 years Martinez 167 71.7 years Flores 130 75.3 years Perez 122 73.0 years Lopez 117 74.0 years Salinas 117 70.5 years Hernandez 98 71.1 years
Mission compared to Texas state average:
Median house value below state average. Black race population percentage significantly below state average. Hispanic race population percentage significantly above state average. Foreign-born population percentage significantly above state average. House age below state average.
#1 on the list of "Top 101 cities with largest percentage of females in industries: other services, except public administration (population 50,000+)"
#2 on the list of "Top 101 cities with the most people below 50% of the poverty level, excluding cities with 15% or more of residents in college and with the median age below 28 (population 50,000+)"
#3 on the list of "Top 101 cities with largest percentage of females in industries: retail trade (population 50,000+)"
#4 on the list of "Top 101 cities with the most people below the poverty level, excluding cities with 15% or more of residents in college and with the median age below 28 (population 50,000+)"
#6 on the list of "Top 101 cities with the smallest percentage of high school students in private schools (3,000+ students)"
#10 on the list of "Top 101 cities with the largest percentage of people in hospitals/wards, hospices, and schools for the handicapped (population 1,000+)"
#10 on the list of "Top 101 cities with the largest percentage of people in schools, hospitals, or wards for the physically handicapped (population 1,000+)"
#10 on the list of "Top 101 cities with the largest percentage of people in on base quarters (population 1,000+)"
#10 on the list of "Top 101 cities with the largest percentage of people in noninstitutionalized settings (population 1,000+)"
#10 on the list of "Top 101 cities with the largest percentage of people in long-term care (population 1,000+)"
#10 on the list of "Top 101 cities with the largest percentage of people in military quarters (population 1,000+)"
#10 on the list of "Top 101 cities with the largest percentage of people in dormitories (population 1,000+)"
#10 on the list of "Top 101 cities with the largest percentage of people in group homes (population 1,000+)"
#18 on the list of "Top 101 cities with largest percentage of males in occupations: construction and extraction occupations (population 50,000+)"
#20 on the list of "Top 101 cities with largest percentage of males in occupations: transportation occupations (population 50,000+)"
#22 on the list of "Top 101 cities with the lowest percentage of English-only speaking households, population 50,000+"
#23 on the list of "Top 101 cities with the smallest percentage of elementary and middle school students in private schools (5,000+ students)"
#25 on the list of "Top 100 least racially diverse cities (pop. 50,000+)"
#30 on the list of "Top 101 cities with the lowest number of arson incidents per 100,000 residents (population 50,000+)"
#32 on the list of "Top 101 cities with largest percentage of males in industries: agriculture, forestry, fishing and hunting (population 50,000+)"
#4 on the list of "Top 101 counties with the worst general health status score of residents (1-5), 3 years of data"
#4 on the list of "Top 101 counties with the highest number of births per 1000 residents 2007-2013"
#5 on the list of "Top 101 counties with the lowest percentage of residents relocating to other counties in 2011"
#7 on the list of "Top 101 counties with the lowest percentage of residents that smoked 100+ cigarettes in their lives"
#8 on the list of "Top 101 counties with the lowest percentage of residents that exercised in the past month"
Top Patent Applicants
Ed Peno (12)
Diego Suarez Del Real Pena (3)
Alfred Salazar (3)
Teodoro A. Cantu (2)
Luis Esteban Hernandez (2)
Justin R. Kent (2)
John Bougneit (2)
Geraldo Leonel Guerra (1)
Roel Perez (1)
Michael J. Madden (1)
Total of 47 patent applications in 2008-2024.


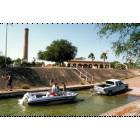
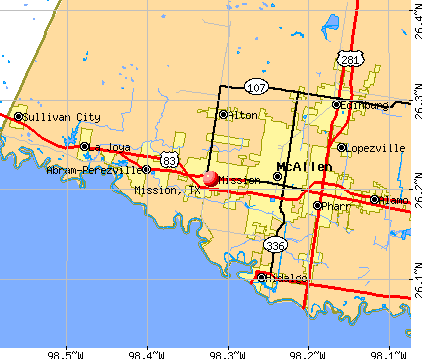


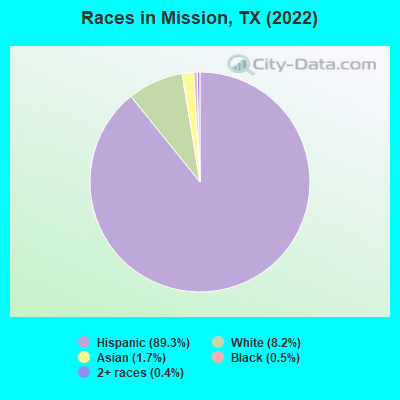
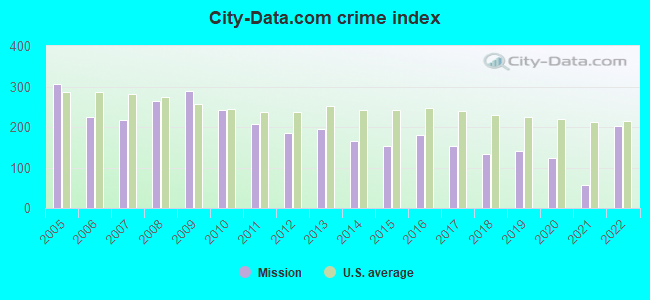
 Recent articles from our blog. Our writers, many of them Ph.D. graduates or candidates, create easy-to-read articles on a wide variety of topics.

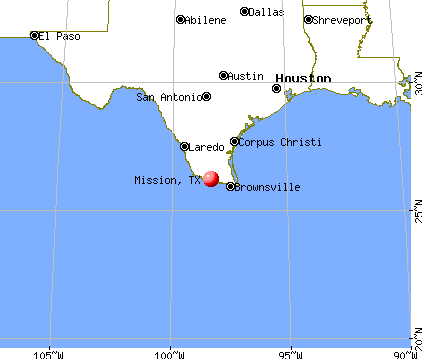
 (5.3 miles
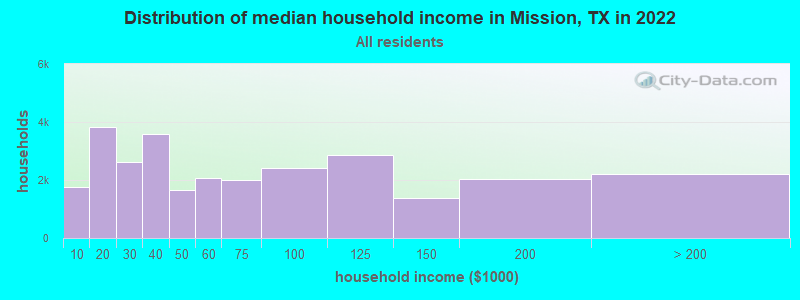
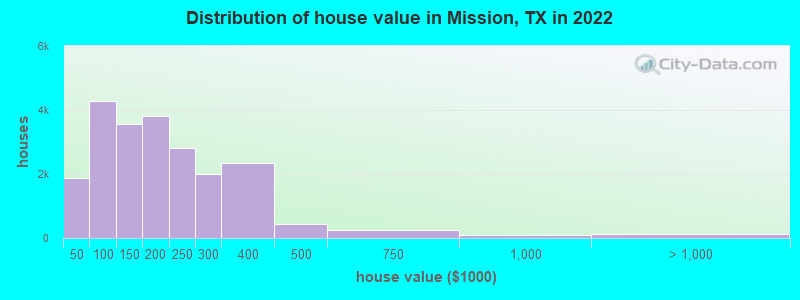


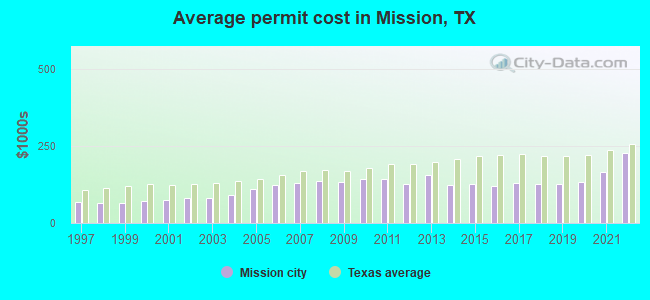
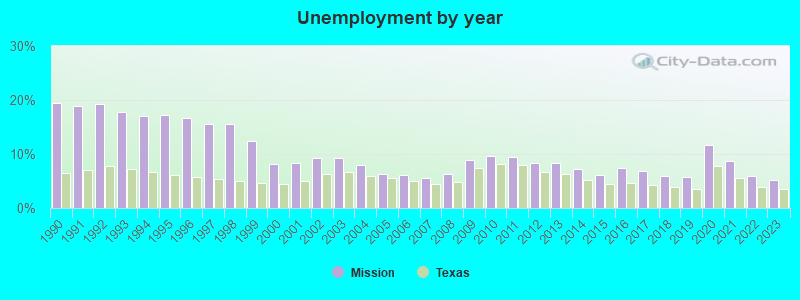
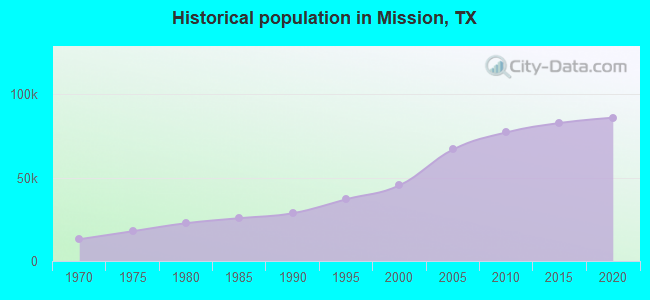
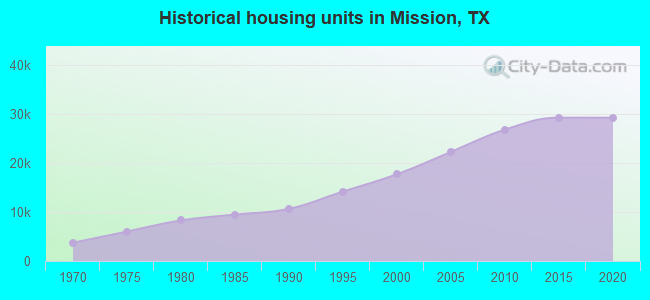
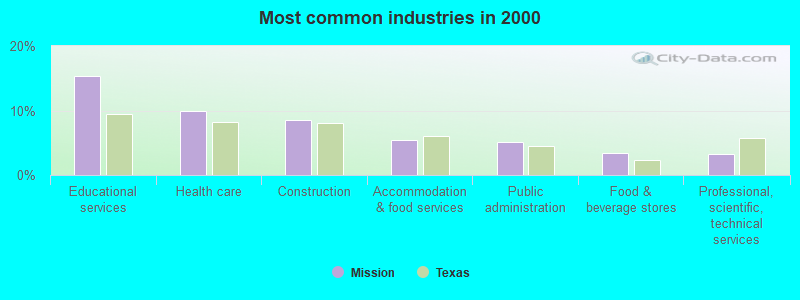
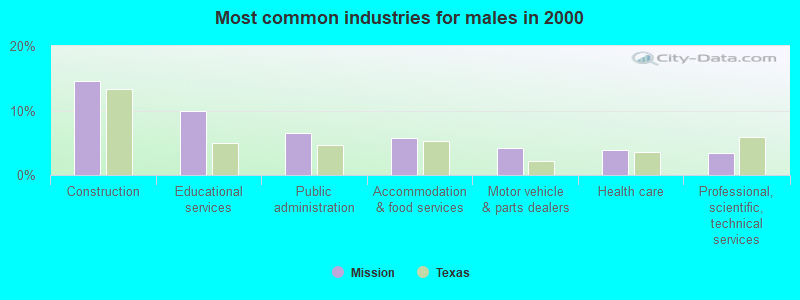
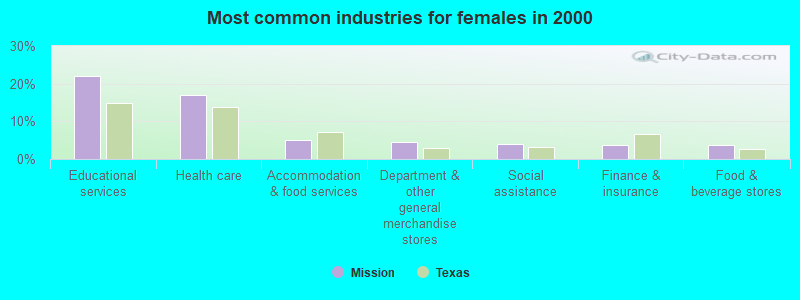
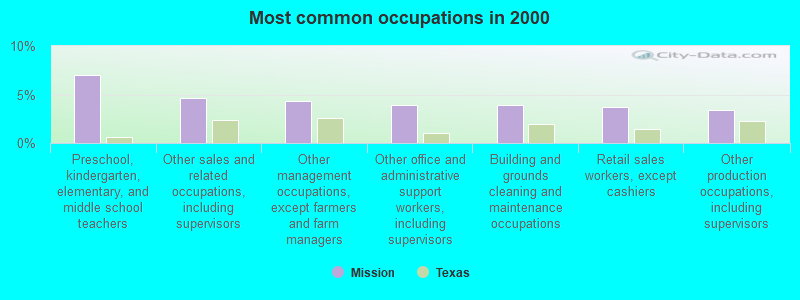
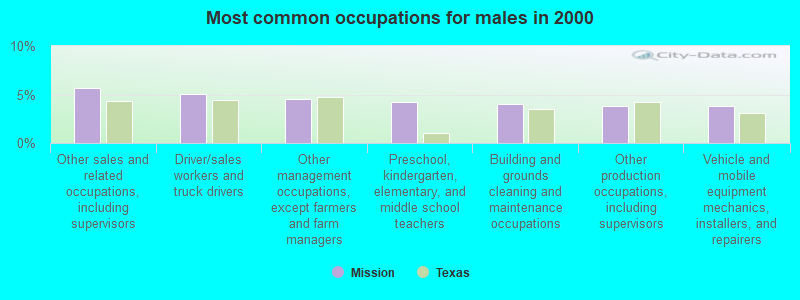
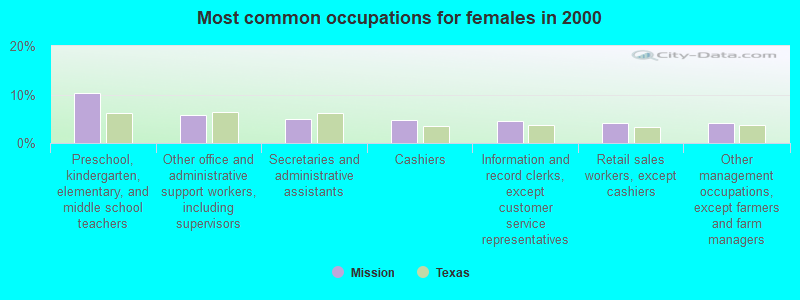


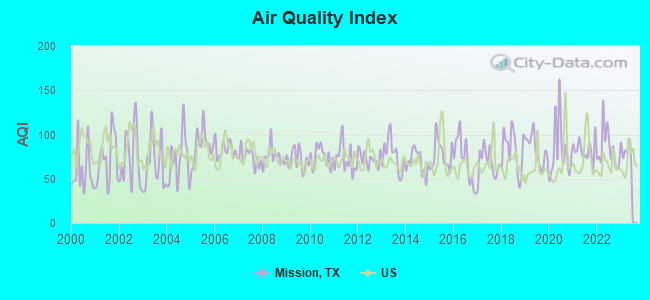
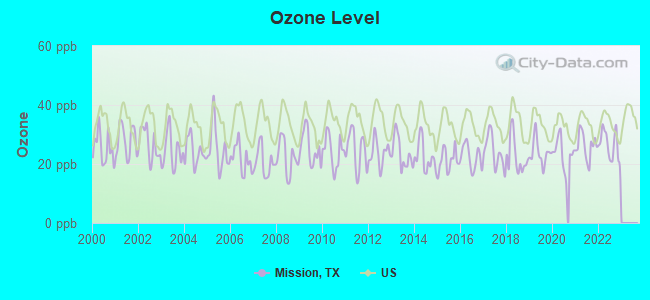
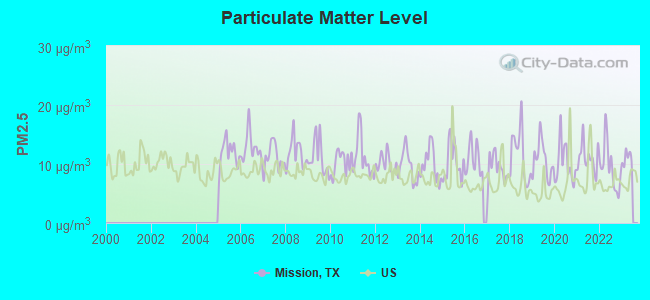

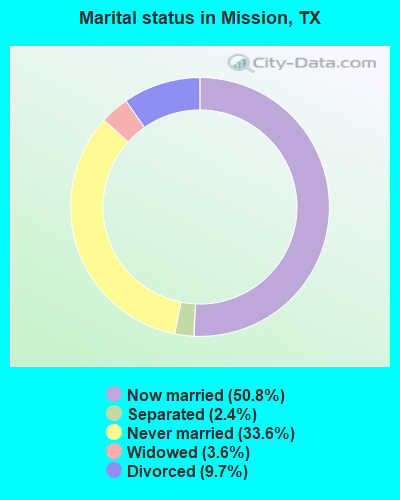
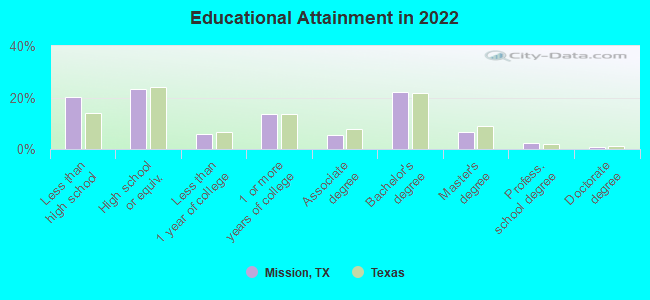
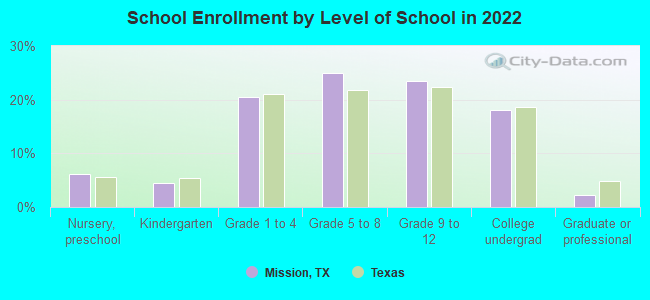
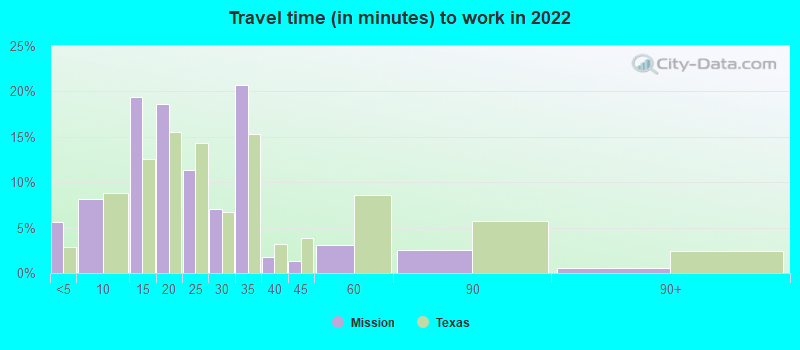
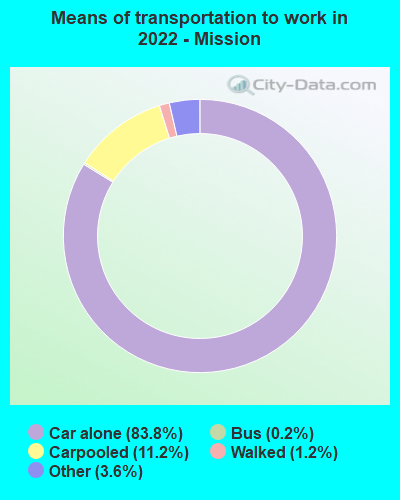
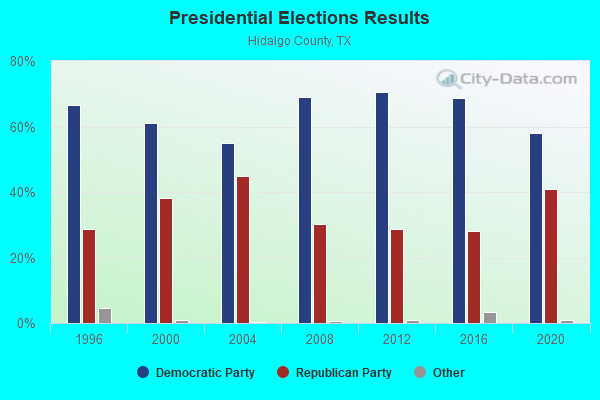
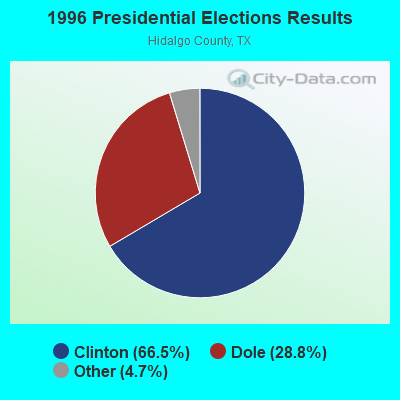
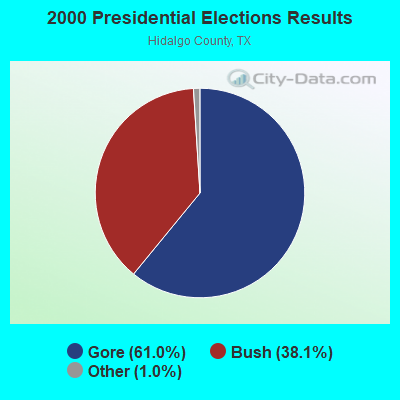
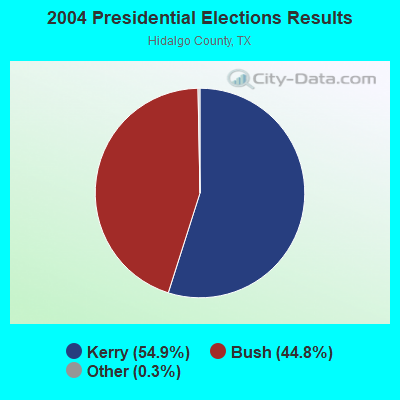
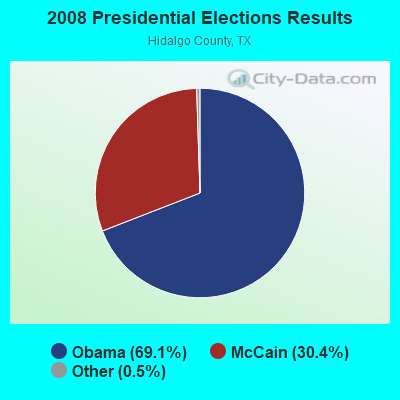
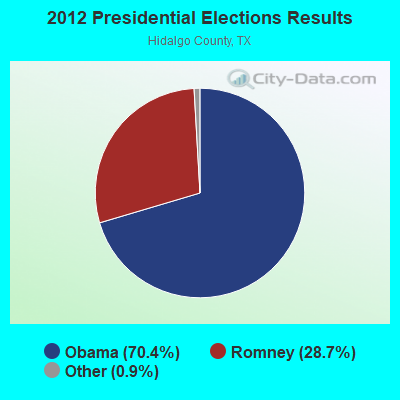
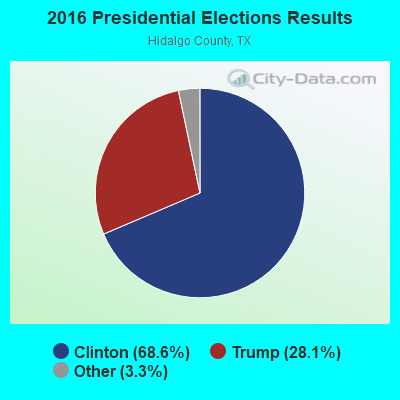
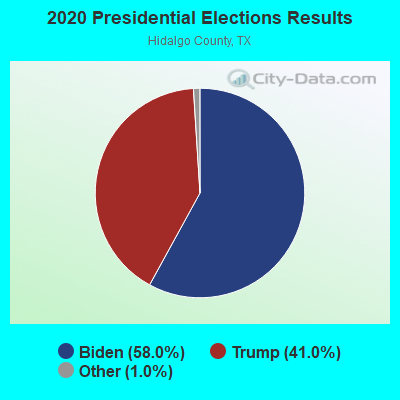
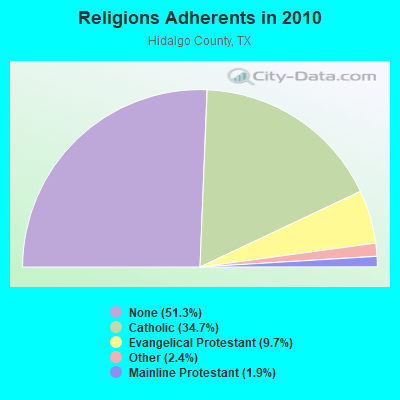
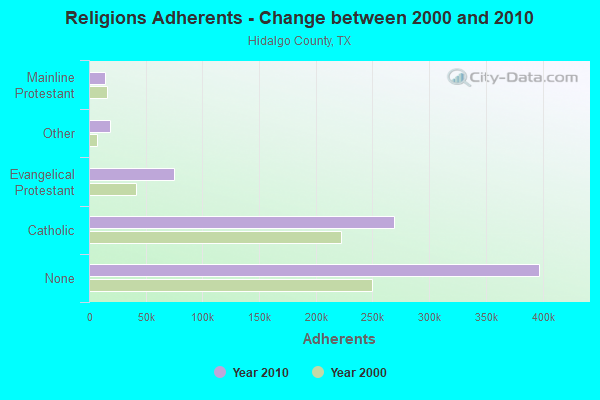
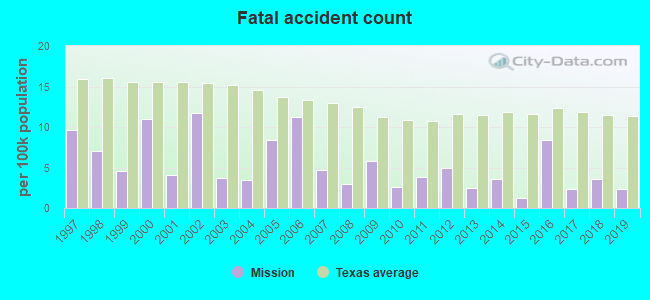
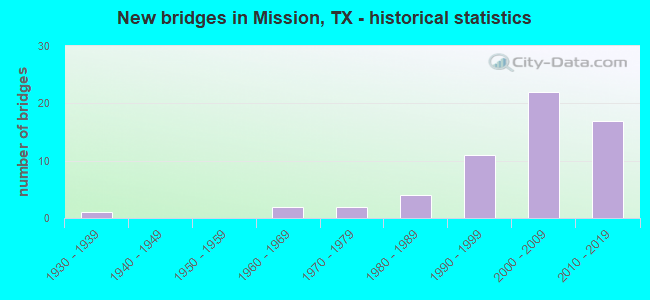
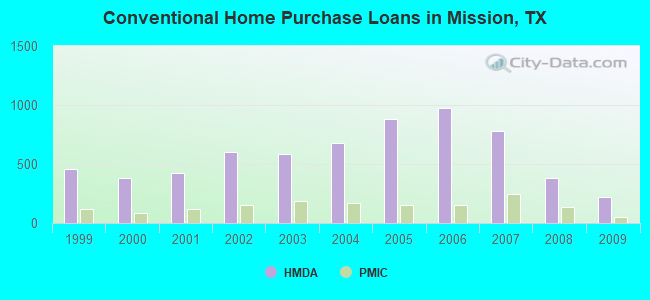
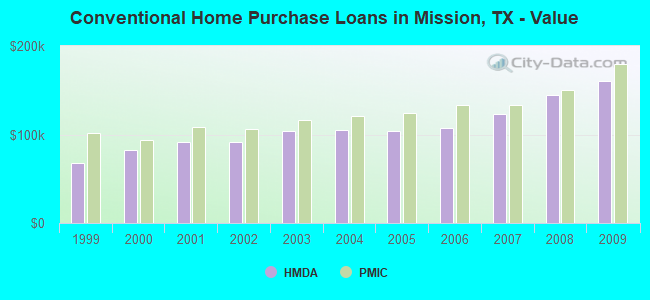
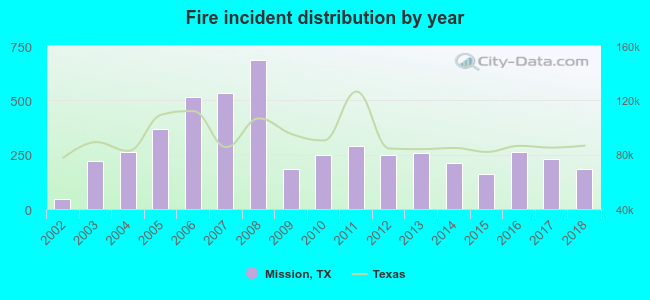 According to the data from the years 2002 - 2018 the average number of fire incidents per year is 288. The highest number of reported fires - 684 took place in 2008, and the least - 47 in 2002. The data has a growing trend.
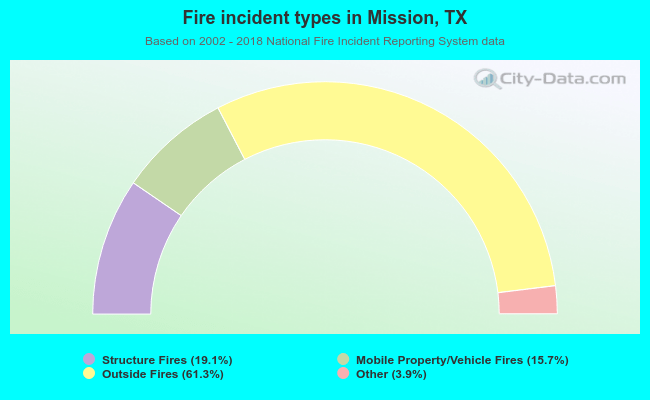 When looking into fire subcategories, the most incidents belonged to: Outside Fires (61.3%), and Structure Fires (19.1%).