Races in Middleton, Wisconsin (WI) Detailed Stats
Data:
Races - White alone (%)
Races - White alone (% change since 2000)
Races - Black alone (%)
Races - Black alone (% change since 2000)
Races - American Indian alone (%)
Races - American Indian alone (% change since 2000)
Races - Asian alone (%)
Races - Asian alone (% change since 2000)
Races - Hispanic (%)
Races - Hispanic (% change since 2000)
Races - Native Hawaiian and Other Pacific Islander alone (%)
Races - Native Hawaiian and Other Pacific Islander alone (% change since 2000)
Races - Two or more races(%)
Races - Two or more races(% change since 2000)
Races - Other race alone (%)
Races - Other race alone (% change since 2000)
Racial diversity
Place of birth - Born in state of residence (%)
Place of birth - Born in state of residence (%) - White
Place of birth - Born in state of residence (%) - Black or African American
Place of birth - Born in state of residence (%) - Asian
Place of birth - Born in state of residence (%) - Hispanic or Latino
Place of birth - Born in state of residence (%) - American Indian and Alaska Native
Place of birth - Born in state of residence (%) - Multirace
Place of birth - Born in state of residence (%) - Other Race
Place of birth - Born in other state (%)
Place of birth - Born in other state (%) - White
Place of birth - Born in other state (%) - Black or African American
Place of birth - Born in other state (%) - Asian
Place of birth - Born in other state (%) - Hispanic or Latino
Place of birth - Born in other state (%) - American Indian and Alaska Native
Place of birth - Born in other state (%) - Multirace
Place of birth - Born in other state (%) - Other Race
Place of birth - Native, outside of US (%)
Place of birth - Native, outside of US (%) - White
Place of birth - Native, outside of US (%) - Black or African American
Place of birth - Native, outside of US (%) - Asian
Place of birth - Native, outside of US (%) - Hispanic or Latino
Place of birth - Native, outside of US (%) - American Indian and Alaska Native
Place of birth - Native, outside of US (%) - Multirace
Place of birth - Native, outside of US (%) - Other Race
Place of birth - Foreign born (%)
Place of birth - Foreign born (%) - White
Place of birth - Foreign born (%) - Black or African American
Place of birth - Foreign born (%) - Asian
Place of birth - Foreign born (%) - Hispanic or Latino
Place of birth - Foreign born (%) - American Indian and Alaska Native
Place of birth - Foreign born (%) - Multirace
Place of birth - Foreign born (%) - Other Race
Residents speaking English at home (%)
Residents speaking English at home - Born in the United States (%)
Residents speaking English at home - Native, born elsewhere (%)
Residents speaking English at home - Foreign born (%)
Residents speaking Spanish at home (%)
Residents speaking Spanish at home - Born in the United States (%)
Residents speaking Spanish at home - Native, born elsewhere (%)
Residents speaking Spanish at home - Foreign born (%)
Residents speaking other language at home (%)
Residents speaking other language at home - Born in the United States (%)
Residents speaking other language at home - Native, born elsewhere (%)
Residents speaking other language at home - Foreign born (%)
Marital status - Never married (%)
Marital status - Now married (%)
Marital status - Separated (%)
Marital status - Widowed (%)
Marital status - Divorced (%)
Ancestries Reported - Arab (%)
Ancestries Reported - Czech (%)
Ancestries Reported - Danish (%)
Ancestries Reported - Dutch (%)
Ancestries Reported - English (%)
Ancestries Reported - French (%)
Ancestries Reported - French Canadian (%)
Ancestries Reported - German (%)
Ancestries Reported - Greek (%)
Ancestries Reported - Hungarian (%)
Ancestries Reported - Irish (%)
Ancestries Reported - Italian (%)
Ancestries Reported - Lithuanian (%)
Ancestries Reported - Norwegian (%)
Ancestries Reported - Polish (%)
Ancestries Reported - Portuguese (%)
Ancestries Reported - Russian (%)
Ancestries Reported - Scotch-Irish (%)
Ancestries Reported - Scottish (%)
Ancestries Reported - Slovak (%)
Ancestries Reported - Subsaharan African (%)
Ancestries Reported - Swedish (%)
Ancestries Reported - Swiss (%)
Ancestries Reported - Ukrainian (%)
Ancestries Reported - United States (%)
Ancestries Reported - Welsh (%)
Ancestries Reported - West Indian (%)
Ancestries Reported - Other (%)
Geographical mobility - Same house 1 year ago (%)
Geographical mobility - Same house 1 year ago (%) - White
Geographical mobility - Same house 1 year ago (%) - Black or African American
Geographical mobility - Same house 1 year ago (%) - Asian
Geographical mobility - Same house 1 year ago (%) - Hispanic or Latino
Geographical mobility - Same house 1 year ago (%) - American Indian and Alaska Native
Geographical mobility - Same house 1 year ago (%) - Multirace
Geographical mobility - Same house 1 year ago (%) - Other Race
Geographical mobility - Moved within same county (%)
Geographical mobility - Moved within same county (%) - White
Geographical mobility - Moved within same county (%) - Black or African American
Geographical mobility - Moved within same county (%) - Asian
Geographical mobility - Moved within same county (%) - Hispanic or Latino
Geographical mobility - Moved within same county (%) - American Indian and Alaska Native
Geographical mobility - Moved within same county (%) - Multirace
Geographical mobility - Moved within same county (%) - Other Race
Geographical mobility - Moved from different county within same state (%)
Geographical mobility - Moved from different county within same state (%) - White
Geographical mobility - Moved from different county within same state (%) - Black or African American
Geographical mobility - Moved from different county within same state (%) - Asian
Geographical mobility - Moved from different county within same state (%) - Hispanic or Latino
Geographical mobility - Moved from different county within same state (%) - American Indian and Alaska Native
Geographical mobility - Moved from different county within same state (%) - Multirace
Geographical mobility - Moved from different county within same state (%) - Other Race
Geographical mobility - Moved from different state (%)
Geographical mobility - Moved from different state (%) - White
Geographical mobility - Moved from different state (%) - Black or African American
Geographical mobility - Moved from different state (%) - Asian
Geographical mobility - Moved from different state (%) - Hispanic or Latino
Geographical mobility - Moved from different state (%) - American Indian and Alaska Native
Geographical mobility - Moved from different state (%) - Multirace
Geographical mobility - Moved from different state (%) - Other Race
Geographical mobility - Moved from abroad (%)
Geographical mobility - Moved from abroad (%) - White
Geographical mobility - Moved from abroad (%) - Black or African American
Geographical mobility - Moved from abroad (%) - Asian
Geographical mobility - Moved from abroad (%) - Hispanic or Latino
Geographical mobility - Moved from abroad (%) - American Indian and Alaska Native
Geographical mobility - Moved from abroad (%) - Multirace
Geographical mobility - Moved from abroad (%) - Other Race
Place of birth for the foreign-born population - Ireland (%)
Place of birth for the foreign-born population - Denmark (%)
Place of birth for the foreign-born population - Norway (%)
Place of birth for the foreign-born population - Sweden (%)
Place of birth for the foreign-born population - United Kingdom (%)
Place of birth for the foreign-born population - England (%)
Place of birth for the foreign-born population - Scotland (%)
Place of birth for the foreign-born population - Other Northern Europe (%)
Place of birth for the foreign-born population - Austria (%)
Place of birth for the foreign-born population - Belgium (%)
Place of birth for the foreign-born population - France (%)
Place of birth for the foreign-born population - Germany (%)
Place of birth for the foreign-born population - Netherlands (%)
Place of birth for the foreign-born population - Switzerland (%)
Place of birth for the foreign-born population - Other Western Europe (%)
Place of birth for the foreign-born population - Greece (%)
Place of birth for the foreign-born population - Italy (%)
Place of birth for the foreign-born population - Portugal (%)
Place of birth for the foreign-born population - Spain (%)
Place of birth for the foreign-born population - Other Southern Europe (%)
Place of birth for the foreign-born population - Albania (%)
Place of birth for the foreign-born population - Belarus (%)
Place of birth for the foreign-born population - Bosnia and Herzegovina (%)
Place of birth for the foreign-born population - Bulgaria (%)
Place of birth for the foreign-born population - Croatia (%)
Place of birth for the foreign-born population - Czechoslovakia (%)
Place of birth for the foreign-born population - Hungary (%)
Place of birth for the foreign-born population - Latvia (%)
Place of birth for the foreign-born population - Lithuania (%)
Place of birth for the foreign-born population - North Macedonia (Macedonia) (%)
Place of birth for the foreign-born population - Moldova (%)
Place of birth for the foreign-born population - Poland (%)
Place of birth for the foreign-born population - Romania (%)
Place of birth for the foreign-born population - Russia (%)
Place of birth for the foreign-born population - Serbia (%)
Place of birth for the foreign-born population - Ukraine (%)
Place of birth for the foreign-born population - Other Eastern Europe (%)
Place of birth for the foreign-born population - China (%)
Place of birth for the foreign-born population - Hong Kong (%)
Place of birth for the foreign-born population - Taiwan (%)
Place of birth for the foreign-born population - Japan (%)
Place of birth for the foreign-born population - Korea (%)
Place of birth for the foreign-born population - Other Eastern Asia (%)
Place of birth for the foreign-born population - Afghanistan (%)
Place of birth for the foreign-born population - Bangladesh (%)
Place of birth for the foreign-born population - India (%)
Place of birth for the foreign-born population - Iran (%)
Place of birth for the foreign-born population - Kazakhstan (%)
Place of birth for the foreign-born population - Nepal (%)
Place of birth for the foreign-born population - Pakistan (%)
Place of birth for the foreign-born population - Sri Lanka (%)
Place of birth for the foreign-born population - Uzbekistan (%)
Place of birth for the foreign-born population - Other South Central Asia (%)
Place of birth for the foreign-born population - Burma (%)
Place of birth for the foreign-born population - Cambodia (%)
Place of birth for the foreign-born population - Indonesia (%)
Place of birth for the foreign-born population - Laos (%)
Place of birth for the foreign-born population - Malaysia (%)
Place of birth for the foreign-born population - Philippines (%)
Place of birth for the foreign-born population - Singapore (%)
Place of birth for the foreign-born population - Thailand (%)
Place of birth for the foreign-born population - Vietnam (%)
Place of birth for the foreign-born population - Other South Eastern Asia (%)
Place of birth for the foreign-born population - Armenia (%)
Place of birth for the foreign-born population - Iraq (%)
Place of birth for the foreign-born population - Israel (%)
Place of birth for the foreign-born population - Jordan (%)
Place of birth for the foreign-born population - Kuwait (%)
Place of birth for the foreign-born population - Lebanon (%)
Place of birth for the foreign-born population - Saudi Arabia (%)
Place of birth for the foreign-born population - Syria (%)
Place of birth for the foreign-born population - Turkey (%)
Place of birth for the foreign-born population - Yemen (%)
Place of birth for the foreign-born population - Other Western Asia (%)
Place of birth for the foreign-born population - Eritrea (%)
Place of birth for the foreign-born population - Ethiopia (%)
Place of birth for the foreign-born population - Kenya (%)
Place of birth for the foreign-born population - Somalia (%)
Place of birth for the foreign-born population - Uganda (%)
Place of birth for the foreign-born population - Zimbabwe (%)
Place of birth for the foreign-born population - Other Eastern Africa (%)
Place of birth for the foreign-born population - Cameroon (%)
Place of birth for the foreign-born population - Congo (%)
Place of birth for the foreign-born population - Democratic Republic of Congo (Zaire) (%)
Place of birth for the foreign-born population - Other Middle Africa (%)
Place of birth for the foreign-born population - Egypt (%)
Place of birth for the foreign-born population - Morocco (%)
Place of birth for the foreign-born population - Sudan (%)
Place of birth for the foreign-born population - Other Northern Africa (%)
Place of birth for the foreign-born population - South Africa (%)
Place of birth for the foreign-born population - Other Southern Africa (%)
Place of birth for the foreign-born population - Cabo Verde (%)
Place of birth for the foreign-born population - Ghana (%)
Place of birth for the foreign-born population - Liberia (%)
Place of birth for the foreign-born population - Nigeria (%)
Place of birth for the foreign-born population - Senegal (%)
Place of birth for the foreign-born population - Sierra Leone (%)
Place of birth for the foreign-born population - Other Western Africa (%)
Place of birth for the foreign-born population - Australia (%)
Place of birth for the foreign-born population - New Zealand (%)
Place of birth for the foreign-born population - Fiji (%)
Place of birth for the foreign-born population - Micronesia (%)
Place of birth for the foreign-born population - Bahamas (%)
Place of birth for the foreign-born population - Barbados (%)
Place of birth for the foreign-born population - Cuba (%)
Place of birth for the foreign-born population - Dominica (%)
Place of birth for the foreign-born population - Dominican Republic (%)
Place of birth for the foreign-born population - Grenada (%)
Place of birth for the foreign-born population - Haiti (%)
Place of birth for the foreign-born population - Jamaica (%)
Place of birth for the foreign-born population - St. Vincent and the Grenadines (%)
Place of birth for the foreign-born population - Trinidad and Tobago (%)
Place of birth for the foreign-born population - West Indies (%)
Place of birth for the foreign-born population - Other Caribbean (%)
Place of birth for the foreign-born population - Belize (%)
Place of birth for the foreign-born population - Costa Rica (%)
Place of birth for the foreign-born population - El Salvador (%)
Place of birth for the foreign-born population - Guatemala (%)
Place of birth for the foreign-born population - Honduras (%)
Place of birth for the foreign-born population - Mexico (%)
Place of birth for the foreign-born population - Nicaragua (%)
Place of birth for the foreign-born population - Panama (%)
Place of birth for the foreign-born population - Other Central America (%)
Place of birth for the foreign-born population - Argentina (%)
Place of birth for the foreign-born population - Bolivia (%)
Place of birth for the foreign-born population - Brazil (%)
Place of birth for the foreign-born population - Chile (%)
Place of birth for the foreign-born population - Colombia (%)
Place of birth for the foreign-born population - Ecuador (%)
Place of birth for the foreign-born population - Guyana (%)
Place of birth for the foreign-born population - Peru (%)
Place of birth for the foreign-born population - Uruguay (%)
Place of birth for the foreign-born population - Venezuela (%)
Place of birth for the foreign-born population - Other South America (%)
Place of birth for the foreign-born population - Canada (%)
Place of birth for the foreign-born population - Other Northern America (%)
Place of birth for the foreign-born population - Other (%)
Latest news about races in Middleton, WI collected exclusively by city-data.com from local newspapers, TV, and radio stations
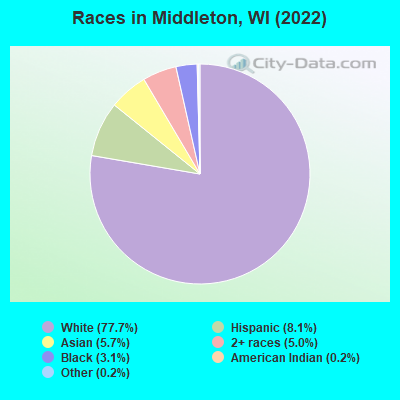
According to 2022 data, the most numerous races in Middleton, WI are White alone (17,240 residents), Hispanic (1,794 residents), and Black alone (690 residents). 88.5% of Middleton residents speak English at home. 7.3% of Middleton, WI residents are foreign-born (2.9% born in Asia, 2.7% born in Latin America, 1.5% born in Europe), which is 31.4% greater than the foreign-born rate of 5.0% across the entire state of Wisconsin.
Race distribution in Middleton
2000 2022
4,681,630 87.3% White alone 300,245 5.6% Black alone 192,921 3.6% Hispanic 87,995 1.6% Asian alone 51,921 1.0% Two or more races 43,980 0.8% American Indian alone 3,637 0.07% Other race alone 1,346 0.03% Native Hawaiian and Other
4,654,031 79.0% White alone 447,022 7.6% Hispanic 345,678 5.9% Black alone 217,532 3.7% Two or more races 172,242 2.9% Asian alone 33,762 0.6% American Indian alone 19,680 0.3% Other race alone 2,592 0.04% Native Hawaiian and Other
Income and house value in Middleton Median household income in 2022 $89,747 White non-Hispanic householders$108,594 Asian householders$104,889 Some other race householders$83,317 Hispanic or Latino race householdersMedian 2022 house value $489,007 White Non-Hispanic householders$627,647 Black or African American householders$453,301 American Indian or Alaska Native householders $720,539 Asian householders$523,039 Some other race householdersover $1,000,000 Two or more races householders$514,392 Hispanic or Latino householders
Median age by race in Middleton
42.0 Median age for White residents39.5 45.7 27.2 Median age for Black or African American residents25.0 28.6 41.0 Median age for American Indian / Alaska Native residents41.0 23.0 33.6 Median age for Asian residents37.1 31.4 -825,688,072.6 Median age for Native Hawaiian / Pacific Islander residents-862,745,097.2 -732,444,443.7 30.8 Median age for Other race residents38.5 21.8 28.1 Median age for Two or more races residents20.9 32.9 42.2 Median age for White alone residents39.7 45.4 32.7 Median age for Hispanic or Latino residents32.6 26.1
Owner/renter occupied households by race in Middleton
House owners and renters - White residents 4,478 49.5% Owner occupied4,560 50.5% Renter occupiedHouse owners and renters - Black or African American residents 66 20.4% Owner occupied257 79.6% Renter occupiedHouse owners and renters - American Indian / Alaska Native residents 19 51.3% Owner occupied18 48.7% Renter occupiedHouse owners and renters - Asian residents 289 53.5% Owner occupied252 46.5% Renter occupiedHouse owners and renters - Other race residents 61 25.8% Owner occupied174 74.2% Renter occupiedHouse owners and renters - Two or more races residents 219 41.4% Owner occupied309 58.6% Renter occupiedHouse owners and renters - White alone residents 4,352 48.5% Owner occupied4,624 51.5% Renter occupiedHouse owners and renters - Hispanic or Latino residents 300 47.4% Owner occupied333 52.6% Renter occupied
Language usage in Middleton
English speakers - Total 88.5% of residents of Middleton speak English at home.
5.2% of residents speak Spanish at home 901 82.9% Speak English very well186 17.1% Speak English less than very well6.7% of residents speak other language at home 1,127 80.3% Speak English very well276 19.7% Speak English less than very well
English speakers - Born in the United States 92.3% of residents of Middleton speak English at home.
3.9% of residents speak Spanish at home 270 88.2% Speak English very well36 11.8% Speak English less than very well3.7% of residents speak other language at home 273 94.8% Speak English very well15 5.2% Speak English less than very well
English speakers - Native, born elsewhere 63.5% of residents of Middleton speak English at home.
32.1% of residents speak Spanish at home 89 88.1% Speak English very well12 11.9% Speak English less than very well9.5% of residents speak other language at home 30 100.0% Speak English very well
English speakers - Foreign-born 23.5% of residents of Middleton speak English at home.
28.1% of residents speak Spanish at home 295 66.6% Speak English very well148 33.4% Speak English less than very well50.9% of residents speak other language at home 619 77.2% Speak English very well183 22.8% Speak English less than very well
White (Caucasian) - Speak only English Native:
97.5% (16,138)Foreign-born:
49.7% (152)
White (Caucasian) - Speak another language Native:
2.4% (405)Foreign-born:
50.3% (154)
Black or African American - Speak only English Native:
99.8% (510)Foreign-born:
50.2% (20)
American Indian / Alaska Native - Speak only English Native:
71.7% (56)Foreign-born:
95.6% (25)
Asian - Speak only English Native:
17.6% (82)Foreign-born:
12.0% (80)
Asian - Speak another language Native:
69.5% (325)Foreign-born:
89.9% (597)
Other race - Speak only English Native:
51.1% (224)Foreign-born:
13.6% (29)
Other race - Speak another language Native:
48.5% (213)Foreign-born:
86.5% (188)
Two or more races - Speak only English Native:
84.9% (1,254)Foreign-born:
27.1% (64)
Two or more races - Speak another language Native:
14.3% (211)Foreign-born:
71.0% (168)
White alone - Speak only English Native:
97.5% (15,913)Foreign-born:
46.6% (166)
White alone - Speak another language Native:
2.5% (404)Foreign-born:
52.2% (186)
Hispanic or Latino - Speak only English Native:
63.1% (713)Foreign-born:
24.9% (130)
Hispanic or Latino - Speak another language Native:
35.7% (404)Foreign-born:
74.4% (388)
Foreign-born residents in Middleton 1,617 residents are foreign born (2.9% Asia , 2.7% Latin America , 1.5% Europe ).
This city:
7.3%Wisconsin:
5.0%
Marital status for residents in Middleton Marital status - White (Caucasian) population 15 years and over
Males 39.0% Never married52.2% Now married0.5% Separated0.7% Widowed7.6% DivorcedFemales 29.6% Never married48.6% Now married2.3% Separated7.0% Widowed12.5% DivorcedWomen who gave birth in the past 12 months Now married:
94.3% (210)Unmarried:
5.7% (13)
Women who did not give birth in the past 12 months Now married:
35.6% (1,406)Unmarried:
64.4% (2,541)
Marital status - Black or African American population 15 years and over
Males 38.4% Never married34.9% Now married9.8% Separated0.0% Widowed16.9% DivorcedFemales 58.1% Never married41.9% Now married0.0% Separated0.0% Widowed0.0% DivorcedWomen who did not give birth in the past 12 months Now married:
44.0% (107)Unmarried:
56.0% (136)
Marital status - American Indian / Alaska Native population 15 years and over
Males 15.2% Never married32.6% Now married0.0% Separated0.0% Widowed52.2% DivorcedFemales 72.1% Never married27.9% Now married0.0% Separated0.0% Widowed0.0% DivorcedWomen who did not give birth in the past 12 months Now married:
0.0% (0)Unmarried:
100.0% (29)
Marital status - Asian population 15 years and over
Males 12.7% Never married76.7% Now married0.0% Separated0.0% Widowed10.6% DivorcedFemales 37.4% Never married52.0% Now married0.0% Separated8.5% Widowed2.1% DivorcedWomen who gave birth in the past 12 months Now married:
100.0% (67)Unmarried:
0.0% (0)
Women who did not give birth in the past 12 months Now married:
44.7% (170)Unmarried:
55.3% (211)
Marital status - Other race population 15 years and over
Males 23.4% Never married39.0% Now married0.0% Separated0.0% Widowed37.5% DivorcedFemales 80.3% Never married19.7% Now married0.0% Separated0.0% Widowed0.0% DivorcedWomen who did not give birth in the past 12 months Now married:
19.7% (42)Unmarried:
80.3% (170)
Marital status - Two or more races population 15 years and over
Males 48.1% Never married51.9% Now married0.0% Separated0.0% Widowed0.0% DivorcedFemales 32.6% Never married53.8% Now married0.0% Separated0.3% Widowed13.3% DivorcedWomen who gave birth in the past 12 months Now married:
100.0% (79)Unmarried:
0.0% (0)
Women who did not give birth in the past 12 months Now married:
53.8% (374)Unmarried:
46.2% (322)
Marital status - White alone, not Hispanic / Latino population 15 years and over
Males 39.5% Never married51.8% Now married0.5% Separated0.7% Widowed7.4% DivorcedFemales 29.8% Never married48.3% Now married2.4% Separated7.0% Widowed12.5% DivorcedWomen who gave birth in the past 12 months Now married:
94.1% (209)Unmarried:
5.9% (13)
Women who did not give birth in the past 12 months Now married:
35.1% (1,411)Unmarried:
64.9% (2,604)
Marital status - Hispanic or Latino population 15 years and over
Males 25.8% Never married49.9% Now married3.4% Separated0.0% Widowed21.0% DivorcedFemales 39.3% Never married44.7% Now married0.0% Separated2.1% Widowed13.9% DivorcedWomen who gave birth in the past 12 months Now married:
100.0% (14)Unmarried:
0.0% (0)
Women who did not give birth in the past 12 months Now married:
47.2% (192)Unmarried:
52.8% (215)
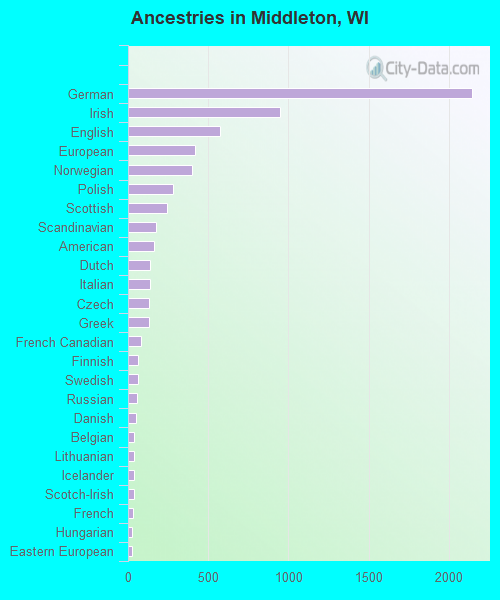
Ancestries in Middleton
2,144 23.1% German949 10.2% Irish572 6.2% English418 4.5% European402 4.3% Norwegian282 3.0% Polish241 2.6% Scottish173 1.9% Scandinavian165 1.8% American137 1.5% Dutch137 1.5% Italian132 1.4% Czech129 1.4% Greek83 0.9% French Canadian62 0.7% Finnish61 0.7% Swedish58 0.6% Russian49 0.5% Danish40 0.4% Belgian39 0.4% Lithuanian37 0.4% Icelander35 0.4% Scotch-Irish31 0.3% French28 0.3% Hungarian26 0.3% Eastern European19 0.2% South African15 0.2% Ethiopian13 0.1% Swiss12 0.1% Canadian10 0.1% Romanian9 0.10% Bulgarian6 0.06% Northern European
Geographical mobility in Middleton Same house 1 year ago 14,365 82.9% White (Caucasian)649 90.1% Black or African American81 82.0% American Indian / Alaska Native887 71.9% Asian572 88.0% Other race1,177 60.8% Two or more races14,315 83.4% White alone, not Hispanic / Latino1,076 61.8% Hispanic or LatinoMoved within same county 1,467 8.5% White / Caucasian43 6.0% Black or African American214 17.3% Asian2 0.3% Other race289 14.9% Two or more races1,349 7.9% White alone, not Hispanic / Latino332 19.1% Hispanic or LatinoMoved within same state 440 2.5% White / Caucasian42 3.4% Asian38 2.0% Two or more races444 2.6% White alone, not Hispanic / LatinoMoved from different state 1,041 6.0% White / Caucasian12 1.7% Black or African American12 12.0% American Indian / Alaska Native40 3.2% Asian63 9.7% Other race572 29.5% Two or more races1,053 6.1% White alone, not Hispanic / Latino346 19.9% Hispanic or LatinoMoved from abroad 23 0.1% White23 1.9% Asian22 3.3% Other race26 0.2% White alone, not Hispanic / Latino18 1.1% Hispanic or Latino
Children Nativity (place of birth) in Middleton
Children under 6 years - Living with two parents Both parents native 644 100.0% NativeBoth parents foreign-born 241 100.0% NativeOne native, one foreign-born parent 146 100.0% NativeChildren under 6 years - Living with one parent Native parent 331 100.0% NativeForeign-born parent 9 100.0% NativeChildren 6 to 17 years - Living with two parents Both parents native 1,733 99.4% Native10 0.6% Foreign-bornBoth parents foreign-born 185 91.2% Native18 8.8% Foreign-bornOne native, one foreign-born parent 216 100.0% NativeChildren 6 to 17 years - Living with one parent Native parent 603 100.0% NativeForeign-born parent 154 45.5% Native184 54.5% Foreign-born
Grandparents responsible for own grandchildren in Middleton
Grandparents (30 to 59 years) White / Caucasian 27 100.0% Not responsible for grandchildrenAsian 18 100.0% Responsible for grandchildrenWhite alone, not Hispanic / Latino 30 100.0% Not responsible for grandchildren
Grandparents (60 years and over) White / Caucasian 5 100.0% Not responsible for grandchildrenAsian 31 100.0% Not responsible for grandchildrenWhite alone, not Hispanic / Latino 6 100.0% Not responsible for grandchildren