Comparing Anaheim and Norwalk in California, there are stark differences as well as stand-out similarities. Both cities offer a distinctive SoCal life, but with diverse offerings in terms of safety, weather, cost of living, education, job opportunities, and more. Anaheim is famous for Disneyland and Norwalk is known for its suburban feel and numerous parks. The comparison guides below equip movers and visitors regarding what they can expect in these two beautiful cities.
Distance between
Anaheim, CA and
Norwalk, CA : 12.1 miles
Anaheim's population is larger by 245%. Its population has grown by 17,926 people (5.5%) since 2000. The population of Norwalk has decreased by 2,925 people (2.8%) during that time.
Anaheim and Norwalk have different crime rates. Though Anaheim, being a major tourist destination, receives a higher number of visitors, it has managed to maintain a relatively lower crime rate than Norwalk. The violent crime rate is slightly higher in Norwalk relative to the national average, but it's still deemed safer than 19% of US cities. Anaheim, on the other hand, is safer than 21% of US cities.
City-data.com crime index counts serious crimes and violent crime more heavily. It adjusts for the number of visitors and daily workers commuting into cities. (higher means more crime, U.S. average = 301.1)
City-data.com crime index counts serious crimes and violent crime more heavily. It adjusts for the number of visitors and daily workers commuting into cities. (higher means more crime, U.S. average = 301.1)
Sex Offenders
According to our data, there are 366 registered sex offenders living in Anaheim and 146 registered sex offenders living in . The ratio of residents to sex offenders in Anaheim is 959 to 1; the ratio in Norwalk is 727 to 1. The number of registered sex offenders compared to the number of residents is a smaller in Anaheim than in Norwalk.
Cost of Living
Living in Anaheim is typically more costly than in Norwalk. This is due to several factors, including higher housing prices, and the influx of tourists to Anaheim, which can drive up the prices of goods and services. Nonetheless, the cost of living in both cities is higher than the national average, reflecting the generally high cost of living that characterises most of Southern California.
Income Tax
California has a progressive income tax, which means rates are dependent upon an individual's income. This applies to both Anaheim and Norwalk. The state's income tax rates range from 1% to 13.3%.
Property Tax
In both Anaheim and Norwalk, the average county property tax rate is 0.72% of the property's assessed value.
Sales Tax
Both Anaheim and Norwalk share the same sales tax rate. The California state sales tax rate is currently 7.25%, and the city sales tax rate is 0%, making a combined total of 7.25%.
Income
Type
Anaheim
Norwalk
Estimated median household income
$81,747
$79,850
Estimated per capita income
$32,827
$24,537
Cost of living index (U.S. average is 100)
88.5
138.1
If you make $50,000 in Anaheim, you will have to make $78,023 in Norwalk to maintain the same standard of living.
Geographical Conditions
Anaheim is about 15 miles inland from the Pacific Ocean and is characterized by flat, coastal plains. Norwalk, about 17 miles southeast of Downtown Los Angeles, is also primarily flat, with some gently rolling hills.
Overall, Norwalk and Anaheim have decent educational systems. Norwalk has a higher high school graduation rate than Anaheim, and the smaller population tends to allow for more individual attention to students. Anaheim, however, has a broader range of educational opportunities, including quality public, private, and charter schools, and is home to several renowned colleges and universities.
Anaheim's economy is significantly influenced by the presence of Disneyland Resort, making tourism one of its main industries. However, the manufacturing and technology sectors also play a large role. Norwalk, being more residential, offers job opportunities in the public sector, retail, and healthcare. The unemployment rate is lower in Anaheim compared to Norwalk.
Biggest Employers
In Anaheim, Disneyland Resort is the biggest employer, followed by companies like Kaiser Permanente and Northgate Gonzalez Markets. In Norwalk, the Los Angeles County Department of Public Social Services, Cerritos College, and Target are among the top employers.
There were 85 building permits issued in Anaheim in 2012 (44 more than in 2011) compared to 3 building permits issued in Norwalk in 2012.
In Anaheim (Orange County), 45.8% voted for Democrats and 52.0% for Republicans in 2012 Presidential Election. In Norwalk (Los Angeles County), 69.7% voted for Democrats and 27.8% for Republicans.
Elections
Type
Democrats
Republicans
Other
Year
Anaheim
Norwalk
Anaheim
Norwalk
Anaheim
Norwalk
2020
53.6%
71.0%
44.6%
26.9%
1.8%
2.1%
2016
50.9%
72.0%
42.4%
22.5%
6.7%
5.5%
2012
45.8%
69.7%
52.0%
27.8%
2.3%
2.4%
2008
47.8%
69.2%
50.3%
28.8%
1.9%
1.9%
2004
39.3%
63.3%
60.2%
35.7%
0.5%
1.0%
2000
40.4%
63.6%
55.9%
32.4%
3.7%
4.0%
1996
37.9%
59.3%
51.7%
31.0%
10.5%
9.7%
Breakdown of population affiliated with a religious congregation
Type
Adherents
Congregations
Religion
Anaheim
Norwalk
Anaheim
Norwalk
CATHOLIC CHURCH
26.5%
36.1%
4.4%
4.7%
SOUTHERN BAPTIST CONVENTION
2.3%
1.0%
8.8%
9.0%
MUSLIM ESTIMATE
0.8%
0.7%
1.3%
1.0%
LUTHERAN CHURCH
0.6%
0.2%
2.0%
1.6%
EPISCOPAL CHURCH
0.4%
0.4%
1.4%
1.4%
EVANGELICAL LUTHERAN CHURCH IN AMERICA
0.4%
0.2%
2.3%
1.9%
SEVENTH DAY ADVENTIST CHURCH
0.4%
0.5%
1.3%
2.4%
REFORMED CHURCH IN AMERICA
0.3%
0.1%
0.2%
0.2%
AMERICAN BAPTIST CHURCHES IN THE USA
0.2%
0.5%
1.7%
3.1%
Weather
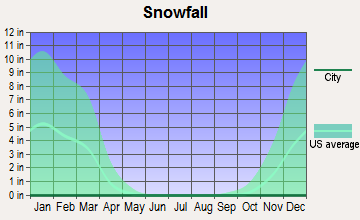
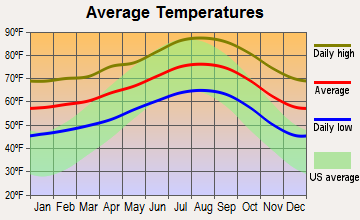
Both cities experience typical Southern California weather, marked by year-round moderate to warm temperatures. Summers can be hot, but the heat is tolerable. Both cities offer plenty of sunshine, with more than 280 sunny days per year, surpassing the national average. Winter is mild in both cities, offering excellent weather for outdoor enthusiasts.
Weather and climate
Type
Anaheim
Norwalk
Temperature - Average
64.9°F
66.3°F
Humidity - Average morning or afternoon humidity
69.6%
69.4%
Humidity - Differences between morning and afternoon humidity
25.9%
25.6%
Humidity - Maximum monthly morning or afternoon humidity
77.9%
77.6%
Humidity - Minimum monthly morning or afternoon humidity
52%
52%
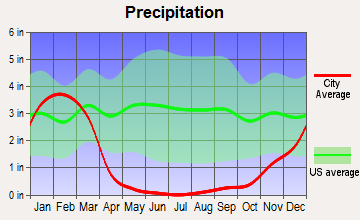
Precipitation - Yearly average
12 in
14.9 in
Snowfall - Yearly average
0 in
0 in
Clouds - Number of days clear of clouds
26.6%
26.7%
Sunshine amount - Average
78.4%
78.4%
Sunshine amount - Differences during a year
22%
22%
Sunshine amount - Maximum monthly
84.9%
85%
Sunshine amount - Minimum monthly
63%
63%
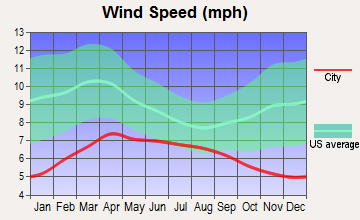
Wind speed - Average
5.7 mph
5.7 mph
Average climate in Anaheim, California
Average climate in Norwalk, California
Air pollution
Type
AQI
CO
NO2
OZONE
PB
PM10
PM25
SO2
Year
Anaheim
Norwalk
Anaheim
Norwalk
Anaheim
Norwalk
Anaheim
Norwalk
Anaheim
Norwalk
Anaheim
Norwalk
Anaheim
Norwalk
Anaheim
Norwalk
2018
139
140
0.36
0.38
13.7
14.3
26.8
25.5
0.007
0.008
27.5
27.1
12.1
13.4
0.7
0.6
2017
145
142
0.50
0.41
14.8
15.3
26.7
26.4
0.007
0.007
26.7
27.9
13.5
14.2
0.6
0.6
2016
132
128
0.57
0.43
14.5
15.1
26.3
25.8
0.007
0.007
24.1
25.3
12.9
12.7
0.3
0.6
2015
142
137
0.45
0.42
14.7
15.8
26.0
26.5
0.007
0.006
25.0
25.8
14.8
14.8
0.3
0.5
2014
138
138
0.40
0.40
15.0
15.9
26.7
25.8
0.008
0.007
26.7
27.8
16.2
15.7
0.5
0.7
2013
138
140
0.47
0.44
14.8
17.0
25.3
25.3
0.005
0.006
28.3
29.9
13.9
14.7
0.5
0.6
2012
142
144
0.46
0.45
14.5
17.1
25.0
24.8
0.005
0.005
27.0
28.9
14.7
15.1
0.2
0.5
2011
138
142
0.42
0.44
15.9
18.2
26.7
24.3
0.007
0.007
27.4
28.5
16.0
16.2
0.8
0.7
2010
130
128
0.44
0.50
16.7
18.5
25.8
22.8
0.009
0.013
23.5
25.5
14.9
14.1
0.6
0.6
2009
151
150
0.41
0.50
18.0
20.3
26.0
24.1
0.010
0.010
24.4
29.4
15.4
15.3
1.1
0.9
2008
156
152
0.38
0.51
20.3
22.9
26.7
22.9
0.010
0.012
30.2
31.0
18.9
18.3
1.1
0.9
2007
135
128
0.38
0.52
19.5
22.8
26.2
22.7
0.012
0.014
N/A
N/A
N/A
N/A
0.8
1.3
2006
128
125
0.43
0.58
19.1
23.7
26.3
23.7
0.008
0.009
N/A
N/A
N/A
N/A
1.3
1.6
2005
128
123
0.45
0.60
20.7
25.0
31.3
21.8
0.013
0.014
N/A
N/A
N/A
N/A
1.3
2.4
2004
134
132
0.53
0.64
19.9
26.5
37.1
24.1
0.015
0.016
N/A
N/A
N/A
N/A
1.6
2.2
2003
143
143
0.69
0.83
23.7
29.2
23.8
21.3
0.025
0.026
N/A
N/A
N/A
N/A
1.1
1.3
2002
134
137
0.77
0.87
24.1
30.1
21.8
20.3
0.019
0.021
N/A
N/A
N/A
N/A
2.1
2.4
2001
143
143
0.94
0.93
28.4
31.6
24.5
18.9
0.035
0.039
N/A
N/A
N/A
N/A
1.7
2.5
2000
152
149
0.80
0.94
29.4
33.4
23.0
18.4
0.030
0.031
N/A
N/A
N/A
N/A
1.9
1.7
Natural disasters
Type
Anaheim
Norwalk
Tornado activity compared to U.S. average
19.3%
18.8%
Earthquake activity compared to U.S. average
7,039.7%
7,030.2%
Natural disasters compared to U.S. average
32%
57%
Transportation
Both Anaheim and Norwalk have solid public transportation systems. In Anaheim, the Anaheim Resort Transportation (ART) system navigates the city's main areas, including Disneyland Resort. Norwalk Transit serves the transportation needs within the city and to surrounding areas.
Transport
Type
Anaheim
Norwalk
Amtrak stations
1
0
Amtrak stations nearby
3
3
FAA registered aircraft
136
16
FAA registered aircraft manufacturers and dealers
3
0
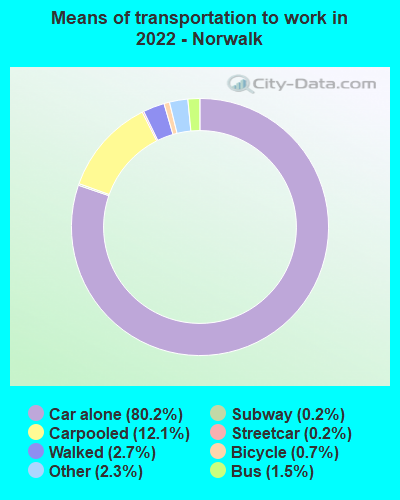
Means of transportation to work
Type
Anaheim
Norwalk
Bicycle
1%
0.6%
Bus
0.9%
1.6%
Carpooled
10.8%
10.2%
Car alone
83.4%
82.2%
Motorcycle
0.2%
0%
Railroad
0.2%
0.1%
Streetcar
0.1%
0.2%
Subway
0.3%
0.3%
Walked
1.6%
2.3%
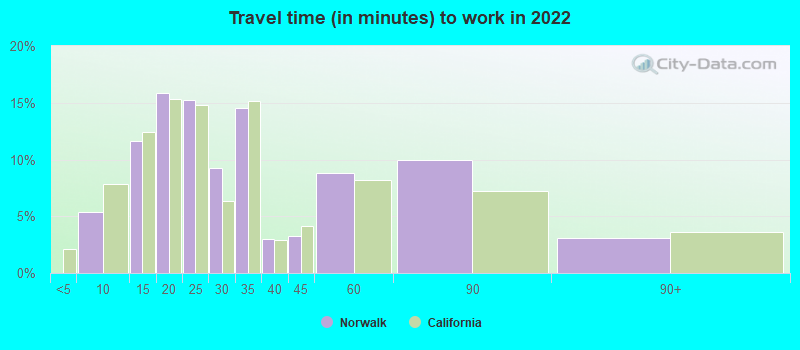
Average travel time to work
Type
Anaheim
Norwalk
Average
30.8 min
28.3 min
Other means
28.1 min
28.2 min
Public transportation
47.8 min
51.6 min
Private vehicle occupancy
Type
Anaheim
Norwalk
Average
1.2
1.2
Drove alone
85.3%
88.2%
In 2 person carpool
11.2%
7.7%
In 3 person carpool
1.8%
2.6%
In 4 person carpool
0.8%
0.8%
In 5-6 person carpool
0.9%
0.7%
How many people usually rode to work in the car, truck or van.
Real Estate
Housing prices are generally higher in Anaheim compared to Norwalk, driven up by its popularity as a tourist destination. Renting is also slightly more expensive in Anaheim. However, both cities offer a range of housing options, from single-family homes to apartments and condos.
Neighborhoods
Anaheim is known for its diverse neighborhoods, each offering something unique. From the bustling tourist district to calm residential areas, there's something for everyone. Norwalk offers a more traditional suburban feel, with quiet neighborhoods and family-oriented amenities.
Houses and residents
Type
Anaheim
Norwalk
Houses
110,319
26,860
Average household size (people)
3.4
3.8
Median year apartment built
1975
1969
Median year house/condo built
1970
1956
Length of stay in the house since moving in
14.8 years
16.6 years
Houses occupied
105,608 (95.7%)
26,506 (98.7%)
Houses occupied by owners
51,684 (48.9%)
18,333 (69.2%)
Houses occupied by renters
53,924 (51.1%)
8,173 (30.8%)
Median rent asked for vacant for-rent units
$2,111
$1,744
Median monthly housing costs
$1,910
$1,688
Median price asked for vacant for-sale houses and condos
$1,256,069
$425,780
Estimated median house or condo value
$688,400
$585,200
Median numbers of rooms
4.7
5.1
Median number of rooms in apartments
3.6
4.1
Median number of rooms in houses and condos
6.1
5.5
Median house price - detached houses
$859,592
$571,504
Median house price - in 3-to-4-unit structures
$546,946
$401,042
Median house price - in 5 or more unit structures
$553,561
$334,508
Median house price - mobile homes
$114,904
$97,897
Median house price - Townhouses or other attached units
$619,623
$478,204
Median house price - All housing units
$782,600
$554,110
Median house age
48
64
Renting percentage
51.5%
34.9%
Housing density (houses/condos per square mile)
2,254.1
2,773.8
House value disparities
20.2%
15.5%
Household income disparities
43.6%
40.5%
Median household income for houses/condes with a mortgage
$125,169
$104,247
Median household income for apartments without a mortgage
$86,779
$69,620
Housing units without a mortgage
374 (1%)
244 (1.9%)
Housing units with both a second mortgage and home equity loan
2,222 (6%)
692 (5.5%)
Housing units with a mortgage
36,875 (99%)
12,410 (98.1%)
Housing units with a home equity loan
0 (0%)
0 (0%)
Housing units with a second mortgage
2,794 (7.5%)
692 (5.5%)
House/condo owner moved in on average (years ago)
14
16
House/condo renter moved in on average (years ago)
4
6
Housing units lacking complete kitchen facilities
4.5%
1.5%
Housing units lacking complete plumbing facilities
0.1%
0.5%
Housing units in structures
Housing units in structures
Anaheim
Norwalk
One, detached
42.7%
75.8%
One, attached
8.3%
3.5%
Two
2.3%
0.5%
3 or 4
7.6%
3.1%
5 to 9
6.8%
3.0%
10 to 19
5.5%
1.1%
20 to 49
6.8%
4.8%
50 or more
17.2%
6.2%
Mobile homes
2.6%
2.1%
Boats, RVs, vans, etc.
0.1%
0.0%
Median real estate property taxes paid for housing units
Self-employed workers in own not incorporated business
11,077
2,563
State government workers
5,046
1,173
Unpaid family workers
65
0
Industries and Occupations
In Anaheim, the top industries are retail trade, accommodation and food services, and healthcare. In Norwalk, the major industries are retail trade, healthcare, and education. The average income per capita in Anaheim is slightly higher than it is in Norwalk.
Both cities have great healthcare facilities. Anaheim has several large hospitals like Kaiser Permanente Anaheim Medical Center, and CHOC Children's Hospital. Norwalk also has quality healthcare providers, including Coast Plaza Hospital and Los Angeles Community Hospital.
Health (county statistics)
Type
Anaheim
Norwalk
General health status score of residents in this county from 1 (poor) to 5 (excellent)
Infrastructure in both Anaheim and Norwalk is well-developed, with plenty of public and private facilities. Anaheim, being a well-known tourist attraction, may have an edge with more developed recreation and entertainment infrastructure. Norwalk, on the other hand, has a strong focus on its community infrastructure with its parks and recreation areas.
HMDA - Conventional home purchase loans - Applications denied
Year
Anaheim
Norwalk
1999
914
171
2000
679
190
2001
632
179
2002
735
227
2003
1,047
381
2004
1,456
532
2005
1,965
722
2006
1,999
805
2007
1,230
509
2008
599
159
2009
378
75
Culture and Food
Both cities reflect California's rich cultural diversity. Anaheim is home to the famous Little Arabia, a haven for Middle Eastern cuisine. The city also has a dynamic arts scene, with multiple galleries and theaters. In Norwalk, expect a mix of cultural influences with enticing Mexican and Asian cuisines, and several community arts programs and festivals.
Sports Teams
Anaheim is home to two major professional sports teams: the Anaheim Ducks of the National Hockey League and the Los Angeles Angels of Major League Baseball. Norwalk, being smaller, doesn't host any major professional sports teams, but its residents support regional teams from the broader Los Angeles area.

 Anaheim, CA
 Norwalk, CA