Atlanta, the capital of Georgia, is notable for its vibrant culture, nightlife, and diverse economic sectors. It's a bustling metropolitan city that attracts both young professionals and families. Roswell, a suburb to the north of Atlanta, offers a more peaceful and family-friendly environment. It's known for its high quality of life, lower crime rates, and prime school systems. Both cities offer a mix of urban and suburban living, with opportunities for entertainment, great weather, and a competitive job market.
Distance between
Atlanta, GA and
Roswell, GA : 19.3 miles
Atlanta's population is larger by 437%. Its population has grown by 79,987 people (19.2%) since 2000. The population of Roswell has grown by 13,196 people (16.6%) during that time.
Safety is a prime concern when relocating. In terms of crime rates, Roswell stands as the safer choice compared to Atlanta. With a population that's just over 90,000, Roswell maintains a small community atmosphere with relatively low crime statistics. Meanwhile, Atlanta, with its sprawling metro area definition, experiences higher crime rates due to its population size. However, safety varies significantly throughout Atlanta's different neighborhoods. Neighborhoods like Grant Park and Inman Park are family-friendly and have comparatively less crime.
City-data.com crime index counts serious crimes and violent crime more heavily. It adjusts for the number of visitors and daily workers commuting into cities. (higher means more crime, U.S. average = 301.1)
City-data.com crime index counts serious crimes and violent crime more heavily. It adjusts for the number of visitors and daily workers commuting into cities. (higher means more crime, U.S. average = 301.1)
Sex Offenders
According to our data, there are 1,961 registered sex offenders living in Atlanta and 43 registered sex offenders living in . The ratio of residents to sex offenders in Atlanta is 241 to 1; the ratio in Roswell is 2,244 to 1. The number of registered sex offenders compared to the number of residents is much larger in Atlanta than that in Roswell.
Cost of Living
Overall, the cost of living in Atlanta is higher than in Roswell when considering categories such as housing, transportation, and groceries. Due to its proximity to job centers and cultural hotspots, real estate in Atlanta can be pricier. However, compared to other major U.S. cities, Atlanta is quite affordable. In contrast, Roswell offers more affordable living costs, with housing being relatively cheaper.
Income Tax
For both Atlanta and Roswell, Georgia’s state income tax rate applies, which ranges from 1% to 5.75%, based on income level.
Property Tax
Property taxes in Georgia are relatively lower compared to other states. However, Roswell’s property taxes are slightly lower than Atlanta’s, reflecting the lower cost of homes.
Sales Tax
Both Atlanta and Roswell share Georgia’s state sales tax rate of 4%. However, when considering local city and county sales taxes, Atlanta has a combined rate of 8.9%, while Roswell's combined rate is 7.75%.
Income
Type
Atlanta
Roswell
Estimated median household income
$74,107
$104,825
Estimated per capita income
$55,051
$55,638
Cost of living index (U.S. average is 100)
104.3
102.6
If you make $50,000 in Roswell, you will have to make $50,828 in Atlanta to maintain the same standard of living.
Geographical Conditions
Geographically, Atlanta and Roswell both share the lush greenery of Georgia with plenty of parks and outdoor recreational areas. Atlanta's geographical highlights include the Chattahoochee River and Stone Mountain. In Roswell, the Chattahoochee Nature Center offers wildlife encounters and walking trails.
One of the reasons families gravitate towards Roswell is its education system. It boasts fantastic schooling options, from elementary through high school. In contrast, Atlanta's education options are diverse, with private, charter, and public schools options. It's also home to a host of distinguished universities and colleges like Georgia State University and the prestigious Georgia Tech.
Both cities host several locally-based Fortune 500 companies, providing ample job opportunities in sectors ranging from healthcare to finance. Atlanta is recognized for its strong job market and diverse economy. It's a major hub for film and TV production, earning it the nickname, Hollywood of the South. Roswell has a smaller, yet prosperous economy, with a greater emphasis on the retail sector and local businesses.
Biggest Employers
Atlanta is home to several Fortune 500 companies like Home Depot, UPS, and Delta Airlines. The city's major employers reflect the diversity of the economy from sectors like health care, education, government, and media production. In contrast, Roswell's biggest employers extend to businesses like Kimberly-Clark Corporation, the City of Roswell, and North Fulton Hospital.
There were 855 building permits issued in Atlanta in 2012 (628 more than in 2011) compared to 199 building permits issued in Roswell in 2012 (71 more than in 2011).
Weather
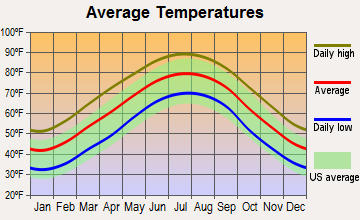
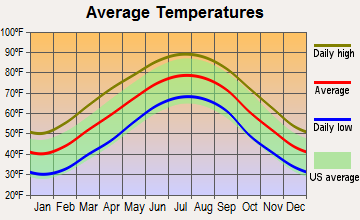
Both Atlanta and Roswell share similar subtropical climate patterns due to their geographical proximity. They experience mild winters and warm, muggy summers. Generally, the weather in Atlanta can be slightly hotter in summer due to the heat island effect (urbanized areas experience warmer weather). Both cities have access to natural retreats nearby, where residents can escape the city heat during hot summer months.
Weather and climate
Type
Atlanta
Roswell
Temperature - Average
61.7°F
60.3°F
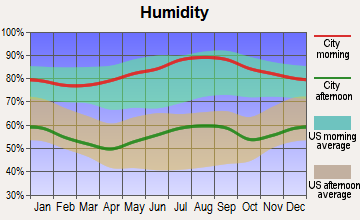
Humidity - Average morning or afternoon humidity
73.9%
74.1%
Humidity - Differences between morning and afternoon humidity
38%
38.4%
Humidity - Maximum monthly morning or afternoon humidity
87%
87.4%
Humidity - Minimum monthly morning or afternoon humidity
49%
49%
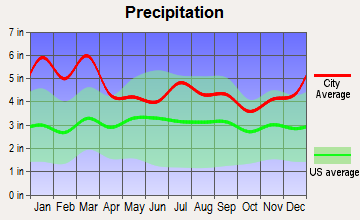
Precipitation - Yearly average
51.4 in
55.1 in
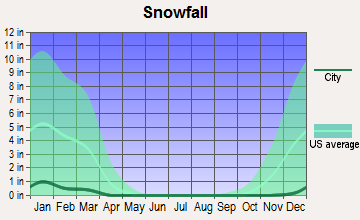
Snowfall - Yearly average
4 in
4.1 in
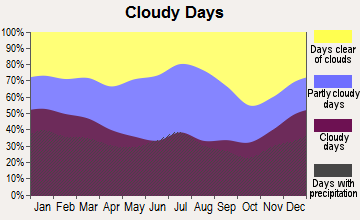
Clouds - Number of days clear of clouds
18.3%
18.4%
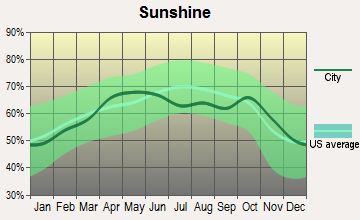
Sunshine amount - Average
65.6%
65.5%
Sunshine amount - Differences during a year
17%
17%
Sunshine amount - Maximum monthly
67%
66.9%
Sunshine amount - Minimum monthly
50%
49.9%
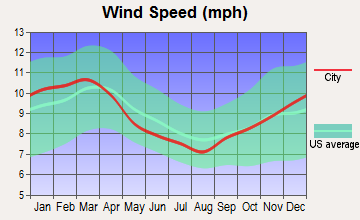
Wind speed - Average
9 mph
8.7 mph
Average climate in Atlanta, Georgia
Average climate in Roswell, Georgia
Air pollution
Type
AQI
CO
NO2
OZONE
PB
PM10
PM25
SO2
Year
Atlanta
Roswell
Atlanta
Roswell
Atlanta
Roswell
Atlanta
Roswell
Atlanta
Roswell
Atlanta
Roswell
Atlanta
Roswell
Atlanta
Roswell
2018
84
84
0.27
0.27
N/A
N/A
24.7
23.3
N/A
N/A
17.5
17.5
10.6
10.0
0.8
0.5
2017
87
85
0.31
0.31
N/A
N/A
24.7
23.3
N/A
N/A
17.5
17.5
11.3
9.3
1.2
0.7
2016
105
105
0.31
0.31
N/A
N/A
25.9
25.6
N/A
N/A
17.2
17.2
11.1
9.9
1.0
0.7
2015
91
91
0.31
0.31
N/A
N/A
23.9
22.9
N/A
N/A
17.6
17.6
10.2
9.4
0.9
0.6
2014
88
87
0.31
0.31
N/A
N/A
24.0
23.1
N/A
N/A
18.4
18.4
9.1
9.6
1.1
0.8
2013
88
87
0.30
0.30
N/A
N/A
23.7
23.3
N/A
N/A
18.0
18.0
8.7
9.2
1.0
0.7
2012
109
109
0.33
0.33
N/A
N/A
26.2
25.2
N/A
N/A
19.5
19.9
9.8
10.6
1.1
0.8
2011
98
98
0.33
0.33
N/A
N/A
27.5
26.4
N/A
N/A
21.2
21.1
12.0
12.5
1.7
1.3
2010
102
102
0.35
0.35
N/A
N/A
25.8
25.3
N/A
N/A
18.5
18.5
12.5
12.0
1.9
1.8
2009
96
96
N/A
N/A
N/A
N/A
25.2
24.4
N/A
N/A
18.5
18.5
13.8
11.4
1.7
1.7
2008
99
99
0.53
0.53
15.3
15.3
31.2
29.7
0.003
0.003
22.5
22.5
16.3
13.8
2.5
2.5
2007
124
123
0.45
0.45
17.0
17.0
33.1
32.2
0.003
0.003
29.4
29.4
18.1
16.5
2.7
2.7
2006
129
124
0.58
0.58
17.9
14.8
31.3
31.8
0.003
0.003
22.9
22.9
19.7
16.5
3.4
3.4
2005
123
117
0.55
0.55
17.2
15.5
29.0
28.4
0.005
0.005
25.5
25.5
15.8
14.8
3.2
3.2
2004
118
118
0.54
0.54
16.9
15.9
28.8
27.2
0.004
0.004
22.9
22.9
14.6
14.3
2.8
2.8
2003
112
109
0.56
0.56
16.4
16.2
26.7
25.5
0.004
0.004
22.2
22.2
15.4
15.1
3.0
3.0
2002
120
121
0.60
0.60
19.4
17.1
27.9
28.5
N/A
N/A
23.2
23.2
13.1
13.1
3.0
3.0
2001
117
115
0.69
0.69
23.3
19.3
27.2
27.8
N/A
N/A
27.0
27.0
N/A
N/A
3.1
3.1
2000
132
129
0.50
0.50
22.9
19.2
31.2
30.0
N/A
N/A
28.4
28.4
N/A
N/A
3.2
3.2
Natural disasters
Type
Atlanta
Roswell
Tornado activity compared to U.S. average
159.5%
159.6%
Earthquake activity compared to U.S. average
153.4%
158.7%
Natural disasters compared to U.S. average
15%
15%
Transportation
Atlanta's Marta system provides comprehensive bus and rapid rail options but traffic congestion is a common complaint. The Beltline, a former railway corridor, provides a pedestrian-friendly path connecting many Atlanta neighborhoods. Roswell, lacking its own public transit system, utilizes Marta's bus services and maintains well-kept roads for commuting.
Transport
Type
Atlanta
Roswell
Amtrak stations
1
0
Amtrak stations nearby
1
1
FAA registered aircraft
1
52
FAA registered aircraft manufacturers and dealers
28
2
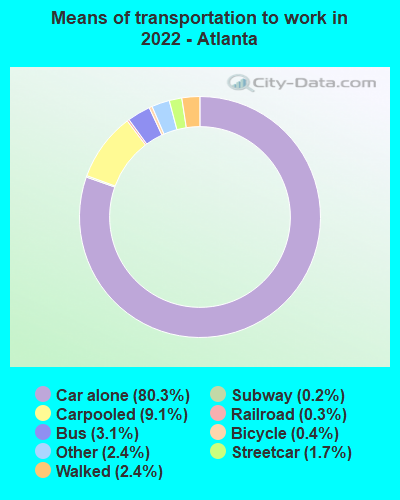
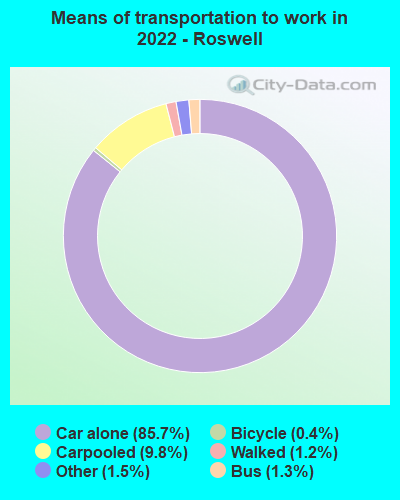
Means of transportation to work
Type
Atlanta
Roswell
Bicycle
0.5%
0.4%
Bus
2.1%
0.4%
Carpooled
7.6%
9%
Car alone
84%
87.8%
Motorcycle
0.1%
0.1%
Railroad
0.2%
0.1%
Streetcar
1.1%
0.1%
Subway
0.4%
0.6%
Taxicab
0.3%
0.6%
Walked
1.9%
0.8%
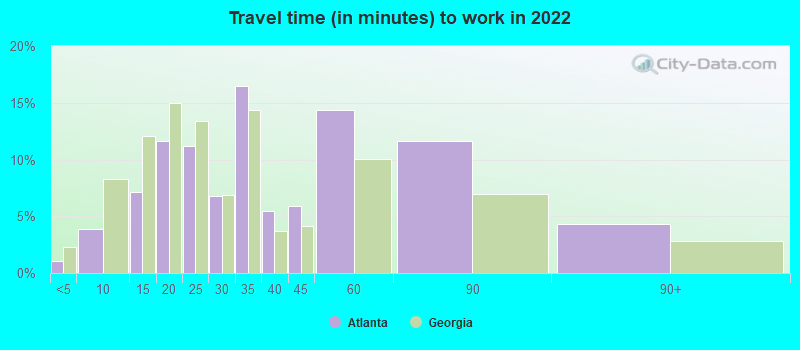
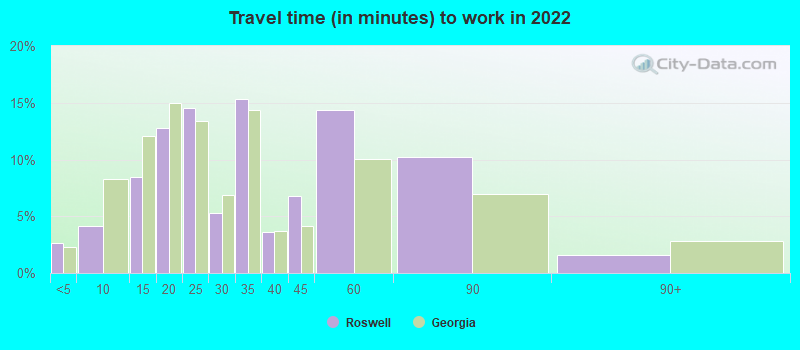
Average travel time to work
Type
Atlanta
Roswell
Average
34.9 min
31.9 min
Other means
24.4 min
31.5 min
Public transportation
47.8 min
49.6 min
Private vehicle occupancy
Type
Atlanta
Roswell
Average
1.1
1.2
Drove alone
92.5%
87.2%
In 2 person carpool
6.7%
9.3%
In 3 person carpool
0.6%
2.2%
In 4 person carpool
0.3%
0.5%
In 5-6 person carpool
0%
0.6%
In 7+ person carpool
0%
0.2%
How many people usually rode to work in the car, truck or van.
Real Estate
Atlanta’s dynamic real estate market often leans towards luxury urban lofts and historic southern style homes. Midtown and Buckhead offer high-end options, while neighborhoods like Candler Park can be more affordable. On the other hand, Roswell’s real estate largely consists of single-family homes with ample yard space, reflecting its suburban style.
Neighborhoods
Atlanta takes pride in its diverse neighborhoods, each with a distinct personality. Neighborhoods like Midtown and Little Five Points offer vibrant nightlife and cultural experiences, while Buckhead is known for its luxury shopping and dining. Roswell, in contrast, is more homogeneous with its peaceful, family-centered suburbs.
Houses and residents
Type
Atlanta
Roswell
Houses
253,355
38,653
Average household size (people)
2.1
2.6
Median year apartment built
1996
1989
Median year house/condo built
1976
1988
Length of stay in the house since moving in
12.2 years
10.6 years
Houses occupied
232,720 (91.9%)
37,044 (95.8%)
Houses occupied by owners
113,092 (48.6%)
25,681 (69.3%)
Houses occupied by renters
119,628 (51.4%)
11,363 (30.7%)
Median rent asked for vacant for-rent units
$1,226
$3,338
Median monthly housing costs
$1,504
$1,635
Median price asked for vacant for-sale houses and condos
$325,147
$283,033
Estimated median house or condo value
$375,500
$480,800
Median numbers of rooms
4.5
6.7
Median number of rooms in apartments
3.5
4.2
Median number of rooms in houses and condos
6.2
8
Median house price - detached houses
$585,854
$504,022
Median house price - in 3-to-4-unit structures
$453,504
$214,283
Median house price - in 5 or more unit structures
$356,868
$295,993
Median house price - mobile homes
$149,278
$89,160
Median house price - Townhouses or other attached units
$383,334
$379,995
Median house price - All housing units
$508,525
$480,440
Median house age
34
32
Renting percentage
55.1%
33.1%
Housing density (houses/condos per square mile)
1,923
1,016.6
House value disparities
36.3%
23.7%
Household income disparities
47.8%
39.7%
Median household income for houses/condes with a mortgage
$123,344
$151,956
Median household income for apartments without a mortgage
$75,939
$109,519
Housing units without a mortgage
1,022 (1.3%)
258 (1.4%)
Housing units with both a second mortgage and home equity loan
5,566 (7%)
1,632 (8.8%)
Housing units with a mortgage
78,250 (98.7%)
18,349 (98.6%)
Housing units with a home equity loan
58 (0.1%)
0 (0%)
Housing units with a second mortgage
7,203 (9.1%)
1,705 (9.2%)
House/condo owner moved in on average (years ago)
7
6
House/condo renter moved in on average (years ago)
1
1
Housing units lacking complete kitchen facilities
2%
2.2%
Housing units lacking complete plumbing facilities
1.5%
0.1%
Housing units in structures
Housing units in structures
Atlanta
Roswell
One, detached
37.5%
55.7%
One, attached
6.6%
13.9%
Two
2.4%
0.2%
3 or 4
3.9%
1.7%
5 to 9
5.9%
7.6%
10 to 19
5.7%
11.3%
20 to 49
6.8%
2.3%
50 or more
30.7%
7.1%
Mobile homes
0.5%
0.1%
Median real estate property taxes paid for housing units
Self-employed workers in own not incorporated business
15,892
3,052
State government workers
13,288
656
Unpaid family workers
550
253
Industries and Occupations
In Atlanta, the major industries include healthcare, film and TV production, technology, and finance, providing a varied occupational landscape. Meanwhile, Roswell leans more towards the retail sector and local businesses, with a significant number of residents commuting to Atlanta for work.
Health diagnosing and treating practitioners and other technical occupations
5.6%
7.1%
Arts, design, entertainment, sports, and media occupations
5.5%
3.1%
Food preparation and serving related occupations
4.0%
3.5%
Building and grounds cleaning and maintenance occupations
3.4%
2.7%
Personal care and service occupations
3.3%
3.4%
Legal occupations
3.3%
1.1%
Community and social service occupations
2.8%
1.1%
Computer and mathematical occupations
2.7%
3.2%
Architecture and engineering occupations
2.6%
1.1%
Health technologists and technicians
2.3%
3.2%
Transportation occupations
2.3%
0.0%
Life, physical, and social science occupations
2.2%
1.8%
Healthcare support occupations
2.2%
1.4%
Material moving occupations
1.6%
2.1%
Firefighting and prevention, and other protective service workers including supervisors
1.6%
0.5%
Health Care
Atlanta is home to many nationally ranked hospitals including Emory Healthcare and Grady Memorial Hospital. Roswell residents often utilize these facilities as well, but locally they have access to top-rated hospitals like Wellstar North Fulton Hospital.
Atlanta's infrastructure includes the world's busiest airport, expansive freeways, and Marta, a comprehensive public transportation system. However, it's also known for its heavy traffic. Alternatively, Roswell's infrastructure is smaller and less congested, but residents often commute into Atlanta for work, contributing to the traffic woes.
Infrastructure
Type
Atlanta
Roswell
Hospitals
46
1
TV stations
22
23
Bank branches located here
235
29
Bank institutions located here
41
12
Main business address for public companies
85
1
Drinking water stations with no reported violations in the past
5
0
Drinking water stations with reported violations in the past
HMDA - Conventional home purchase loans - Applications denied
Year
Atlanta
Roswell
1999
1,775
176
2000
1,902
160
2001
1,552
122
2002
1,683
100
2003
3,212
186
2004
4,962
281
2005
9,078
292
2006
10,866
327
2007
6,626
229
2008
2,140
98
2009
731
64
Culture and Food
Atlanta is known for its rich history and diverse cultural offerings. It's home to world-class museums, theaters, and a renowned music scene. Its food culture presents a fusion of southern comfort food along with diverse international cuisine. As for Roswell, it holds a more traditional southern charm with a thriving arts scene, historic centers, and local restaurants that reflect Georgia's culinary traditions.
Sports Teams
Atlanta is home to several professional sports teams, including football’s Atlanta Falcons, baseball's Braves, and basketball's Atlanta Hawks. Roswell does not have its own professional sports teams, but its residents often support Atlanta’s teams.


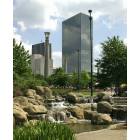


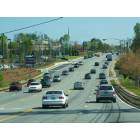

 Atlanta, GA
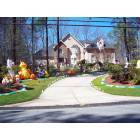
 Roswell, GA