Comparing life between two cities encompasses a wide range of elements. This comparison between Charlotte, NC and Augusta-Richmond County, GA, provides a comprehensive comparison of what these cities offer in terms of living, working, and tourism environment. Key aspects like crime and safety, weather, cost of living, education, economy, infrastructure, and more have been evaluated to give a complete picture of what a potential resident or visitor might expect.
Distance between
Charlotte, NC and
Augusta-Richmond County, GA : 140.2 miles
Charlotte's population is larger by 337%. Its population has grown by 338,881 people (62.7%) since 2000. The population of Augusta-Richmond County has grown by 6,014 people (3.1%) during that time.
In terms of crime and personal safety, Charlotte has a higher crime rate than the national average. However, it's important to note that crime rates can vary greatly by neighborhood. In Augusta-Richmond, the crime rate is also higher than the national average, but lower than Charlotte. Both cities implement numerous safety initiatives to improve these rates ongoingly.
Cost of Living
Living in Charlotte, NC, is somewhat more expensive than living in Augusta-Richmond County, GA. This reflects in the cost of goods, services, and housing. However, Charlotte also typically offers higher wages, which can offset the increased cost of living.
Income Tax
As for income tax, North Carolina has a flat rate of 5.25%, while Georgia has a progressive tax system, ranging from 1% to 5.75%.
Property Tax
The property tax rate for Charlotte, NC, is typically around 1.31%, while Augusta-Richmond County, GA, tends to be slightly lower at around 0.87%.
Sales Tax
Sales tax in Charlotte is slightly higher at 7.25% compared to Augusta-Richmond's 8%. However, these rates are inclusive of state and city sales tax and may vary depending on the type of goods purchased.
Income
Type
Charlotte
Augusta-Richmond County
Estimated median household income
$70,869
$47,921
Estimated per capita income
$44,593
$27,864
Cost of living index (U.S. average is 100)
93.2
89.2
If you make $50,000 in Augusta-Richmond County, you will have to make $52,242 in Charlotte to maintain the same standard of living.
Geographical Conditions
Geographically, Charlotte offers a mix of urban and outdoor activities, with close proximity to the mountains and coast. Augusta-Richmond County, located along the Savannah River, offers a wealth of outdoor recreational activities, including fishing, boating, and golfing.
Charlotte and Augusta-Richmond County both offer a good range of educational opportunities. Charlotte is home to top-rated public, private, and charter schools and several universities, including the University of North Carolina at Charlotte. The Richmond County School System serves Augusta-Richmond, with several recognized schools. Augusta University, a renowned medical school, is also located here.
Charlotte's economy is driven by several sectors, including finance, technology, and energy. It's the second-largest banking center in the United States, hosting many Fortune 500 companies. Augusta-Richmond's economy is heavily based on the healthcare industry, military, and education.
Biggest Employers
In Charlotte, some of the biggest employers are Atrium Health, Wells Fargo, and American Airlines. In Augusta-Richmond, the leading employers are Augusta University Health, the Richmond County School System, and the Savannah River Site, a nuclear reservation.
In Charlotte (Mecklenburg County), 60.8% voted for Democrats and 38.3% for Republicans in 2012 Presidential Election. In Augusta-Richmond County (Richmond County), 66.5% voted for Democrats and 32.7% for Republicans.
Elections
Type
Democrats
Republicans
Other
Year
Charlotte
Augusta-Richmond County
Charlotte
Augusta-Richmond County
Charlotte
Augusta-Richmond County
2020
66.8%
67.9%
31.6%
30.8%
1.6%
1.3%
2016
62.3%
64.4%
32.9%
32.3%
4.8%
3.4%
2012
60.8%
66.5%
38.3%
32.7%
0.9%
0.7%
2008
62.0%
65.7%
37.6%
33.9%
0.5%
0.4%
2004
51.7%
56.7%
48.0%
43.0%
0.3%
0.4%
2000
48.4%
54.6%
51.1%
44.3%
0.5%
1.1%
1996
48.6%
54.1%
45.9%
41.6%
5.5%
4.3%
Breakdown of population affiliated with a religious congregation
Type
Adherents
Congregations
Religion
Charlotte
Augusta-Richmond County
Charlotte
Augusta-Richmond County
SOUTHERN BAPTIST CONVENTION
9.0%
15.8%
19.0%
16.9%
CATHOLIC CHURCH
8.5%
7.9%
1.8%
1.6%
AMERICAN BAPTIST CHURCHES IN THE USA
2.3%
0.6%
1.1%
1.2%
EPISCOPAL CHURCH
1.2%
1.6%
1.3%
2.8%
EVANGELICAL LUTHERAN CHURCH IN AMERICA
0.9%
0.9%
1.8%
0.8%
PRESBYTERIAN CHURCH IN AMERICA
0.6%
1.2%
1.9%
1.2%
SEVENTH DAY ADVENTIST CHURCH
0.5%
0.2%
1.5%
0.4%
MUSLIM ESTIMATE
0.3%
1.0%
1.2%
1.2%
INTERNA PENTECO HOLINESS CHURCH
0.1%
0.4%
0.5%
2.0%
Weather
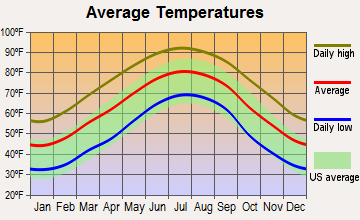
Both Charlotte and Augusta-Richmond County boast a pleasant climate, characterized by hot, humid summers and mild to cool winters. Charlotte experiences a slightly cooler winter due to its higher altitude. Augusta-Richmond County, on the other hand, tends to have a bit warmer climate, with a longer summer.
Weather and climate
Type
Charlotte
Augusta-Richmond County
Temperature - Average
61°F
63°F
Humidity - Average morning or afternoon humidity
72.3%
74.3%
Humidity - Differences between morning and afternoon humidity
41%
44%
Humidity - Maximum monthly morning or afternoon humidity
87%
90%
Humidity - Minimum monthly morning or afternoon humidity
46%
46%
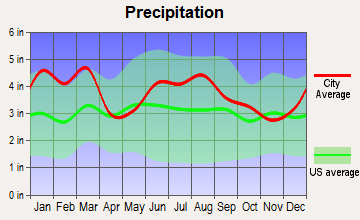
Precipitation - Yearly average
44.5 in
45 in
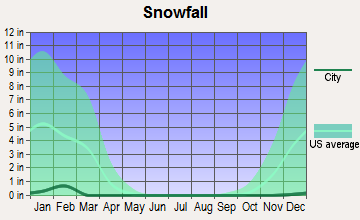
Snowfall - Yearly average
10.2 in
2 in
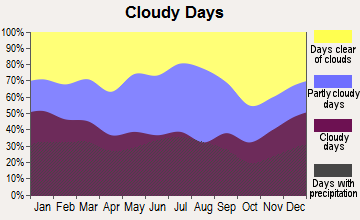
Clouds - Number of days clear of clouds
18.1%
18.7%
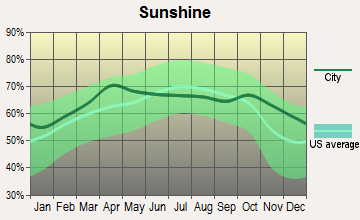
Sunshine amount - Average
69.8%
69%
Sunshine amount - Differences during a year
14%
14.6%
Sunshine amount - Maximum monthly
70%
69.3%
Sunshine amount - Minimum monthly
56%
54.7%
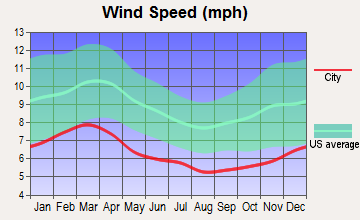
Wind speed - Average
6.9 mph
6 mph
Average climate in Charlotte, North Carolina
Average climate in Augusta-Richmond County, Georgia
Air pollution
Type
AQI
CO
NO2
OZONE
PB
PM10
PM25
SO2
Year
Charlotte
Augusta-Richmond County
Charlotte
Charlotte
Charlotte
Augusta-Richmond County
Charlotte
Augusta-Richmond County
Charlotte
Augusta-Richmond County
Charlotte
Augusta-Richmond County
Charlotte
Augusta-Richmond County
2018
75
77
0.24
N/A
6.3
N/A
27.8
25.4
N/A
N/A
15.5
13.1
8.2
9.9
0.2
0.9
2017
77
76
0.25
N/A
7.0
N/A
28.0
25.9
N/A
N/A
16.3
N/A
8.8
8.7
0.2
1.0
2016
82
81
0.25
N/A
7.6
N/A
28.7
26.5
N/A
N/A
N/A
N/A
8.4
8.9
0.2
1.8
2015
76
70
0.25
N/A
8.1
N/A
27.6
25.0
N/A
N/A
N/A
N/A
8.6
8.4
0.2
1.6
2014
76
76
0.26
N/A
8.5
N/A
26.3
26.2
N/A
N/A
N/A
N/A
9.3
10.0
0.3
1.8
2013
71
76
0.29
N/A
8.4
N/A
25.5
25.7
N/A
N/A
N/A
N/A
8.6
8.8
0.3
1.7
2012
95
89
0.28
N/A
8.7
N/A
27.3
27.4
N/A
N/A
N/A
N/A
9.7
10.4
0.3
N/A
2011
94
93
0.34
N/A
10.1
N/A
28.9
30.2
N/A
N/A
N/A
N/A
11.2
11.8
0.6
N/A
2010
97
85
0.33
N/A
11.8
N/A
28.0
27.8
N/A
N/A
N/A
N/A
11.6
10.9
1.0
N/A
2009
82
79
0.30
N/A
10.0
N/A
25.4
26.2
N/A
N/A
N/A
N/A
11.1
10.3
0.9
N/A
2008
102
97
0.32
N/A
11.2
N/A
27.6
27.7
N/A
0.004
N/A
N/A
13.0
12.4
2.1
N/A
2007
108
102
0.37
N/A
13.9
N/A
29.1
28.3
0.001
0.005
N/A
N/A
14.5
14.8
3.0
N/A
2006
107
106
0.44
N/A
13.9
N/A
27.3
27.9
0.000
0.004
N/A
N/A
14.8
14.6
3.3
N/A
2005
109
110
0.53
N/A
14.6
N/A
30.6
26.4
0.000
0.006
N/A
N/A
15.2
14.6
2.7
N/A
2004
89
109
0.53
N/A
14.6
N/A
28.9
25.4
0.001
0.006
N/A
N/A
N/A
14.7
2.8
N/A
2003
85
84
0.57
N/A
15.6
N/A
27.6
23.6
0.003
0.003
N/A
N/A
N/A
N/A
3.0
N/A
2002
103
90
0.63
N/A
15.3
N/A
32.6
26.2
0.003
0.000
N/A
N/A
N/A
N/A
2.7
N/A
2001
108
98
0.72
N/A
17.5
N/A
32.3
27.1
0.005
0.002
N/A
N/A
N/A
N/A
3.9
2.4
2000
107
109
0.79
N/A
18.0
N/A
32.6
29.0
0.014
0.002
N/A
N/A
N/A
N/A
4.4
N/A
Natural disasters
Type
Charlotte
Augusta-Richmond County
Tornado activity compared to U.S. average
111.5%
101.7%
Earthquake activity compared to U.S. average
79%
85.8%
Natural disasters compared to U.S. average
9%
7%
Transportation
Charlotte offers reliable public transportation through the CATS bus system and the LYNX light rail. Augusta-Richmond County, while smaller, still offers public transit through Augusta Public Transit and an extensive road network.
Transport
Type
Charlotte
Augusta-Richmond County
Amtrak stations
1
0
Amtrak stations nearby
2
0
FAA registered aircraft
439
0
FAA registered aircraft manufacturers and dealers
12
0
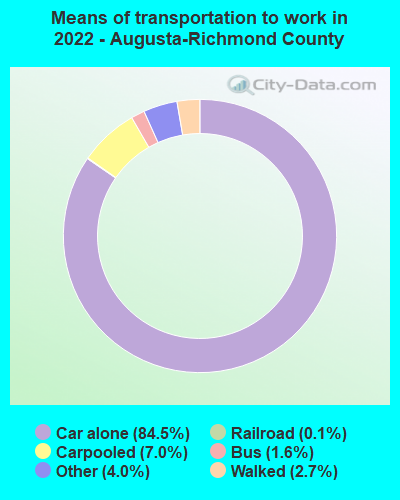
Means of transportation to work
Type
Charlotte
Augusta-Richmond County
Bicycle
0.1%
0.1%
Bus
1.2%
0.9%
Carpooled
8.7%
8.2%
Car alone
86.2%
86.6%
Railroad
0.4%
0%
Taxicab
0.2%
0.3%
Walked
1.5%
1.8%
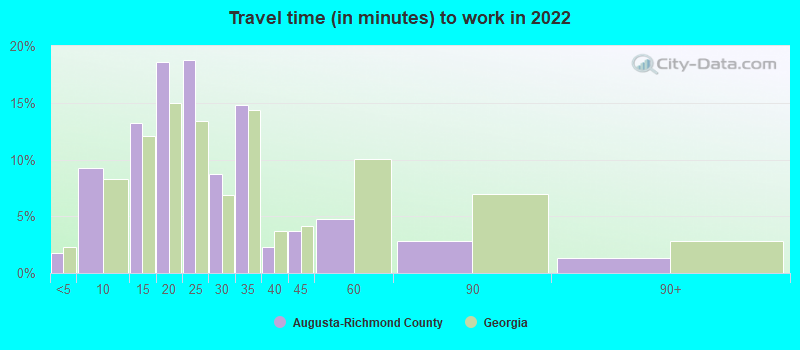
Average travel time to work
Type
Charlotte
Augusta-Richmond County
Average
29.6 min
24.8 min
Other means
24.9 min
22 min
Public transportation
44.1 min
35 min
Private vehicle occupancy
Type
Charlotte
Augusta-Richmond County
Average
1.2
1.1
Drove alone
90%
89.9%
In 2 person carpool
6.9%
8.1%
In 3 person carpool
1.8%
1.3%
In 4 person carpool
0.8%
0.3%
In 5-6 person carpool
0.5%
0.2%
In 7+ person carpool
0.1%
0.2%
How many people usually rode to work in the car, truck or van.
Real Estate
Real estate in Charlotte tends to be more expensive than in Augusta-Richmond County due to its large economy and population. Both cities offer a variety of living options from downtown apartments to suburban homes.
Neighborhoods
In Charlotte, neighborhoods like Myers Park and Eastover are sought after for their charm, schools, and amenities, while in Augusta-Richmond, Summerville and Forrest Hills are popular choices for their historical appeal and green space.
Houses and residents
Type
Charlotte
Augusta-Richmond County
Houses
393,631
90,645
Average household size (people)
2.5
2.5
Median year apartment built
1998
1983
Median year house/condo built
1993
1978
Length of stay in the house since moving in
11.8 years
16.2 years
Houses occupied
365,269 (92.8%)
72,760 (80.3%)
Houses occupied by owners
193,930 (53.1%)
37,458 (51.5%)
Houses occupied by renters
171,339 (46.9%)
35,302 (48.5%)
Median rent asked for vacant for-rent units
$1,482
$1,033
Median monthly housing costs
$1,302
$920
Median price asked for vacant for-sale houses and condos
$445,491
$171,838
Estimated median house or condo value
$321,400
$131,900
Median numbers of rooms
5.3
5.5
Median number of rooms in apartments
4
4.5
Median number of rooms in houses and condos
6.6
6.5
Median house price - detached houses
$388,029
$177,707
Median house price - in 3-to-4-unit structures
$178,624
$242,054
Median house price - in 5 or more unit structures
$433,957
$166,025
Median house price - mobile homes
$52,977
$72,383
Median house price - Townhouses or other attached units
$296,370
$162,209
Median house price - All housing units
$378,423
$171,426
Median house age
26
41
Renting percentage
42.6%
46.4%
Housing density (houses/condos per square mile)
1,624.8
300
House value disparities
33.3%
40.6%
Household income disparities
44.1%
47.5%
Median household income for houses/condes with a mortgage
$105,905
$73,692
Median household income for apartments without a mortgage
$70,681
$50,875
Housing units without a mortgage
3,089 (2.1%)
576 (2.5%)
Housing units with both a second mortgage and home equity loan
10,553 (7.2%)
824 (3.5%)
Housing units with a mortgage
142,912 (97.9%)
22,818 (97.5%)
Housing units with a home equity loan
171 (0.1%)
127 (0.5%)
Housing units with a second mortgage
13,532 (9.3%)
1,097 (4.7%)
House/condo owner moved in on average (years ago)
9
17
House/condo renter moved in on average (years ago)
1
1
Housing units lacking complete kitchen facilities
0.8%
4.7%
Housing units lacking complete plumbing facilities
0.2%
3.1%
Housing units in structures
Housing units in structures
Charlotte
Augusta-Richmond County
One, detached
52.7%
57.9%
One, attached
9.1%
5.2%
Two
0.9%
2.9%
3 or 4
2.9%
7.9%
5 to 9
7.1%
9.9%
10 to 19
9.5%
4.7%
20 to 49
6.2%
2.2%
50 or more
10.3%
2.5%
Mobile homes
1.4%
6.8%
Median real estate property taxes paid for housing units
Self-employed workers in own not incorporated business
25,780
2,768
State government workers
16,519
7,865
Unpaid family workers
1,214
96
Industries and Occupations
Banking is the cornerstone of Charlotte's industries, with companies like Bank of America and Wells Fargo having significant operations here. In Augusta-Richmond County, the healthcare sector drives a large portion of employment, thanks to the presence of the Augusta University Health System and the Charlie Norwood VA Medical Center.
Both cities provide quality healthcare services. Charlotte is home to some top-rated hospitals, including Atrium Health's Carolinas Medical Center. Augusta-Richmond is known for Augusta University Health, one of the state's leading health systems.
Health (county statistics)
Type
Charlotte
Augusta-Richmond County
General health status score of residents in this county from 1 (poor) to 5 (excellent)
Charlotte has excellent infrastructure, with a strong transport network of roads, rail, and airport facilities and a rapidly growing skyline. Augusta-Richmond County also has quality infrastructure but is more traditional in design, with a simpler city layout and smaller buildings.
HMDA - Conventional home purchase loans - Applications denied
Year
Charlotte
Augusta-Richmond County
1999
3,049
857
2000
1,568
957
2001
1,382
589
2002
1,275
420
2003
1,879
393
2004
2,415
554
2005
3,078
550
2006
3,864
594
2007
3,106
399
2008
1,287
207
2009
617
104
Culture and Food
Both cities offer a rich cultural scene. Charlotte is known for its NASCAR roots, while Augusta-Richmond County is home to the Masters Golf Tournament. Food-wise, both cities offer delicious Southern cuisine, but Charlotte has a more diverse food scene, reflecting its more diverse population.
Sports Teams
Sports enthusiasts will enjoy living in Charlotte, home to the Carolina Panthers (NFL), Charlotte Hornets (NBA), and a NASCAR hub. Augusta-Richmond might not host major league teams but the city comes alive every year with the Masters Golf Tournament, a major sporting event.


 Charlotte, NC and
  Augusta-Richmond County, GA : 140.2 miles