Comparing Charlotte and Fayetteville, North Carolina reveals distinct differences and unique charms each city has to offer. Charlotte, the largest city in North Carolina, offers a vibrant city lifestyle with a booming economy and robust infrastructures. A fast-growing city, it promises progress, opportunities, and a welcoming community. In contrast, Fayetteville, being smaller and more laidback, values its historical and military heritage, resulting in a quieter pace of life. Various factors including crime/safety, weather, cost of living, education, work and economy, infrastructure, and others will be explored to give a comprehensive comparison.
Distance between
Charlotte, NC and
Fayetteville, NC : 108.4 miles
Charlotte's population is larger by 321%. Its population has grown by 338,881 people (62.7%) since 2000. The population of Fayetteville has grown by 87,763 people (72.5%) during that time.
Like any urban centers, both cities deal with crime. However, the overall crime rate in Fayetteville tends to be slightly higher than in Charlotte. While Charlotte has prioritized creating a safe environment with extensive investments in public safety measures. Fayetteville, due to its smaller size and budget, still struggles to reduce crime rates below national averages. Tourists and potential residents should remain vigilant in both cities.
Cost of Living
In general, Charlotte is more expensive than Fayetteville due to its status as a business hub with higher average salaries. Housing is notably more expensive in the upscale areas of Charlotte compared to residential areas in Fayetteville.
Income Tax
North Carolina has a flat state income tax of 5.25%, applicable to both cities. However, there are no city-specific income taxes.
Property Tax
Both cities differ in their property tax rates. Charlotte’s is generally higher while Fayetteville’s is comparatively lower.
Sales Tax
Both Charlotte and Fayetteville have the same state sales tax rate, which is 4.75%. The city sales tax is 2%, totaling 6.75% sales tax in both cities.
Income
Type
Charlotte
Fayetteville
Estimated median household income
$70,869
$51,629
Estimated per capita income
$44,593
$27,983
Cost of living index (U.S. average is 100)
93.2
88.7
If you make $50,000 in Fayetteville, you will have to make $52,537 in Charlotte to maintain the same standard of living.
Geographical Conditions
Geographically, Charlotte is situated in the Piedmont region, presenting an interesting juxtaposition of urban growth and natural beauty. Fayetteville finds its place in the Coastal Plains, offering softer terrain and close proximity to some gorgeous beaches.
Charlotte offers better access to higher education, with institutions like University of North Carolina at Charlotte and Wake Forest University. Fayetteville is home to Fayetteville State University and Methodist University, but it may not have as many educational choices as Charlotte.
Charlotte boasts a dynamic economy with many opportunities in finance, healthcare, and technology. In contrast, Fayetteville's economy is heavily reliant on the military and defense sector, with Fort Bragg being one of the major employers.
Biggest Employers
The biggest employers in Charlotte include Wells Fargo, Bank of America, and Carolinas Healthcare System. In Fayetteville, Fort Bragg and Fayetteville's healthcare and education sectors offer the most jobs.
In Charlotte (Mecklenburg County), 60.8% voted for Democrats and 38.3% for Republicans in 2012 Presidential Election. In Fayetteville (Cumberland County), 59.5% voted for Democrats and 39.8% for Republicans.
Elections
Type
Democrats
Republicans
Other
Year
Charlotte
Fayetteville
Charlotte
Fayetteville
Charlotte
Fayetteville
2020
66.8%
57.6%
31.6%
41.0%
1.6%
1.4%
2016
62.3%
56.2%
32.9%
40.2%
4.8%
3.6%
2012
60.8%
59.5%
38.3%
39.8%
0.9%
0.7%
2008
62.0%
58.7%
37.6%
41.0%
0.5%
0.3%
2004
51.7%
48.1%
48.0%
51.6%
0.3%
0.3%
2000
48.4%
50.1%
51.1%
49.4%
0.5%
0.5%
1996
48.6%
49.2%
45.9%
44.8%
5.5%
5.9%
Breakdown of population affiliated with a religious congregation
Type
Adherents
Congregations
Religion
Charlotte
Fayetteville
Charlotte
Fayetteville
SOUTHERN BAPTIST CONVENTION
9.0%
10.8%
19.0%
19.5%
CATHOLIC CHURCH
8.5%
2.8%
1.8%
1.6%
AMERICAN BAPTIST CHURCHES IN THE USA
2.3%
1.7%
1.1%
0.2%
EPISCOPAL CHURCH
1.2%
0.5%
1.3%
1.4%
EVANGELICAL LUTHERAN CHURCH IN AMERICA
0.9%
0.1%
1.8%
0.2%
PRESBYTERIAN CHURCH IN AMERICA
0.6%
0.1%
1.9%
0.7%
SEVENTH DAY ADVENTIST CHURCH
0.5%
0.4%
1.5%
0.7%
MUSLIM ESTIMATE
0.3%
0.1%
1.2%
0.5%
INTERNA PENTECO HOLINESS CHURCH
0.1%
2.6%
0.5%
4.5%
Weather
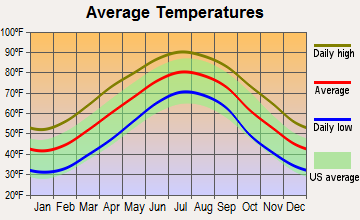
Both cities enjoy a subtropical climate, with Charlotte slightly colder due to its higher altitude. Winters in Charlotte can be chillier with occasional snowfall, while Fayetteville enjoys milder temperatures with rare snow. Summers in both cities, however, are hot and humid, appealing to the warm-weather lovers.
Weather and climate
Type
Charlotte
Fayetteville
Temperature - Average
61°F
61.4°F
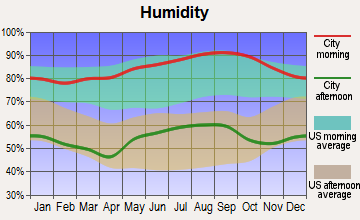
Humidity - Average morning or afternoon humidity
72.3%
74.1%
Humidity - Differences between morning and afternoon humidity
41%
42.8%
Humidity - Maximum monthly morning or afternoon humidity
87%
89.5%
Humidity - Minimum monthly morning or afternoon humidity
46%
46.7%
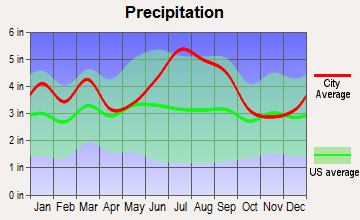
Precipitation - Yearly average
44.5 in
46.8 in
Snowfall - Yearly average
10.2 in
11.3 in
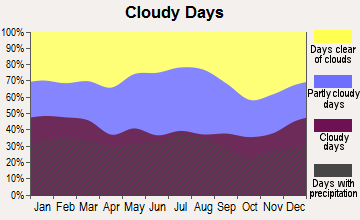
Clouds - Number of days clear of clouds
18.1%
18.4%
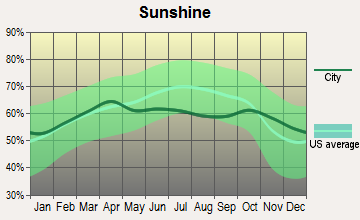
Sunshine amount - Average
69.8%
64.9%
Sunshine amount - Differences during a year
14%
13.1%
Sunshine amount - Maximum monthly
70%
65.7%
Sunshine amount - Minimum monthly
56%
52.6%
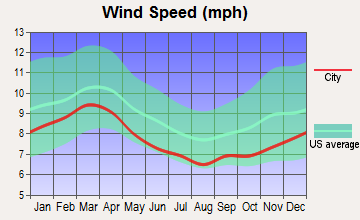
Wind speed - Average
6.9 mph
7.5 mph
Average climate in Charlotte, North Carolina
Average climate in Fayetteville, North Carolina
Air pollution
Type
AQI
CO
NO2
OZONE
PB
PM10
PM25
SO2
Year
Charlotte
Fayetteville
Charlotte
Charlotte
Charlotte
Fayetteville
Charlotte
Charlotte
Fayetteville
Charlotte
Fayetteville
Charlotte
Fayetteville
2018
75
61
0.24
N/A
6.3
N/A
27.8
29.1
N/A
N/A
15.5
11.5
8.2
7.4
0.2
0.4
2017
77
67
0.25
N/A
7.0
N/A
28.0
32.9
N/A
N/A
16.3
11.5
8.8
9.0
0.2
N/A
2016
82
68
0.25
N/A
7.6
N/A
28.7
31.5
N/A
N/A
N/A
11.8
8.4
8.7
0.2
N/A
2015
76
60
0.25
N/A
8.1
N/A
27.6
29.5
N/A
N/A
N/A
N/A
8.6
7.1
0.2
0.1
2014
76
65
0.26
N/A
8.5
N/A
26.3
33.0
N/A
N/A
N/A
N/A
9.3
8.9
0.3
N/A
2013
71
65
0.29
N/A
8.4
N/A
25.5
28.4
N/A
N/A
N/A
N/A
8.6
8.5
0.3
N/A
2012
95
74
0.28
N/A
8.7
N/A
27.3
31.0
N/A
N/A
N/A
N/A
9.7
9.1
0.3
0.1
2011
94
80
0.34
N/A
10.1
N/A
28.9
33.9
N/A
N/A
N/A
N/A
11.2
10.7
0.6
N/A
2010
97
86
0.33
N/A
11.8
N/A
28.0
34.7
N/A
N/A
N/A
N/A
11.6
10.6
1.0
N/A
2009
82
75
0.30
N/A
10.0
N/A
25.4
31.1
N/A
N/A
N/A
N/A
11.1
10.5
0.9
1.1
2008
102
88
0.32
N/A
11.2
N/A
27.6
32.9
N/A
N/A
N/A
N/A
13.0
12.3
2.1
N/A
2007
108
93
0.37
N/A
13.9
N/A
29.1
35.5
0.001
N/A
N/A
N/A
14.5
13.7
3.0
N/A
2006
107
96
0.44
N/A
13.9
N/A
27.3
31.5
0.000
N/A
N/A
N/A
14.8
14.7
3.3
2.2
2005
109
125
0.53
N/A
14.6
N/A
30.6
34.5
0.000
N/A
N/A
N/A
15.2
N/A
2.7
N/A
2004
89
92
0.53
N/A
14.6
N/A
28.9
30.2
0.001
N/A
N/A
N/A
N/A
N/A
2.8
N/A
2003
85
92
0.57
N/A
15.6
N/A
27.6
31.9
0.003
N/A
N/A
N/A
N/A
N/A
3.0
N/A
2002
103
87
0.63
N/A
15.3
N/A
32.6
34.6
0.003
N/A
N/A
N/A
N/A
N/A
2.7
1.9
2001
108
124
0.72
N/A
17.5
N/A
32.3
36.3
0.005
N/A
N/A
N/A
N/A
N/A
3.9
N/A
2000
107
117
0.79
N/A
18.0
N/A
32.6
36.5
0.014
N/A
N/A
N/A
N/A
N/A
4.4
N/A
Natural disasters
Type
Charlotte
Fayetteville
Tornado activity compared to U.S. average
111.5%
112.7%
Earthquake activity compared to U.S. average
79%
49.2%
Natural disasters compared to U.S. average
9%
15%
Transportation
Charlotte has an extensive public transit system with buses, light rail, and streetcars. Its larger size could mean a longer commute. Fayetteville, being smaller, mostly relies on cars for commuting with limited public transit options.
Transport
Type
Charlotte
Fayetteville
Amtrak stations
1
1
Amtrak stations nearby
2
1
FAA registered aircraft
439
110
FAA registered aircraft manufacturers and dealers
12
4
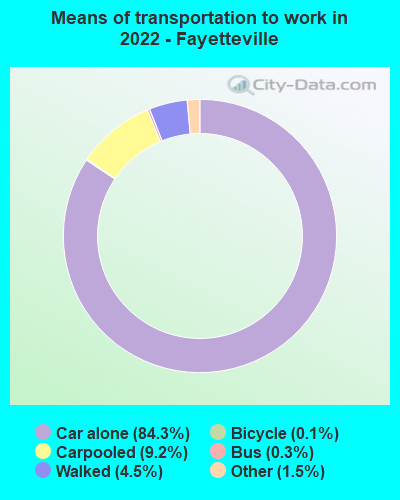
Means of transportation to work
Type
Charlotte
Fayetteville
Bicycle
0.1%
0.1%
Bus
1.2%
0.3%
Carpooled
8.7%
6.5%
Car alone
86.2%
87.8%
Motorcycle
0.1%
0.3%
Railroad
0.4%
0%
Taxicab
0.2%
0.2%
Walked
1.5%
4%
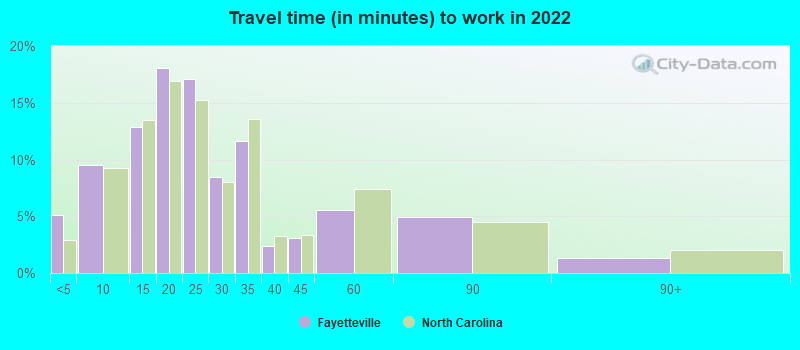
Average travel time to work
Type
Charlotte
Fayetteville
Average
29.6 min
24.4 min
Other means
24.9 min
21 min
Public transportation
44.1 min
42.6 min
Private vehicle occupancy
Type
Charlotte
Fayetteville
Average
1.2
1.1
Drove alone
90%
90.8%
In 2 person carpool
6.9%
7%
In 3 person carpool
1.8%
1.8%
In 4 person carpool
0.8%
0.1%
In 5-6 person carpool
0.5%
0.1%
In 7+ person carpool
0.1%
0.2%
How many people usually rode to work in the car, truck or van.
Real Estate
Real-estate in Charlotte is more expensive, catering to a wealthier, business-savvy population. On the other hand, Fayetteville's real estate is more affordable but with relatively less variety.
Neighborhoods
Charlotte offers diverse neighborhoods from the upscale Myers Park and Ballantyne to trendy NoDa and artsy Plaza Midwood. Fayetteville's historic Haymount or quiet Jack Britt offer pleasant living environments.
Houses and residents
Type
Charlotte
Fayetteville
Houses
393,631
91,054
Average household size (people)
2.5
2.5
Median year apartment built
1998
1987
Median year house/condo built
1993
1982
Length of stay in the house since moving in
11.8 years
13.6 years
Houses occupied
365,269 (92.8%)
83,147 (91.3%)
Houses occupied by owners
193,930 (53.1%)
38,079 (45.8%)
Houses occupied by renters
171,339 (46.9%)
45,068 (54.2%)
Median rent asked for vacant for-rent units
$1,482
$571.42
Median monthly housing costs
$1,302
$1,041
Median price asked for vacant for-sale houses and condos
$445,491
$86,536
Estimated median house or condo value
$321,400
$150,200
Median numbers of rooms
5.3
5.4
Median number of rooms in apartments
4
4.4
Median number of rooms in houses and condos
6.6
6.4
Median house price - detached houses
$388,029
$214,819
Median house price - in 2-unit structures
$184,325
$152,480
Median house price - in 3-to-4-unit structures
$178,624
$234,147
Median house price - in 5 or more unit structures
$433,957
$194,723
Median house price - mobile homes
$52,977
$98,029
Median house price - Townhouses or other attached units
$296,370
$236,623
Median house price - All housing units
$378,423
$214,671
Median house age
26
38
Renting percentage
42.6%
49.7%
Housing density (houses/condos per square mile)
1,624.8
1,549.4
House value disparities
33.3%
32.9%
Household income disparities
44.1%
43.4%
Median household income for houses/condes with a mortgage
$105,905
$73,385
Median household income for apartments without a mortgage
$70,681
$56,188
Housing units without a mortgage
3,089 (2.1%)
726 (2.8%)
Housing units with both a second mortgage and home equity loan
10,553 (7.2%)
593 (2.3%)
Housing units with a mortgage
142,912 (97.9%)
25,293 (97.2%)
Housing units with a home equity loan
171 (0.1%)
67 (0.3%)
Housing units with a second mortgage
13,532 (9.3%)
1,240 (4.8%)
House/condo owner moved in on average (years ago)
9
12
House/condo renter moved in on average (years ago)
1
1
Housing units lacking complete kitchen facilities
0.8%
1.1%
Housing units lacking complete plumbing facilities
0.2%
1.6%
Housing units in structures
Housing units in structures
Charlotte
Fayetteville
One, detached
52.7%
60.8%
One, attached
9.1%
2.8%
Two
0.9%
4.2%
3 or 4
2.9%
5.2%
5 to 9
7.1%
8.9%
10 to 19
9.5%
8.5%
20 to 49
6.2%
5.0%
50 or more
10.3%
1.9%
Mobile homes
1.4%
2.8%
Median real estate property taxes paid for housing units
Self-employed workers in own not incorporated business
25,780
3,292
State government workers
16,519
4,673
Unpaid family workers
1,214
78
Industries and Occupations
Charlotte is known for its banking industry, being the second-largest banking center in the US, and rapidly growing tech sectors. Fayetteville, however, is largely dominated by the military, retail, and healthcare industries.
Healthcare in Charlotte is top-notch with award-winning hospitals like the Carolinas Medical Center. Fayetteville also has quality healthcare facilities, particularly those specializing in care for military personnel and veterans.
Health (county statistics)
Type
Charlotte
Fayetteville
General health status score of residents in this county from 1 (poor) to 5 (excellent)
Charlotte, with its towering skyscrapers and modern facilities, displays robust infrastructure. Fayetteville, smaller and more residential, offers a more relaxed, laid-back lifestyle.
Infrastructure
Type
Charlotte
Fayetteville
Hospitals
37
16
TV stations
16
19
Arenas or stadiums
3
1
Bank branches located here
202
50
Bank institutions located here
26
13
Nuclear power plants nearby
2
0
Drinking water stations with no reported violations in the past
24
4
Drinking water stations with reported violations in the past
HMDA - Conventional home purchase loans - Applications denied
Year
Charlotte
Fayetteville
1999
3,049
1,353
2000
1,568
808
2001
1,382
603
2002
1,275
393
2003
1,879
355
2004
2,415
334
2005
3,078
401
2006
3,864
431
2007
3,106
299
2008
1,287
126
2009
617
93
Culture and Food
Charlotte, with its diverse population, offers a plethora of cultural experiences and cuisines. Fayetteville exudes a strong military-town charm and simple, comforting Southern cuisine.
Sports Teams
In sports, Charlotte shines with its NFL team, the Carolina Panthers, and the NBA’s Charlotte Hornets. Fayetteville does not host major league teams, but is home to the minor league baseball team, the Fayetteville Woodpeckers.


 Charlotte, NC
 Fayetteville, NC