Charlotte, North Carolina and Montgomery, Alabama offer unique southern charm and appeal. Yet, they present diverse experiences both for residents and visitors. Charlotte, being much larger and more productive economically, provides more employment opportunities and amenities. However, Montgomery's smaller size lends to a more laid-back lifestyle. For tourists, both cities offer a rich blend of history, culture, and local cuisine.
Distance between
Charlotte, NC and
Montgomery, AL : 369.5 miles
Charlotte's population is larger by 343%. Its population has grown by 338,881 people (62.7%) since 2000. The population of Montgomery has decreased by 2,903 people (1.4%) during that time.
Based on national crime data, Charlotte tends to have a higher crime rate compared to Montgomery. However, crime rates can vary across neighborhoods in both cities, so personal experiences may differ. Both cities have invested in community policing and crime prevention programs to ensure the safety of their residents and visitors.
Cost of Living
The cost of living in Montgomery is generally lower compared to Charlotte. Housing is particularly more affordable in Montgomery. However, Charlotte boasts a higher median household income, which could offset the cost of living difference in terms of purchasing power for residents.
Income Tax
Both North Carolina and Alabama impose state income tax. Rates in North Carolina range from 5.25% to 8.25%, while in Alabama, they range from 2% to 5%. There are no city income taxes in either Charlotte or Montgomery.
Property Tax
Property tax rates are generally lower in Montgomery. Alabama has one of the lowest property tax rates in the country, while North Carolina’s rates are closer to the national average.
Sales Tax
The combined sales tax rate for Charlotte is slightly higher than Montgomery. North Carolina's state rate is 4.75%, Charlotte adds 2.5% for a total of 7.25%. Alabama's state rate is 4%, and Montgomery adds 3.5%, totaling 7.5%.
Income
Type
Charlotte
Montgomery
Estimated median household income
$70,869
$46,957
Estimated per capita income
$44,593
$27,253
Cost of living index (U.S. average is 100)
93.2
84.6
If you make $50,000 in Montgomery, you will have to make $55,083 in Charlotte to maintain the same standard of living.
Geographical Conditions
Charlotte is located within the southeastern U.S. Piedmont region, near the foothills of the Appalachian Mountains, which offers scenic beauty and outdoor recreation opportunities. Montgomery is located further south on the coastal plain, nearby the Alabama River.
Both cities have a range of public, private, and charter schools. Charlotte, however, is home to more universities and colleges, including the renowned University of North Carolina at Charlotte. Montgomery also has a few notable institutions like Alabama State University and Auburn University at Montgomery.
Charlotte's economy is more diversified and stronger than Montgomery's. It is a major banking and finance hub, hosting the headquarters of Bank of America and significant operations of Wells Fargo, among others. On the other hand, Montgomery has a prominent public sector as the state capital, with government jobs contributing significantly to the local economy.
Biggest Employers
Some of the biggest employers in Charlotte are Atrium Health, Wells Fargo, and American Airlines. Montgomery's top employers include the state of Alabama, Maxwell-Gunter Air Force Base, and Baptist Health.
In Charlotte (Mecklenburg County), 60.8% voted for Democrats and 38.3% for Republicans in 2012 Presidential Election. In Montgomery (Montgomery County), 62.0% voted for Democrats and 37.7% for Republicans.
Elections
Type
Democrats
Republicans
Other
Year
Charlotte
Montgomery
Charlotte
Montgomery
Charlotte
Montgomery
2020
66.8%
65.1%
31.6%
33.6%
1.6%
1.3%
2016
62.3%
61.4%
32.9%
35.5%
4.8%
3.1%
2012
60.8%
62.0%
38.3%
37.7%
0.9%
0.3%
2008
62.0%
59.7%
37.6%
40.3%
0.5%
0.0%
2004
51.7%
50.6%
48.0%
49.4%
0.3%
0.0%
2000
48.4%
50.4%
51.1%
48.4%
0.5%
1.2%
1996
48.6%
48.7%
45.9%
48.0%
5.5%
3.3%
Breakdown of population affiliated with a religious congregation
Type
Adherents
Congregations
Religion
Charlotte
Montgomery
Charlotte
Montgomery
SOUTHERN BAPTIST CONVENTION
9.0%
18.8%
19.0%
15.3%
CATHOLIC CHURCH
8.5%
4.1%
1.8%
2.5%
AMERICAN BAPTIST CHURCHES IN THE USA
2.3%
2.2%
1.1%
0.6%
EPISCOPAL CHURCH
1.2%
1.2%
1.3%
1.7%
EVANGELICAL LUTHERAN CHURCH IN AMERICA
0.9%
0.1%
1.8%
0.3%
PRESBYTERIAN CHURCH IN AMERICA
0.6%
1.2%
1.9%
2.0%
SEVENTH DAY ADVENTIST CHURCH
0.5%
0.9%
1.5%
1.4%
MUSLIM ESTIMATE
0.3%
0.4%
1.2%
0.8%
Weather
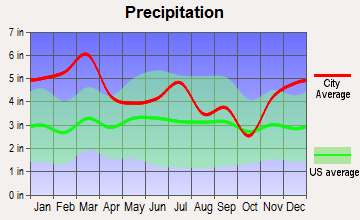
The climates in both cities are largely similar. Charlotte and Montgomery both experience typical southern weather, characterized by hot summers and mild winters. However, Charlotte tends to be slightly cooler due to its higher elevation. Given their southern locations, both locations can be prone to heavy rainfall and thunderstorms.
Weather and climate
Type
Charlotte
Montgomery
Temperature - Average
61°F
64.8°F
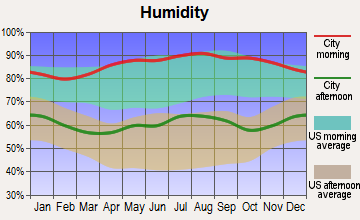
Humidity - Average morning or afternoon humidity
72.3%
76.7%
Humidity - Differences between morning and afternoon humidity
41%
40%
Humidity - Maximum monthly morning or afternoon humidity
87%
91%
Humidity - Minimum monthly morning or afternoon humidity
46%
51%
Precipitation - Yearly average
44.5 in
52.5 in
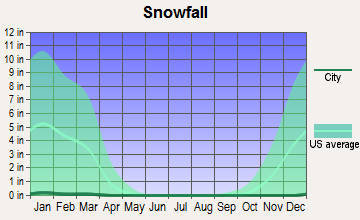
Snowfall - Yearly average
10.2 in
0.8 in
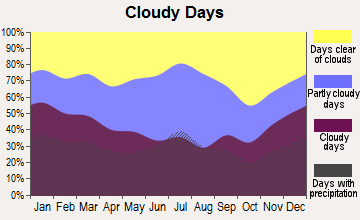
Clouds - Number of days clear of clouds
18.1%
17.9%
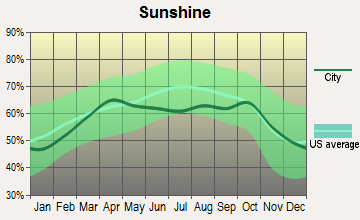
Sunshine amount - Average
69.8%
63.1%
Sunshine amount - Differences during a year
14%
17%
Sunshine amount - Maximum monthly
70%
64%
Sunshine amount - Minimum monthly
56%
47%
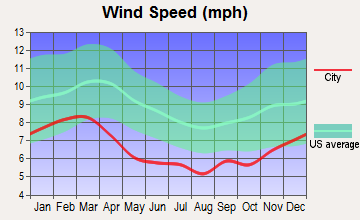
Wind speed - Average
6.9 mph
6.4 mph
Average climate in Charlotte, North Carolina
Average climate in Montgomery, Alabama
Air pollution
Type
AQI
CO
NO2
OZONE
PB
PM10
PM25
SO2
Year
Charlotte
Montgomery
Charlotte
Charlotte
Charlotte
Montgomery
Charlotte
Charlotte
Charlotte
Montgomery
Charlotte
2018
75
75
0.24
N/A
6.3
N/A
27.8
26.3
N/A
N/A
15.5
N/A
8.2
13.8
0.2
N/A
2017
77
89
0.25
N/A
7.0
N/A
28.0
27.8
N/A
N/A
16.3
N/A
8.8
11.7
0.2
N/A
2016
82
75
0.25
N/A
7.6
N/A
28.7
29.6
N/A
N/A
N/A
N/A
8.4
8.8
0.2
N/A
2015
76
76
0.25
N/A
8.1
N/A
27.6
26.8
N/A
N/A
N/A
N/A
8.6
10.6
0.2
N/A
2014
76
55
0.26
N/A
8.5
N/A
26.3
28.2
N/A
N/A
N/A
N/A
9.3
N/A
0.3
N/A
2013
71
53
0.29
N/A
8.4
N/A
25.5
27.2
N/A
N/A
N/A
N/A
8.6
N/A
0.3
N/A
2012
95
63
0.28
N/A
8.7
N/A
27.3
29.7
N/A
N/A
N/A
N/A
9.7
N/A
0.3
N/A
2011
94
67
0.34
N/A
10.1
N/A
28.9
31.2
N/A
N/A
N/A
N/A
11.2
N/A
0.6
N/A
2010
97
84
0.33
N/A
11.8
N/A
28.0
31.2
N/A
N/A
N/A
N/A
11.6
12.5
1.0
N/A
2009
82
68
0.30
N/A
10.0
N/A
25.4
27.1
N/A
N/A
N/A
N/A
11.1
10.5
0.9
N/A
2008
102
79
0.32
N/A
11.2
N/A
27.6
30.4
N/A
N/A
N/A
N/A
13.0
N/A
2.1
N/A
2007
108
90
0.37
N/A
13.9
N/A
29.1
34.0
0.001
N/A
N/A
N/A
14.5
N/A
3.0
N/A
2006
107
73
0.44
N/A
13.9
N/A
27.3
31.4
0.000
N/A
N/A
N/A
14.8
N/A
3.3
N/A
2005
109
71
0.53
N/A
14.6
N/A
30.6
28.0
0.000
N/A
N/A
N/A
15.2
N/A
2.7
N/A
2004
89
62
0.53
N/A
14.6
N/A
28.9
26.0
0.001
N/A
N/A
N/A
N/A
N/A
2.8
N/A
2003
85
67
0.57
N/A
15.6
N/A
27.6
25.4
0.003
N/A
N/A
N/A
N/A
N/A
3.0
N/A
2002
103
78
0.63
N/A
15.3
N/A
32.6
28.6
0.003
N/A
N/A
N/A
N/A
N/A
2.7
N/A
2001
108
94
0.72
N/A
17.5
N/A
32.3
28.3
0.005
N/A
N/A
N/A
N/A
N/A
3.9
N/A
2000
107
108
0.79
N/A
18.0
N/A
32.6
35.9
0.014
N/A
N/A
N/A
N/A
N/A
4.4
N/A
Natural disasters
Type
Charlotte
Montgomery
Tornado activity compared to U.S. average
111.5%
144.5%
Earthquake activity compared to U.S. average
79%
166.1%
Natural disasters compared to U.S. average
9%
15%
Transportation
Charlotte has a more extensive public transportation system, including buses, light rail, and a bike-share program. Traffic can be heavy during peak hours. Montgomery, being smaller, is less conjested but has a less comprehensive public transit infrastructure.
Transport
Type
Charlotte
Montgomery
Amtrak stations
1
1
Amtrak stations nearby
2
1
FAA registered aircraft
439
168
FAA registered aircraft manufacturers and dealers
12
9
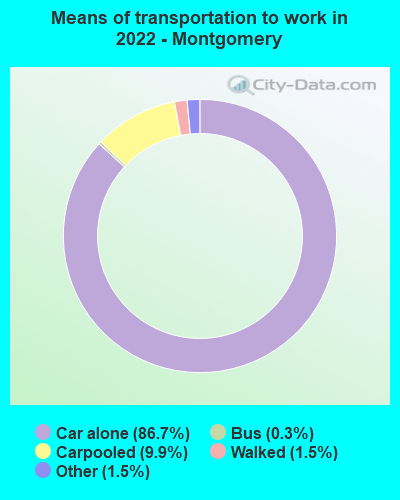
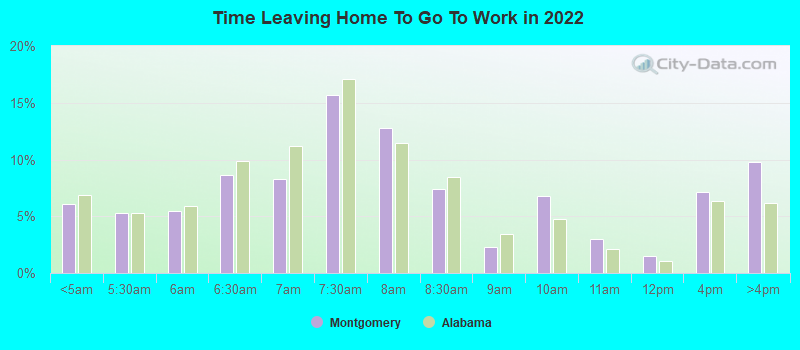
Means of transportation to work
Type
Charlotte
Montgomery
Bicycle
0.1%
0.1%
Bus
1.2%
0.3%
Carpooled
8.7%
8.1%
Car alone
86.2%
89.9%
Railroad
0.4%
0%
Taxicab
0.2%
0.2%
Walked
1.5%
1.1%
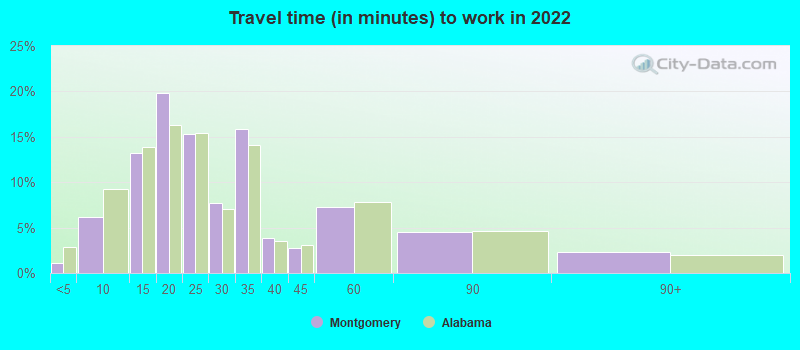
Average travel time to work
Type
Charlotte
Montgomery
Average
29.6 min
26.5 min
Other means
24.9 min
19.9 min
Public transportation
44.1 min
31.7 min
Private vehicle occupancy
Type
Charlotte
Montgomery
Average
1.2
1.1
Drove alone
90%
90.3%
In 2 person carpool
6.9%
7.7%
In 3 person carpool
1.8%
1.1%
In 4 person carpool
0.8%
0.4%
In 5-6 person carpool
0.5%
0.1%
In 7+ person carpool
0.1%
0.3%
How many people usually rode to work in the car, truck or van.
Real Estate
Charlotte's real estate market is more pricey than Montgomery's. However, it offers a wide range of options from downtown condos to expansive suburban homes. In contrast, Montgomery's real estate market is more affordable, with the majority of homes being single-family units in suburban areas.
Neighborhoods
Both cities offer a variety of neighborhoods that cater to various lifestyles. Charlotte has upscale areas like Myers Park and hip locales like Plaza Midwood. In Montgomery, the Cloverdale area offers a historic charm, while East Montgomery provides newer, suburban comforts.
Houses and residents
Type
Charlotte
Montgomery
Houses
393,631
93,055
Average household size (people)
2.5
2.4
Median year apartment built
1998
1981
Median year house/condo built
1993
1979
Length of stay in the house since moving in
11.8 years
14.9 years
Houses occupied
365,269 (92.8%)
81,529 (87.6%)
Houses occupied by owners
193,930 (53.1%)
45,969 (56.4%)
Houses occupied by renters
171,339 (46.9%)
35,560 (43.6%)
Median rent asked for vacant for-rent units
$1,482
$1,021
Median monthly housing costs
$1,302
$926
Median price asked for vacant for-sale houses and condos
$445,491
$177,602
Estimated median house or condo value
$321,400
$136,800
Median numbers of rooms
5.3
5.7
Median number of rooms in apartments
4
4.4
Median number of rooms in houses and condos
6.6
6.7
Median house price - detached houses
$388,029
$182,881
Median house price - in 2-unit structures
$184,325
$83,037
Median house price - in 3-to-4-unit structures
$178,624
$87,195
Median house price - in 5 or more unit structures
$433,957
$55,784
Median house price - mobile homes
$52,977
$154,829
Median house price - Townhouses or other attached units
$296,370
$110,664
Median house price - All housing units
$378,423
$179,453
Median house age
26
43
Renting percentage
42.6%
41.1%
Housing density (houses/condos per square mile)
1,624.8
598.9
House value disparities
33.3%
41.3%
Household income disparities
44.1%
46.9%
Median household income for houses/condes with a mortgage
$105,905
$69,253
Median household income for apartments without a mortgage
$70,681
$43,782
Housing units without a mortgage
3,089 (2.1%)
462 (1.6%)
Housing units with both a second mortgage and home equity loan
10,553 (7.2%)
1,755 (6.1%)
Housing units with a mortgage
142,912 (97.9%)
28,109 (98.4%)
Housing units with a home equity loan
171 (0.1%)
309 (1.1%)
Housing units with a second mortgage
13,532 (9.3%)
2,440 (8.5%)
House/condo owner moved in on average (years ago)
9
14
House/condo renter moved in on average (years ago)
1
1
Housing units lacking complete kitchen facilities
0.8%
4%
Housing units lacking complete plumbing facilities
0.2%
3.7%
Housing units in structures
Housing units in structures
Charlotte
Montgomery
One, detached
52.7%
70.2%
One, attached
9.1%
3.4%
Two
0.9%
0.9%
3 or 4
2.9%
4.3%
5 to 9
7.1%
8.7%
10 to 19
9.5%
7.0%
20 to 49
6.2%
1.1%
50 or more
10.3%
2.0%
Mobile homes
1.4%
2.4%
Median real estate property taxes paid for housing units
Self-employed workers in own not incorporated business
25,780
4,332
State government workers
16,519
6,387
Unpaid family workers
1,214
0
Industries and Occupations
Banking, healthcare, and aviation dominate Charlotte's economic scene. Montgomery, though smaller, has a diverse economy with a mix of healthcare, government, education, and manufacturing jobs.
Both cities have established healthcare facilities. Charlotte is known better in this respect due to larger facilities like the Atrium Health Carolinas Medical Center. Montgomery residents primarily rely on Baptist Health and Jackson Hospital.
Health (county statistics)
Type
Charlotte
Montgomery
General health status score of residents in this county from 1 (poor) to 5 (excellent)
Compared to Montgomery, Charlotte boasts a robust and modern infrastructure, with an impressive skyline, well-maintained roads, and an expanding light rail system. Montgomery has less urban development and more modest growth but maintains a neat, clean, and leafy cityscape.
Infrastructure
Type
Charlotte
Montgomery
Hospitals
37
14
TV stations
16
11
Arenas or stadiums
3
2
Bank branches located here
202
69
Bank institutions located here
26
18
Main business address for public companies
33
3
Nuclear power plants nearby
2
0
Drinking water stations with no reported violations in the past
24
3
Drinking water stations with reported violations in the past
HMDA - Conventional home purchase loans - Applications denied
Year
Charlotte
Montgomery
1999
3,049
1,463
2000
1,568
832
2001
1,382
509
2002
1,275
393
2003
1,879
393
2004
2,415
529
2005
3,078
779
2006
3,864
694
2007
3,106
538
2008
1,287
243
2009
617
100
Culture and Food
Both cities offer lively cultural scenes with art galleries, museums, and live music. Southern cuisine dominates in both cities, but Charlotte's larger size offers a more diverse culinary scene, including high-end dining options.
Sports Teams
For sports enthusiasts, Charlotte has more to offer with professional teams like the Carolina Panthers (NFL) and Charlotte Hornets (NBA). Montgomery hosts minor league baseball team Montgomery Biscuits.


 Charlotte, NC
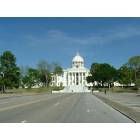
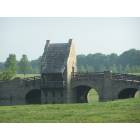
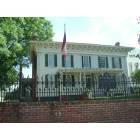
 Montgomery, AL