Charlotte, NC, and Port St. Lucie, FL, offer different lifestyles, amenities, and opportunities. Charlotte is a bustling, vibrant city with a diverse economy, while Port St. Lucie is a more relaxed, coastal city known for its beautiful golf courses and excellent fishing. Each city is known for its unique advantages and interests. Whether the decision is based on the weather, cost of living, or employment opportunities, choosing between the two greatly depends on personal preferences.
Distance between
Charlotte, NC and
Port St. Lucie, FL : 548.7 miles
Charlotte's population is larger by 304%. Its population has grown by 338,881 people (62.7%) since 2000. The population of Port St. Lucie has grown by 128,754 people (145.0%) during that time.
Charlotte and Port St. Lucie vary in terms of safety. Charlotte's crime rate is higher than the national average, but it varies significantly across neighborhoods. Some areas are very safe, while others have higher crime rates. On the other hand, Port St. Lucie is known as one of Florida's safest cities, with a crime rate significantly lower than the national average. Tourists and residents alike appreciate the general feeling of safety in this city.
Cost of Living
The cost of living in Charlotte is slightly above the national average, primarily due to housing costs. Despite this, it's still more affordable than many other major US cities. Contrastingly, the cost of living in Port St. Lucie is below the national average, making it an attractive option for retirees and families looking for affordable housing and living expenses.
Income Tax
North Carolina imposes a flat income tax rate of 5.25%. In contrast, Florida, including Port St. Lucie, has no state income tax, which can be a significant advantage for residents.
Property Tax
Charlotte has a relatively high property tax compared to the national average, while Port St. Lucie has lower property tax rates, which can be especially appealing for homeowners.
Sales Tax
North Carolina has a 4.75% statewide sales tax with additional county taxes, making Charlotte's total sales tax around 7.25%. Florida has a 6% state sales tax, and Port St. Lucie has an additional 1% local sales tax, making its total sales tax roughly 7%.
Income
Type
Charlotte
Port St. Lucie
Estimated median household income
$70,869
$71,381
Estimated per capita income
$44,593
$32,151
Cost of living index (U.S. average is 100)
93.2
90.4
If you make $50,000 in Port St. Lucie, you will have to make $51,549 in Charlotte to maintain the same standard of living.
Geographical Conditions
Charlotte is located inland, a few hours drive away from both the beaches and mountains. It offers scenic parks and greenways for outdoor exploration. Port St. Lucie is along the Atlantic Ocean, providing ample opportunities for water sports, fishing, and beach activities.
Both cities pride themselves in their educational opportunities. Charlotte is home to several high-ranking public and private schools, along with notable higher-education institutions like UNC Charlotte. Port St. Lucie also has a range of good schools and is close to several colleges and universities, including Florida Atlantic University and Indian River State College.
Charlotte's economy is diverse and strong in sectors like banking and financial services, health care, and energy. On the other hand, Port St. Lucie's economy is driven by retail, health care, education, and tourism. While Charlotte offers more opportunities, the lower cost of living in Port St. Lucie may balance the scale.
Biggest Employers
In Charlotte, some of the biggest employers are Atrium Health, Wells Fargo, and American Airlines. In contrast, Port St. Lucie’s largest employers include the City of Port St. Lucie, St. Lucie Public Schools, and Tradition Medical Center.
In Charlotte (Mecklenburg County), 60.8% voted for Democrats and 38.3% for Republicans in 2012 Presidential Election. In Port St. Lucie (St. Lucie County), 53.7% voted for Democrats and 45.8% for Republicans.
Elections
Type
Democrats
Republicans
Other
Year
Charlotte
Port St. Lucie
Charlotte
Port St. Lucie
Charlotte
Port St. Lucie
2020
66.8%
49.0%
31.6%
50.6%
1.6%
0.4%
2016
62.3%
47.2%
32.9%
49.6%
4.8%
3.2%
2012
60.8%
53.7%
38.3%
45.8%
0.9%
0.4%
2008
62.0%
55.7%
37.6%
43.6%
0.5%
0.7%
2004
51.7%
51.9%
48.0%
47.7%
0.3%
0.4%
2000
48.4%
53.5%
51.1%
44.7%
0.5%
1.8%
1996
48.6%
48.9%
45.9%
39.1%
5.5%
12.0%
Breakdown of population affiliated with a religious congregation
Type
Adherents
Congregations
Religion
Charlotte
Port St. Lucie
Charlotte
Port St. Lucie
SOUTHERN BAPTIST CONVENTION
9.0%
3.2%
19.0%
18.8%
CATHOLIC CHURCH
8.5%
12.2%
1.8%
3.8%
AMERICAN BAPTIST CHURCHES IN THE USA
2.3%
0.0%
1.1%
0.0%
EPISCOPAL CHURCH
1.2%
0.5%
1.3%
1.9%
EVANGELICAL LUTHERAN CHURCH IN AMERICA
0.9%
0.3%
1.8%
1.9%
PRESBYTERIAN CHURCH IN AMERICA
0.6%
0.0%
1.9%
0.5%
SEVENTH DAY ADVENTIST CHURCH
0.5%
0.8%
1.5%
3.8%
MUSLIM ESTIMATE
0.3%
0.6%
1.2%
0.9%
VINEYARD USA
0.0%
0.4%
0.1%
0.9%
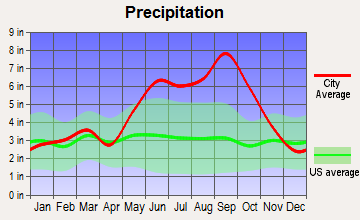
Weather
When it comes to weather, these two cities couldn't be more different. Charlotte enjoys all four seasons with hot summers and cool winters with occasional snow. On the other hand, Port St. Lucie boasts a tropical climate with warm winters and hot, humid summers - an ideal destination for those who love year-round sunshine and beach opportunities.
Weather and climate
Type
Charlotte
Port St. Lucie
Temperature - Average
61°F
73.3°F
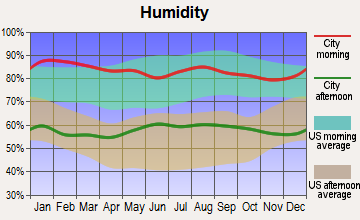
Humidity - Average morning or afternoon humidity
72.3%
79%
Humidity - Differences between morning and afternoon humidity
41%
32.8%
Humidity - Maximum monthly morning or afternoon humidity
87%
87.8%
Humidity - Minimum monthly morning or afternoon humidity
46%
54.9%
Precipitation - Yearly average
44.5 in
55.8 in
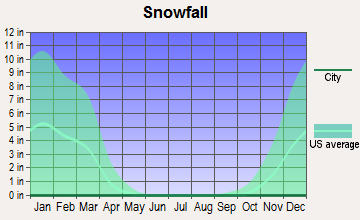
Snowfall - Yearly average
10.2 in
0 in
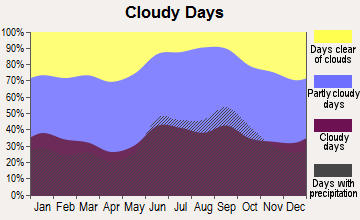
Clouds - Number of days clear of clouds
18.1%
13%
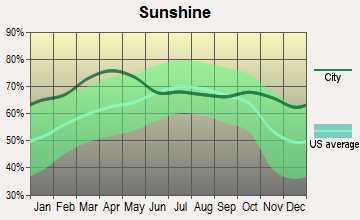
Sunshine amount - Average
69.8%
76.2%
Sunshine amount - Differences during a year
14%
15.1%
Sunshine amount - Maximum monthly
70%
79.6%
Sunshine amount - Minimum monthly
56%
64.5%
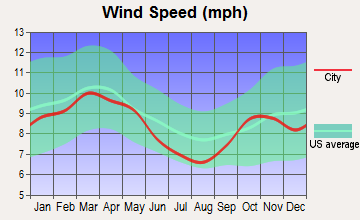
Wind speed - Average
6.9 mph
9 mph
Average climate in Charlotte, North Carolina
Average climate in Port St. Lucie, Florida
Air pollution
Type
AQI
CO
NO2
OZONE
PB
PM10
PM25
SO2
Year
Charlotte
Port St. Lucie
Charlotte
Charlotte
Charlotte
Port St. Lucie
Charlotte
Charlotte
Port St. Lucie
Charlotte
Port St. Lucie
Charlotte
2018
75
58
0.24
N/A
6.3
N/A
27.8
28.8
N/A
N/A
15.5
N/A
8.2
7.8
0.2
N/A
2017
77
62
0.25
N/A
7.0
N/A
28.0
27.5
N/A
N/A
16.3
N/A
8.8
7.9
0.2
N/A
2016
82
57
0.25
N/A
7.6
N/A
28.7
29.1
N/A
N/A
N/A
N/A
8.4
7.4
0.2
N/A
2015
76
59
0.25
N/A
8.1
N/A
27.6
27.1
N/A
N/A
N/A
N/A
8.6
7.5
0.2
N/A
2014
76
60
0.26
N/A
8.5
N/A
26.3
28.1
N/A
N/A
N/A
N/A
9.3
7.6
0.3
N/A
2013
71
56
0.29
N/A
8.4
N/A
25.5
N/A
N/A
N/A
N/A
N/A
8.6
7.8
0.3
N/A
2012
95
65
0.28
N/A
8.7
N/A
27.3
29.8
N/A
N/A
N/A
N/A
9.7
8.7
0.3
N/A
2011
94
63
0.34
N/A
10.1
N/A
28.9
30.2
N/A
N/A
N/A
N/A
11.2
9.1
0.6
N/A
2010
97
60
0.33
N/A
11.8
N/A
28.0
27.4
N/A
N/A
N/A
N/A
11.6
8.9
1.0
N/A
2009
82
57
0.30
N/A
10.0
N/A
25.4
N/A
N/A
N/A
N/A
N/A
11.1
8.8
0.9
N/A
2008
102
72
0.32
N/A
11.2
N/A
27.6
N/A
N/A
N/A
N/A
N/A
13.0
9.4
2.1
N/A
2007
108
76
0.37
N/A
13.9
N/A
29.1
N/A
0.001
N/A
N/A
N/A
14.5
9.7
3.0
N/A
2006
107
70
0.44
N/A
13.9
N/A
27.3
N/A
0.000
N/A
N/A
N/A
14.8
10.5
3.3
N/A
2005
109
76
0.53
N/A
14.6
N/A
30.6
N/A
0.000
N/A
N/A
N/A
15.2
10.5
2.7
N/A
2004
89
N/A
0.53
N/A
14.6
N/A
28.9
N/A
0.001
N/A
N/A
N/A
N/A
N/A
2.8
N/A
2003
85
35
0.57
N/A
15.6
N/A
27.6
N/A
0.003
N/A
N/A
18.9
N/A
N/A
3.0
N/A
2002
103
N/A
0.63
N/A
15.3
N/A
32.6
N/A
0.003
N/A
N/A
N/A
N/A
N/A
2.7
N/A
2001
108
N/A
0.72
N/A
17.5
N/A
32.3
N/A
0.005
N/A
N/A
N/A
N/A
N/A
3.9
N/A
2000
107
N/A
0.79
N/A
18.0
N/A
32.6
N/A
0.014
N/A
N/A
N/A
N/A
N/A
4.4
N/A
Natural disasters
Type
Charlotte
Port St. Lucie
Tornado activity compared to U.S. average
111.5%
68.7%
Earthquake activity compared to U.S. average
79%
7.1%
Natural disasters compared to U.S. average
9%
5%
Transportation
Charlotte offers a range of public transit options, including buses, light rail, and streetcars, making commuting easier. On the other hand, Port St. Lucie is more car-centric due to its sprawled layout. However, it does offer bus services for local travel.
Transport
Type
Charlotte
Port St. Lucie
Amtrak stations
1
0
Amtrak stations nearby
2
0
FAA registered aircraft
439
0
FAA registered aircraft manufacturers and dealers
12
0
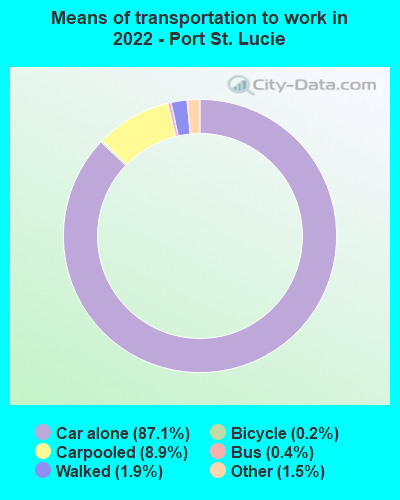
Means of transportation to work
Type
Charlotte
Port St. Lucie
Bicycle
0.1%
0.5%
Bus
1.2%
0.3%
Carpooled
8.7%
9.2%
Car alone
86.2%
86.5%
Motorcycle
0.1%
0.4%
Railroad
0.4%
0%
Subway
0%
0.1%
Taxicab
0.2%
0.1%
Walked
1.5%
2.3%
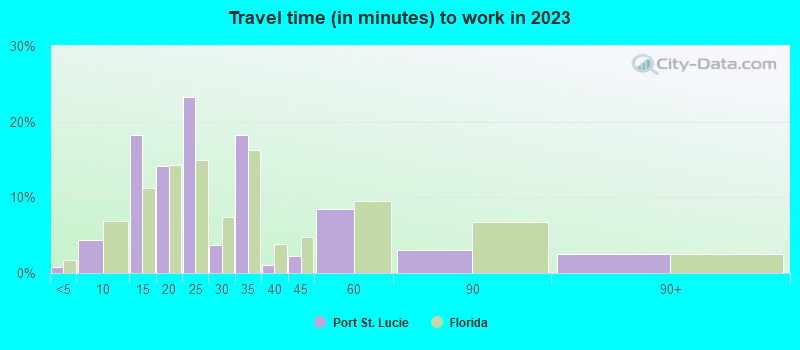
Average travel time to work
Type
Charlotte
Port St. Lucie
Average
29.6 min
24.7 min
Other means
24.9 min
27.8 min
Public transportation
44.1 min
38.7 min
Private vehicle occupancy
Type
Charlotte
Port St. Lucie
Average
1.2
1.1
Drove alone
90%
90.9%
In 2 person carpool
6.9%
7.5%
In 3 person carpool
1.8%
1.1%
In 4 person carpool
0.8%
0.2%
In 5-6 person carpool
0.5%
0.2%
How many people usually rode to work in the car, truck or van.
Real Estate
Real estate in Charlotte tends to be more expensive than in Port St. Lucie. Charlotte offers a robust housing market with a variety of property types, from urban apartments to suburban homes. Port St. Lucie is known for affordable housing, especially for waterfront properties.
Neighborhoods
Charlotte has a mix of urban and suburban neighborhoods, each with its unique character. NoDa is loved for its art scene and funky vibe, while SouthPark offers upscale shopping and dining. Port St. Lucie has a more relaxed, residential feel with many neighborhoods centered around golf courses and waterways.
Houses and residents
Type
Charlotte
Port St. Lucie
Houses
393,631
84,820
Average household size (people)
2.5
2.7
Median year apartment built
1998
1991
Median year house/condo built
1993
2001
Length of stay in the house since moving in
11.8 years
9 years
Houses occupied
365,269 (92.8%)
77,190 (91%)
Houses occupied by owners
193,930 (53.1%)
64,490 (83.5%)
Houses occupied by renters
171,339 (46.9%)
12,700 (16.5%)
Median rent asked for vacant for-rent units
$1,482
$1,050
Median monthly housing costs
$1,302
$1,313
Median price asked for vacant for-sale houses and condos
$445,491
$351,065
Estimated median house or condo value
$321,400
$284,800
Median numbers of rooms
5.3
6.4
Median number of rooms in apartments
4
5.8
Median number of rooms in houses and condos
6.6
6.5
Median house price - detached houses
$388,029
$290,278
Median house price - in 2-unit structures
$184,325
$134,121
Median house price - in 3-to-4-unit structures
$178,624
$127,555
Median house price - in 5 or more unit structures
$433,957
$271,458
Median house price - mobile homes
$52,977
$41,584
Median house price - Townhouses or other attached units
$296,370
$264,738
Median house price - All housing units
$378,423
$282,471
Median house age
26
21
Renting percentage
42.6%
21.9%
Housing density (houses/condos per square mile)
1,624.8
1,122.8
House value disparities
33.3%
22.6%
Household income disparities
44.1%
36.3%
Median household income for houses/condes with a mortgage
$105,905
$84,195
Median household income for apartments without a mortgage
$70,681
$68,067
Housing units without a mortgage
3,089 (2.1%)
1,140 (2.7%)
Housing units with both a second mortgage and home equity loan
10,553 (7.2%)
1,332 (3.2%)
Housing units with a mortgage
142,912 (97.9%)
40,853 (97.3%)
Housing units with a home equity loan
171 (0.1%)
0 (0%)
Housing units with a second mortgage
13,532 (9.3%)
1,459 (3.5%)
House/condo owner moved in on average (years ago)
9
6
House/condo renter moved in on average (years ago)
1
2
Housing units lacking complete kitchen facilities
0.8%
0.8%
Housing units lacking complete plumbing facilities
0.2%
0.8%
Housing units in structures
Housing units in structures
Charlotte
Port St. Lucie
One, detached
52.7%
87.8%
One, attached
9.1%
3.2%
Two
0.9%
0.5%
3 or 4
2.9%
2.0%
5 to 9
7.1%
1.2%
10 to 19
9.5%
1.8%
20 to 49
6.2%
1.3%
50 or more
10.3%
0.9%
Mobile homes
1.4%
1.2%
Median real estate property taxes paid for housing units
Self-employed workers in own not incorporated business
25,780
8,105
State government workers
16,519
1,390
Unpaid family workers
1,214
276
Industries and Occupations
Charlotte is a hub for major banks, including Bank of America and Wells Fargo, making finance a dominant industry. Healthcare, retail, and manufacturing are also prominent. In Port St. Lucie, healthcare and retail lead, with a steady tourism industry significantly impacting the local economy.
Both cities offer excellent health care facilities. Charlotte has multiple top-notch hospitals, including Atrium Health’s Carolinas Medical Center. Port St. Lucie is home to Tradition Medical Center, part of the highly rated Martin Health System.
Health (county statistics)
Type
Charlotte
Port St. Lucie
General health status score of residents in this county from 1 (poor) to 5 (excellent)
Charlotte's infrastructure is modern and developed, with significant investments in public transportation and roads. Port St. Lucie, less urbanized, relies more on road networks, with a greater need for personal transportation.
Infrastructure
Type
Charlotte
Port St. Lucie
TV stations
16
16
Bank branches located here
202
6
Bank institutions located here
26
4
Nuclear power plants nearby
2
2
Drinking water stations with no reported violations in the past
24
1
Drinking water stations with reported violations in the past
HMDA - Conventional home purchase loans - Applications denied
Year
Charlotte
Port St. Lucie
1999
3,049
260
2000
1,568
167
2001
1,382
166
2002
1,275
179
2003
1,879
763
2004
2,415
1,245
2005
3,078
2,255
2006
3,864
2,306
2007
3,106
1,132
2008
1,287
387
2009
617
201
Culture and Food
Charlotte is known for its southern charm, mixed with a cosmopolitan culture. It has a lively arts scene, rich history, and delicious cuisine, from world-class BBQ to global delicacies. Port St. Lucie offers a more laid-back lifestyle with a touch of Florida's diverse cultures. Seafood reigns supreme here, but there's a variety of other cuisines too.
Sports Teams
Sports fans will be pleased in both cities. Charlotte is home to the NFL’s Panthers, the NBA’s Hornets and NASCAR’s Hall of Fame. Meanwhile, Port St. Lucie hosts the New York Mets for spring training and has a minor league baseball team, the St. Lucie Mets.


 Charlotte, NC
 Port St. Lucie, FL