Pittsburgh, PA, and Columbus, OH are two dynamic cities in the United States' Midwest, each with unique offerings, varied lifestyles, and distinct atmospheres. While Columbus has a robust economy driven by education, finance, and healthcare, Pittsburgh has a venerable industrial legacy underpinning today's diverse, knowledge-based economy. A comparison of these cities across various dimensions provides an in-depth insight into the lifestyle, opportunities, and amenities each has to offer.
Distance between
Columbus, OH and
Pittsburgh, PA : 162.0 miles
Columbus's population is larger by 202%. Its population has grown by 195,058 people (27.4%) since 2000. The population of Pittsburgh has decreased by 34,132 people (10.2%) during that time.
Both Pittsburgh and Columbus share similar crime rates, with crime in Columbus being slightly higher than the national average. Pittsburgh, on the other hand, has a crime rate near the national average. Both cities prioritize public safety, with significant investments in police and fire services. However, safety can vary by neighborhood. Downtown areas tend to be safer in both cities, while some neighborhoods may have higher crime rates.
City-data.com crime index counts serious crimes and violent crime more heavily. It adjusts for the number of visitors and daily workers commuting into cities. (higher means more crime, U.S. average = 301.1)
City-data.com crime index counts serious crimes and violent crime more heavily. It adjusts for the number of visitors and daily workers commuting into cities. (higher means more crime, U.S. average = 301.1)
Sex Offenders
According to our data, there are 1,506 registered sex offenders living in Columbus and 699 registered sex offenders living in . The ratio of residents to sex offenders in Columbus is 573 to 1; the ratio in Pittsburgh is 434 to 1. The number of registered sex offenders compared to the number of residents is a smaller in Columbus than in Pittsburgh.
Cost of Living
The cost of living in Columbus is lower than the national average and significantly lower than in Pittsburgh. Housing is more affordable in Columbus, making it an attractive destination for those looking to relocate. Pittsburgh's cost of living, while still below the national average, is more expensive than Columbus.
Income Tax
Ohio imposes a progressive income tax, where rates range from 0% to 4.797%. Pennsylvania, however, imposes a flat tax rate of 3.07% on all income.
Property Tax
Property taxes in Pittsburgh tend to be higher than in Columbus. Pennsylvania generally has higher property tax rates than Ohio, which can impact the long-term cost of home ownership.
Sales Tax
The sales tax in Columbus, OH is currently 7.50%, while Pittsburgh, PA has a sales tax of 7%. On a state level, Ohio has a slightly higher sales tax rate than Pennsylvania.
Income
Type
Columbus
Pittsburgh
Estimated median household income
$58,202
$57,821
Estimated per capita income
$32,392
$39,779
Cost of living index (U.S. average is 100)
96.1
95.2
If you make $50,000 in Pittsburgh, you will have to make $50,473 in Columbus to maintain the same standard of living.
Geographical Conditions
Columbus is located on mostly flat terrain in the Great Plains, while Pittsburgh is nestled in the Appalachian Mountains, where the Allegheny and Monongahela rivers meet to form the Ohio River. The differing geographies each offer unique recreational opportunities.
Both cities are home to renowned higher education institutions. Columbus is home to The Ohio State University, one of the largest and most prestigious universities in the U.S. Pittsburgh houses the University of Pittsburgh and Carnegie Mellon University, known for its robust research programs. Both cities boast quality public and private K-12 school systems, although school quality can vary by neighborhood.
Columbus enjoys a diverse economy driven by education, government, insurance, banking, technology, and healthcare. Pittsburgh, rich in industrial history, now boasts a diverse, knowledge-based economy, with education, health care, and technology sectors leading the way. Pittsburgh has been recognized as a city of innovation, while Columbus is praised for its economic stability and growth potential.
Biggest Employers
In Columbus, the biggest employers are The Ohio State University, Wexner Medical Center, and JPMorgan Chase. Pittsburgh's largest employers include the University of Pittsburgh Medical Center, Highmark Health, and PNC Financial Services.
There were 913 building permits issued in Columbus in 2012 (246 more than in 2011) compared to 198 building permits issued in Pittsburgh in 2012 (86 less than in 2011).
In Columbus (Franklin County), 60.8% voted for Democrats and 37.9% for Republicans in 2012 Presidential Election. In Pittsburgh (Allegheny County), 56.5% voted for Democrats and 42.0% for Republicans.
Elections
Type
Democrats
Republicans
Other
Year
Columbus
Pittsburgh
Columbus
Pittsburgh
Columbus
Pittsburgh
2020
64.7%
59.4%
33.4%
39.0%
1.9%
1.5%
2016
59.8%
55.9%
33.9%
39.5%
6.2%
4.6%
2012
60.8%
56.5%
37.9%
42.0%
1.3%
1.5%
2008
59.8%
57.1%
39.0%
41.7%
1.2%
1.2%
2004
54.5%
57.2%
45.2%
42.2%
0.3%
0.6%
2000
48.9%
56.6%
47.9%
40.4%
3.2%
2.9%
1996
48.1%
52.8%
44.5%
37.9%
7.3%
9.3%
Breakdown of population affiliated with a religious congregation
Type
Adherents
Congregations
Religion
Columbus
Pittsburgh
Columbus
Pittsburgh
CATHOLIC CHURCH
13.2%
37.7%
5.6%
15.6%
EVANGELICAL LUTHERAN CHURCH IN AMERICA
1.6%
2.0%
3.7%
6.7%
SOUTHERN BAPTIST CONVENTION
1.6%
0.2%
6.8%
2.8%
MUSLIM ESTIMATE
1.3%
0.5%
1.9%
0.9%
VINEYARD USA
1.3%
0.0%
1.2%
0.2%
AMERICAN BAPTIST CHURCHES IN THE USA
1.0%
1.4%
3.3%
3.7%
EPISCOPAL CHURCH
0.4%
0.6%
1.3%
1.7%
SEVENTH DAY ADVENTIST CHURCH
0.4%
0.2%
2.0%
0.5%
LUTHERAN CHURCH
0.2%
0.3%
1.0%
1.8%
SALVATION ARMY
0.1%
0.3%
0.4%
0.8%
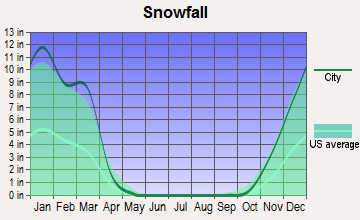
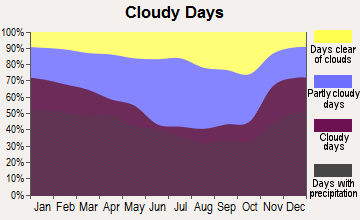
Weather
Columbus experiences all four seasons, with hot summers and cold winters. The city can also experience severe weather, including thunderstorms and occasional tornadoes. Pittsburgh's weather is similar, with distinct seasons and a slightly cooler overall temperature due to its northern location. Both cities experience snow in winter months, which can affect commuting and outdoor activities.
Weather and climate
Type
Columbus
Pittsburgh
Temperature - Average
52.8°F
51.3°F
Humidity - Average morning or afternoon humidity
74.8%
73.7%
Humidity - Differences between morning and afternoon humidity
34%
36%
Humidity - Maximum monthly morning or afternoon humidity
86%
86%
Humidity - Minimum monthly morning or afternoon humidity
52%
50%
Precipitation - Yearly average
39.3 in
38.6 in
Snowfall - Yearly average
56.6 in
87.7 in
Clouds - Number of days clear of clouds
12%
9.8%
Sunshine amount - Average
49.7%
46%
Sunshine amount - Differences during a year
27%
31%
Sunshine amount - Maximum monthly
55%
54%
Sunshine amount - Minimum monthly
28%
23%
Wind speed - Average
8.2 mph
8.5 mph
Average climate in Columbus, Ohio
Average climate in Pittsburgh, Pennsylvania
Air pollution
Type
AQI
CO
NO2
OZONE
PB
PM10
PM25
SO2
Year
Columbus
Pittsburgh
Columbus
Pittsburgh
Columbus
Pittsburgh
Columbus
Pittsburgh
Pittsburgh
Columbus
Pittsburgh
Columbus
Pittsburgh
Columbus
Pittsburgh
2018
69
105
0.11
0.26
10.0
5.7
33.8
24.7
N/A
N/A
N/A
15.1
6.0
11.8
0.0
0.6
2017
68
102
0.16
0.25
9.6
5.7
28.7
26.2
N/A
N/A
N/A
16.4
5.5
9.5
0.1
0.6
2016
76
100
0.17
0.27
10.6
6.5
28.5
25.9
0.002
N/A
N/A
15.6
5.6
10.4
0.1
0.7
2015
74
110
0.16
0.26
11.3
7.5
27.0
24.8
0.007
N/A
N/A
18.6
6.1
11.0
0.1
1.0
2014
82
107
0.20
0.30
11.0
9.3
28.5
23.1
0.042
N/A
N/A
18.1
7.4
10.4
0.5
1.2
2013
78
99
N/A
0.27
8.9
10.8
29.6
25.1
0.164
N/A
N/A
16.6
7.8
10.3
0.6
2.4
2012
87
120
N/A
0.33
N/A
13.0
32.9
25.4
N/A
N/A
N/A
19.5
8.9
10.3
N/A
2.5
2011
89
118
N/A
0.29
N/A
13.3
28.1
24.5
N/A
N/A
N/A
16.6
8.9
12.2
N/A
2.6
2010
90
151
N/A
0.37
N/A
13.6
30.5
24.5
N/A
N/A
N/A
20.2
9.1
12.1
N/A
5.0
2009
61
129
N/A
0.23
N/A
12.9
28.7
23.0
0.017
N/A
N/A
18.5
N/A
14.9
N/A
4.0
2008
65
135
N/A
0.26
N/A
16.1
31.2
22.3
0.017
N/A
N/A
20.6
N/A
16.7
1.8
4.8
2007
80
140
N/A
0.39
N/A
15.6
30.8
22.8
0.010
N/A
N/A
21.7
N/A
19.0
2.8
5.9
2006
75
149
N/A
0.35
N/A
16.2
30.0
20.2
0.028
N/A
23.7
19.3
N/A
16.1
3.3
6.6
2005
87
107
N/A
0.33
N/A
19.1
29.6
20.0
0.031
N/A
27.5
20.9
N/A
N/A
4.1
7.4
2004
77
93
N/A
0.41
N/A
18.9
27.8
19.7
0.019
N/A
24.6
21.0
N/A
N/A
4.4
6.6
2003
91
102
N/A
0.36
N/A
19.6
26.4
21.3
0.032
N/A
23.9
21.3
N/A
N/A
4.1
8.7
2002
93
111
N/A
0.32
N/A
20.1
31.3
21.7
0.017
N/A
25.7
20.2
N/A
N/A
4.1
9.2
2001
84
107
N/A
0.60
N/A
21.2
29.2
21.1
0.017
N/A
25.9
26.0
N/A
N/A
3.5
8.5
2000
57
102
N/A
0.62
N/A
22.0
N/A
19.8
0.016
N/A
23.5
22.8
N/A
N/A
3.7
9.1
Natural disasters
Type
Columbus
Pittsburgh
Tornado activity compared to U.S. average
119.1%
80.2%
Earthquake activity compared to U.S. average
96.1%
44.6%
Natural disasters compared to U.S. average
16%
15%
Transportation
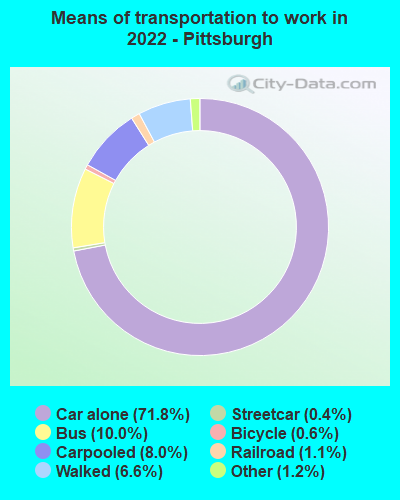
Both cities have robust public transit systems. Columbus's COTA and Pittsburgh's PAT provide comprehensive bus networks. However, Pittsburgh also has a light rail "T" system and a unique incline service. Both cities have bike-sharing programs, but commuting by car is common in both locations.
Transport
Type
Columbus
Pittsburgh
Amtrak stations
1
1
Amtrak stations nearby
1
1
FAA registered aircraft
415
233
FAA registered aircraft manufacturers and dealers
4
3
Means of transportation to work
Type
Columbus
Pittsburgh
Bicycle
0.6%
0.8%
Bus
1.6%
9.3%
Carpooled
7.4%
7.4%
Car alone
86.7%
74%
Railroad
0%
0.7%
Streetcar
0%
0.6%
Taxicab
0.1%
0.1%
Walked
2.2%
4.8%
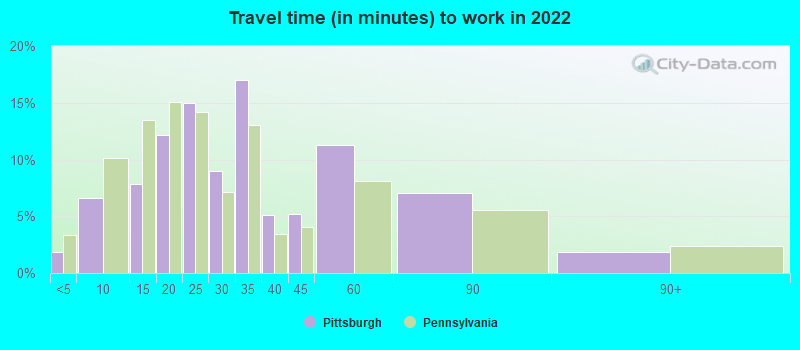
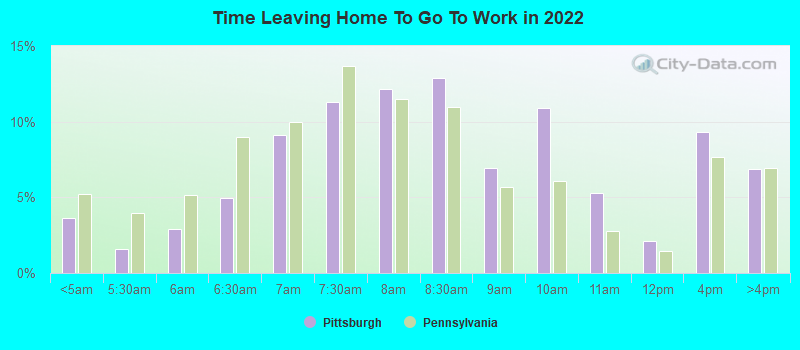
Average travel time to work
Type
Columbus
Pittsburgh
Average
26.1 min
31 min
Other means
21.7 min
21.6 min
Public transportation
35.4 min
33.4 min
Private vehicle occupancy
Type
Columbus
Pittsburgh
Average
1.1
1.1
Drove alone
90.7%
90.3%
In 2 person carpool
7.3%
8%
In 3 person carpool
1.4%
0.8%
In 4 person carpool
0.5%
0.5%
In 7+ person carpool
0.1%
0.3%
How many people usually rode to work in the car, truck or van.
Real Estate
Real estate in Columbus is significantly more affordable than in Pittsburgh. The average home price is lower in Columbus, making it an appealing destination for first-time homebuyers and investors. In contrast, Pittsburgh's real estate market is more competitive, with higher property costs.
Neighborhoods
Both cities have a variety of neighborhoods that offer unique lifestyles. Columbus's neighborhoods like German Village and Short North are popular for their historic charm and proximity to downtown. Pittsburgh's neighborhoods like Shadyside and Lawrenceville are known for their eclectic mix of old and new, from historic homes to modern condos.
Houses and residents
Type
Columbus
Pittsburgh
Houses
422,120
159,435
Average household size (people)
2.3
2.1
Median year apartment built
1982
1954
Length of stay in the house since moving in
12.6 years
16.4 years
Houses occupied
390,605 (92.5%)
136,747 (85.8%)
Houses occupied by owners
175,427 (44.9%)
66,729 (48.8%)
Houses occupied by renters
215,178 (55.1%)
70,018 (51.2%)
Median rent asked for vacant for-rent units
$1,371
$1,381
Median monthly housing costs
$1,110
$985
Median price asked for vacant for-sale houses and condos
$195,022
$325,759
Estimated median house or condo value
$219,200
$181,100
Median numbers of rooms
5
5.2
Median number of rooms in apartments
4.2
4
Median number of rooms in houses and condos
6.3
6.3
Median house price - detached houses
$233,452
$256,260
Median house price - in 2-unit structures
$121,729
$174,463
Median house price - in 3-to-4-unit structures
$215,337
$299,629
Median house price - in 5 or more unit structures
$240,711
$310,273
Median house price - mobile homes
$121,578
$187,764
Median house price - Townhouses or other attached units
$218,726
$258,331
Median house price - All housing units
$229,736
$257,793
Median house age
42
80
Renting percentage
53%
52.4%
Housing density (houses/condos per square mile)
2,007.5
2,868.3
House value disparities
30.2%
43.1%
Household income disparities
42.4%
49.5%
Median household income for houses/condes with a mortgage
$89,058
$97,230
Median household income for apartments without a mortgage
$59,295
$58,579
Housing units without a mortgage
4,290 (3.3%)
2,260 (5.6%)
Housing units with both a second mortgage and home equity loan
10,651 (8.2%)
4,417 (11%)
Housing units with a mortgage
125,487 (96.7%)
37,784 (94.4%)
Housing units with a home equity loan
775 (0.6%)
297 (0.7%)
Housing units with a second mortgage
13,558 (10.4%)
4,975 (12.4%)
House/condo owner moved in on average (years ago)
10
15
House/condo renter moved in on average (years ago)
1
1
Housing units lacking complete kitchen facilities
1.6%
3%
Housing units lacking complete plumbing facilities
1.3%
2.8%
Housing units in structures
Housing units in structures
Columbus
Pittsburgh
One, detached
45.8%
43.7%
One, attached
9.1%
15.6%
Two
4.0%
8.9%
3 or 4
8.6%
6.2%
5 to 9
11.8%
4.8%
10 to 19
8.6%
4.3%
20 to 49
4.5%
4.3%
50 or more
6.8%
11.5%
Mobile homes
0.8%
0.6%
Boats, RVs, vans, etc.
0.1%
0.0%
Median real estate property taxes paid for housing units
Self-employed workers in own not incorporated business
20,915
5,977
State government workers
31,881
5,427
Unpaid family workers
724
73
Industries and Occupations
Columbus's leading industries are education, government, and healthcare, with large employers like The Ohio State University and the State of Ohio. The city also has a burgeoning tech scene. Pittsburgh's economy is centered around education, healthcare, technology, and finance, with large employers such as the University of Pittsburgh Medical Center and Highmark Health.
Both Columbus and Pittsburgh are known for their excellent healthcare facilities. Columbus has nationally recognized hospitals, including Ohio Health and Nationwide Children's Hospital. Pittsburgh is world-renowned for healthcare, with institutions like UPMC and Allegheny Health Network.
Health (county statistics)
Type
Columbus
Pittsburgh
General health status score of residents in this county from 1 (poor) to 5 (excellent)
Both cities have invested heavily in infrastructure. Columbus features a robust highway system and an international airport, while Pittsburgh boasts an extensive river transportation and railway network. Both cities continue to invest in infrastructure to improve commuting and facilitate business growth.
Infrastructure
Type
Columbus
Pittsburgh
Hospitals
47
41
TV stations
14
22
Arenas or stadiums
3
3
Bank branches located here
200
250
Bank institutions located here
25
27
Main business address for public companies
23
37
Drinking water stations with no reported violations in the past
17
1
Drinking water stations with reported violations in the past
HMDA - Conventional home purchase loans - Applications denied
Year
Columbus
Pittsburgh
1999
2,450
576
2000
2,376
539
2001
1,897
443
2002
1,483
378
2003
2,087
523
2004
3,216
614
2005
4,275
761
2006
4,662
807
2007
2,679
671
2008
1,015
347
2009
555
210
Culture and Food
Columbus boasts a rich culture with a thriving arts scene, numerous museums, and a variety of food options. The North Market is a must-visit culinary destination. Pittsburgh offers its own cultural allure with a strong arts community, unique neighborhoods, and diverse food scene featuring an array of cuisines from around the world.
Sports Teams
Sports fans will find plenty to root for in both cities. Columbus has teams such as the Blue Jackets (NHL), Crew SC (MLS), and Buckeyes (College). Pittsburgh is home to the Steelers (NFL), Penguins (NHL), and Pirates (MLB), with a deep-seated sports culture.


 Columbus, OH
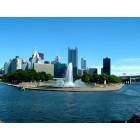
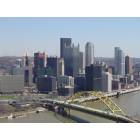
 Pittsburgh, PA