Columbus, Ohio, and Providence, Rhode Island, are two diverse cities with unique charm and growing economies. Both cities offer potential residents and visitors different experiences depending on their needs and interests. When comparing these cities, factors such as crime rates and safety, weather conditions, cost of living, and more need to be taken into account. Overall, they offer unique opportunities and challenges for both residents and tourists.
Distance between
Columbus, OH and
Providence, RI : 616.7 miles
Columbus's population is larger by 378%. Its population has grown by 195,058 people (27.4%) since 2000. The population of Providence has grown by 16,074 people (9.3%) during that time.
In terms of crime and safety, Columbus has a higher overall crime rate than Providence. However, both cities show varying crime rates across neighborhoods, with most crimes reported as property crime. When relocating, it's important to research specific neighborhoods. For tourists, both cities have popular downtown areas that are generally safe, but it's always smart to be aware of your surroundings.
City-data.com crime index counts serious crimes and violent crime more heavily. It adjusts for the number of visitors and daily workers commuting into cities. (higher means more crime, U.S. average = 301.1)
City-data.com crime index counts serious crimes and violent crime more heavily. It adjusts for the number of visitors and daily workers commuting into cities. (higher means more crime, U.S. average = 301.1)
Sex Offenders
According to our data, there are 1,506 registered sex offenders living in Columbus and 302 registered sex offenders living in . The ratio of residents to sex offenders in Columbus is 573 to 1; the ratio in Providence is 593 to 1. The number of registered sex offenders compared to the number of residents in Columbus is near to than in Providence.
Cost of Living
Cost of living is another significant factor. Columbus is generally cheaper to live in than Providence, especially in terms of housing. Other daily living costs, including groceries and utilities, are also lower in Columbus. For visitors, slightly lower costs for dining, entertainment, and accommodation can make Columbus a more affordable choice.
Income Tax
Columbus, falling in the state of Ohio, has an income tax rate of 4.797%, and the city itself has a 2.5% income tax. In Providence, the state income tax rate is around 5.99%, and there is no additional city income tax.
Property Tax
Property taxes in Providence are higher than in Columbus. In Providence, the property tax is around 1.83% of the property's market value, while Columbus's rate is generally around 1.62%.
Sales Tax
The combined city and state sales tax in Columbus is 7.50%, which is lower than Providence's combined tax rate of 7%. Remember that these taxes can impact the overall cost of living and expenses for tourists.
Income
Type
Columbus
Providence
Estimated median household income
$58,202
$60,970
Estimated per capita income
$32,392
$32,495
Cost of living index (U.S. average is 100)
96.1
93.9
If you make $50,000 in Providence, you will have to make $51,171 in Columbus to maintain the same standard of living.
Geographical Conditions
Columbus is situated in the Midwest, making it relatively flat. It's home to several parks and has a river running through it. Providence, located on the Narragansett Bay, offers coastal charm with many hills, wooded areas, and beautiful Waterfire art installations downtown.
As for education, both Columbus and Providence have good schools and well-regarded public universities — The Ohio State University in Columbus, and Brown University and the Rhode Island School of Design in Providence. In terms of school rankings and overall performance, Providence's schools tend to outperform those in Columbus.
Columbus has a diverse economy with large sectors in education, health, and finance, while Providence's economy is based largely on services, particularly healthcare and education. The unemployment rate is somewhat higher in Providence than in Columbus. Both cities offer numerous opportunities for job seekers, but the industries with the most opportunities may differ.
Biggest Employers
In Columbus, the largest employers include the State of Ohio, The Ohio State University, and Nationwide Insurance. Providence's main employers include the state of Rhode Island, Lifespan Hospital Group, and Brown University. Both cities have prominent academic and government roles in their economies.
There were 913 building permits issued in Columbus in 2012 (246 more than in 2011) compared to 1 building permits issued in Providence in 2012 (11 less than in 2011).
In Columbus (Franklin County), 60.8% voted for Democrats and 37.9% for Republicans in 2012 Presidential Election. In Providence (Providence County), 66.7% voted for Democrats and 31.7% for Republicans.
Elections
Type
Democrats
Republicans
Other
Year
Columbus
Providence
Columbus
Providence
Columbus
Providence
2020
64.7%
60.8%
33.4%
37.8%
1.9%
1.3%
2016
59.8%
57.5%
33.9%
36.6%
6.2%
5.9%
2012
60.8%
66.7%
37.9%
31.7%
1.3%
1.7%
2008
59.8%
66.2%
39.0%
32.0%
1.2%
1.7%
2004
54.5%
62.9%
45.2%
35.8%
0.3%
1.3%
2000
48.9%
65.5%
47.9%
28.2%
3.2%
6.3%
1996
48.1%
63.6%
44.5%
23.5%
7.3%
12.9%
Breakdown of population affiliated with a religious congregation
Type
Adherents
Congregations
Religion
Columbus
Providence
Columbus
Providence
CATHOLIC CHURCH
13.2%
44.0%
5.6%
23.4%
EVANGELICAL LUTHERAN CHURCH IN AMERICA
1.6%
0.2%
3.7%
1.2%
SOUTHERN BAPTIST CONVENTION
1.6%
0.0%
6.8%
1.7%
MUSLIM ESTIMATE
1.3%
0.2%
1.9%
1.2%
VINEYARD USA
1.3%
0.0%
1.2%
0.0%
AMERICAN BAPTIST CHURCHES IN THE USA
1.0%
1.5%
3.3%
10.7%
EPISCOPAL CHURCH
0.4%
1.4%
1.3%
6.3%
SEVENTH DAY ADVENTIST CHURCH
0.4%
0.3%
2.0%
3.9%
Weather
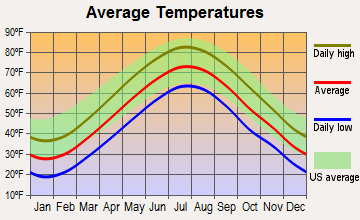
The weather in Columbus and Providence is different due to their geographical locations. Columbus experiences a humid continental climate with hot, muggy summers and cold winters. On the other hand, Providence has cold winters but its summertime weather is often more comfortable with less humidity. Visitors who prefer milder summers may enjoy Providence while those who like warmer temperatures might prefer spending summer in Columbus.
Weather and climate
Type
Columbus
Providence
Temperature - Average
52.8°F
50.7°F
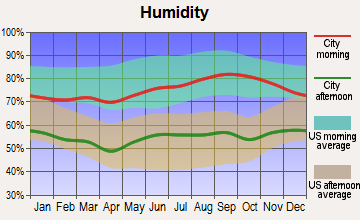
Humidity - Average morning or afternoon humidity
74.8%
70.3%
Humidity - Differences between morning and afternoon humidity
34%
33%
Humidity - Maximum monthly morning or afternoon humidity
86%
82%
Humidity - Minimum monthly morning or afternoon humidity
52%
49%
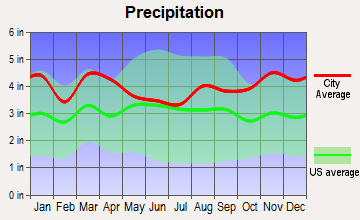
Precipitation - Yearly average
39.3 in
47.7 in
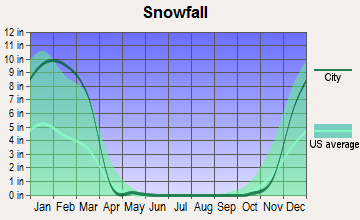
Snowfall - Yearly average
56.6 in
72.7 in
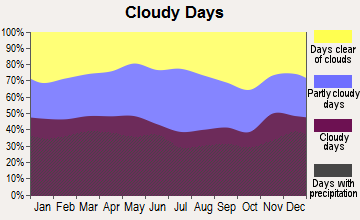
Clouds - Number of days clear of clouds
12%
16.2%
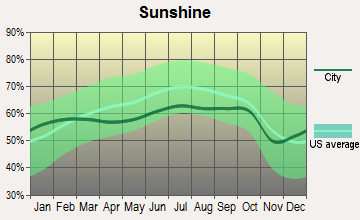
Sunshine amount - Average
49.7%
62%
Sunshine amount - Differences during a year
27%
16%
Sunshine amount - Maximum monthly
55%
64%
Sunshine amount - Minimum monthly
28%
48%
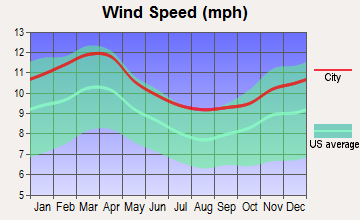
Wind speed - Average
8.2 mph
10 mph
Average climate in Columbus, Ohio
Average climate in Providence, Rhode Island
Air pollution
Type
AQI
CO
NO2
OZONE
PB
PM10
PM25
SO2
Year
Columbus
Providence
Columbus
Providence
Columbus
Providence
Columbus
Providence
Providence
Columbus
Columbus
Providence
Columbus
Providence
2018
69
77
0.11
0.20
10.0
N/A
33.8
31.1
N/A
N/A
N/A
N/A
6.0
7.1
0.0
0.3
2017
68
75
0.16
0.21
9.6
8.8
28.7
30.6
N/A
N/A
N/A
N/A
5.5
6.3
0.1
0.2
2016
76
82
0.17
0.21
10.6
9.2
28.5
30.0
N/A
N/A
N/A
N/A
5.6
7.5
0.1
0.3
2015
74
86
0.16
0.23
11.3
10.6
27.0
29.3
N/A
N/A
N/A
N/A
6.1
7.9
0.1
0.4
2014
82
74
0.20
0.23
11.0
10.5
28.5
28.9
N/A
N/A
N/A
N/A
7.4
6.0
0.5
0.6
2013
78
97
N/A
0.22
8.9
10.3
29.6
30.9
N/A
N/A
N/A
N/A
7.8
9.7
0.6
0.5
2012
87
94
N/A
0.23
N/A
10.1
32.9
32.6
N/A
N/A
N/A
N/A
8.9
8.2
N/A
1.4
2011
89
86
N/A
0.23
N/A
11.4
28.1
31.0
N/A
N/A
N/A
N/A
8.9
8.7
N/A
1.3
2010
90
79
N/A
0.20
N/A
9.8
30.5
31.0
N/A
N/A
N/A
N/A
9.1
6.3
N/A
1.4
2009
61
75
N/A
0.24
N/A
11.2
28.7
N/A
N/A
N/A
N/A
N/A
N/A
5.8
N/A
1.8
2008
65
73
N/A
0.24
N/A
12.3
31.2
N/A
N/A
N/A
N/A
N/A
N/A
N/A
1.8
2.1
2007
80
86
N/A
0.25
N/A
13.9
30.8
N/A
N/A
N/A
N/A
N/A
N/A
N/A
2.8
4.1
2006
75
81
N/A
0.40
N/A
15.2
30.0
N/A
N/A
N/A
23.7
N/A
N/A
N/A
3.3
4.6
2005
87
91
N/A
0.40
N/A
17.4
29.6
N/A
N/A
N/A
27.5
N/A
N/A
N/A
4.1
5.8
2004
77
83
N/A
0.46
N/A
17.7
27.8
N/A
N/A
N/A
24.6
N/A
N/A
N/A
4.4
6.8
2003
91
86
N/A
0.54
N/A
18.9
26.4
N/A
N/A
N/A
23.9
N/A
N/A
N/A
4.1
6.3
2002
93
101
N/A
0.61
N/A
18.3
31.3
N/A
N/A
N/A
25.7
N/A
N/A
N/A
4.1
6.1
2001
84
109
N/A
0.53
N/A
20.2
29.2
N/A
0.019
N/A
25.9
N/A
N/A
N/A
3.5
7.5
2000
57
91
N/A
0.51
N/A
20.1
N/A
N/A
N/A
N/A
23.5
N/A
N/A
N/A
3.7
6.7
Natural disasters
Type
Columbus
Providence
Tornado activity compared to U.S. average
119.1%
52%
Earthquake activity compared to U.S. average
96.1%
26.6%
Natural disasters compared to U.S. average
16%
17%
Transportation
Both cities have robust public transportation systems. The Rhode Island Public Transit Authority operates bus services throughout Providence. Columbus has the Central Ohio Transit Authority, which runs extensive bus routes. Commuting times in Columbus generally tend to be shorter than in Providence.
Transport
Type
Columbus
Providence
Amtrak stations
1
1
Amtrak stations nearby
1
1
FAA registered aircraft
415
48
FAA registered aircraft manufacturers and dealers
4
1
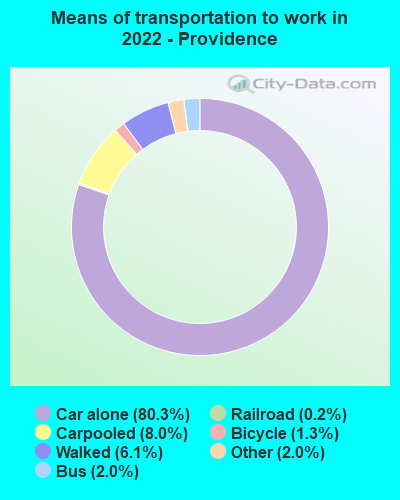
Means of transportation to work
Type
Columbus
Providence
Bicycle
0.6%
0.3%
Bus
1.6%
3.2%
Carpooled
7.4%
10.4%
Car alone
86.7%
78.2%
Railroad
0%
1%
Subway
0%
0.5%
Taxicab
0.1%
0.2%
Walked
2.2%
5.2%
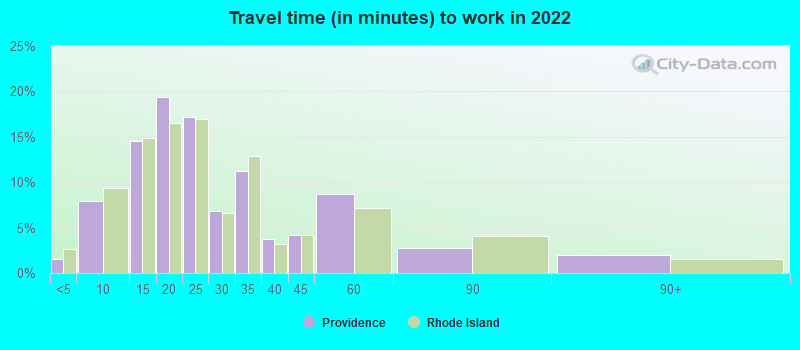
Average travel time to work
Type
Columbus
Providence
Average
26.1 min
24.7 min
Other means
21.7 min
20.9 min
Public transportation
35.4 min
36.9 min
Private vehicle occupancy
Type
Columbus
Providence
Average
1.1
1.2
Drove alone
90.7%
83.5%
In 2 person carpool
7.3%
13.1%
In 3 person carpool
1.4%
1.7%
In 4 person carpool
0.5%
0.7%
In 5-6 person carpool
0.1%
0.7%
In 7+ person carpool
0.1%
0.3%
How many people usually rode to work in the car, truck or van.
Real Estate
Real estate prices are higher on average in Providence compared to Columbus. In the downtown areas of both cities, housing options mostly consist of condos and apartments. Suburban areas offer more family-type houses. Buyers and renters can find more affordable options in Columbus.
Neighborhoods
Columbus and Providence boast a variety of neighborhoods, each with its own charm. Some popular Columbus neighborhoods include German Village and Victorian Village, each known for its respective architecture and green spaces. Providence has distinct areas such as the cozy East Side and vibrant West End.
Houses and residents
Type
Columbus
Providence
Houses
422,120
78,329
Average household size (people)
2.3
2.6
Length of stay in the house since moving in
12.6 years
12 years
Houses occupied
390,605 (92.5%)
68,179 (87%)
Houses occupied by owners
175,427 (44.9%)
27,713 (40.6%)
Houses occupied by renters
215,178 (55.1%)
40,466 (59.4%)
Median rent asked for vacant for-rent units
$1,371
$1,281
Median monthly housing costs
$1,110
$1,343
Median price asked for vacant for-sale houses and condos
$195,022
$266,596
Estimated median house or condo value
$219,200
$291,200
Median numbers of rooms
5
4.7
Median number of rooms in apartments
4.2
4.3
Median number of rooms in houses and condos
6.3
5.7
Median house price - detached houses
$233,452
$434,470
Median house price - in 2-unit structures
$121,729
$305,545
Median house price - in 3-to-4-unit structures
$215,337
$338,565
Median house price - in 5 or more unit structures
$240,711
$296,317
Median house price - Townhouses or other attached units
$218,726
$326,633
Median house price - All housing units
$229,736
$379,757
Median house age
42
2,021
Renting percentage
53%
65.1%
Housing density (houses/condos per square mile)
2,007.5
4,241.6
House value disparities
30.2%
33.7%
Household income disparities
42.4%
48.7%
Median household income for houses/condes with a mortgage
$89,058
$98,451
Median household income for apartments without a mortgage
$59,295
$73,826
Housing units without a mortgage
4,290 (3.3%)
555 (2.7%)
Housing units with both a second mortgage and home equity loan
10,651 (8.2%)
2,250 (10.7%)
Housing units with a mortgage
125,487 (96.7%)
20,388 (97.3%)
Housing units with a home equity loan
775 (0.6%)
88 (0.4%)
Housing units with a second mortgage
13,558 (10.4%)
2,692 (12.9%)
House/condo owner moved in on average (years ago)
10
8
House/condo renter moved in on average (years ago)
1
3
Housing units lacking complete kitchen facilities
1.6%
2.7%
Housing units lacking complete plumbing facilities
1.3%
0.6%
Housing units in structures
Housing units in structures
Columbus
Providence
One, detached
45.8%
24.2%
One, attached
9.1%
2.9%
Two
4.0%
20.0%
3 or 4
8.6%
29.3%
5 to 9
11.8%
5.3%
10 to 19
8.6%
2.0%
20 to 49
4.5%
2.6%
50 or more
6.8%
13.5%
Mobile homes
0.8%
0.3%
Boats, RVs, vans, etc.
0.1%
0.0%
Median real estate property taxes paid for housing units
Self-employed workers in own not incorporated business
20,915
4,620
State government workers
31,881
3,764
Unpaid family workers
724
73
Industries and Occupations
Columbus's dominant sectors include government, education, insurance, banking, defense, aviation, logistics, and more. Providence's economy leans heavily on health services and education but also on manufacturing. Opportunities for employment are considerable in both cities, but they vary by industry.
In terms of health care, Columbus has a number of renowned hospitals, with well-known research centers, like the James Cancer Hospital. Providence offers quality healthcare services as well, housing some top-rated hospitals, including Rhode Island Hospital—the state's largest.
Health (county statistics)
Type
Columbus
Providence
General health status score of residents in this county from 1 (poor) to 5 (excellent)
In terms of infrastructure, Columbus is known for its excellent road system and quality utilities. Providence has well-developed infrastructure too, but with older buildings and landmarks, the city may often require extensive maintenance work.
Infrastructure
Type
Columbus
Providence
Hospitals
47
7
TV stations
14
24
Arenas or stadiums
3
3
Bank branches located here
200
43
Bank institutions located here
25
11
Main business address for public companies
23
8
Drinking water stations with no reported violations in the past
17
2
Drinking water stations with reported violations in the past
HMDA - Conventional home purchase loans - Applications denied
Year
Columbus
Providence
1999
2,450
381
2000
2,376
421
2001
1,897
447
2002
1,483
425
2003
2,087
786
2004
3,216
1,138
2005
4,275
1,678
2006
4,662
1,738
2007
2,679
1,067
2008
1,015
451
2009
555
149
Culture and Food
Both cities have rich cultural scenes. Providence, known as the “Creative Capital”, is home to art communities and diverse food offerings, including popular sea cuisines. Columbus also boasts a vibrant arts scene and is known for its Midwestern food culture, featuring plenty of food festivals and craft beer offerings.
Sports Teams
Sports fans have plenty to cheer about in both cities. Columbus is home to the NHL's Blue Jackets, the MLS's Columbus Crew, and the NCAA's Ohio State Buckeyes. Meanwhile, Providence has the AHL's Providence Bruins and the NCAA's Providence Friars.


 Columbus, OH
 Providence, RI