Columbus, OH and Sioux Falls, SD present two unique American lifestyles. While Columbus is a bustling, progressive city with several universities and a diverse economy, Sioux Falls showcases an open, countryside charm, highlighted by a strong healthcare and finance sector. Consider this detailed comparison covering various aspects such as safety, cost of living, job market, education, and healthcare, if you're planning a visit or even a big move.
Distance between
Columbus, OH and
Sioux Falls, SD : 748.2 miles
Columbus's population is larger by 361%. Its population has grown by 195,058 people (27.4%) since 2000. The population of Sioux Falls has grown by 72,553 people (58.5%) during that time.
As per recent statistics, Columbus has a higher overall crime rate than Sioux Falls. However, both are safer than the national average in terms of violent crime rates. For tourists, both cities offer a generally safe environment, but as with anywhere, it's always advised to be vigilant. Columbus's downtown and German village districts are considered fairly safe, while in Sioux Falls, downtown and southern regions are considered the safest.
City-data.com crime index counts serious crimes and violent crime more heavily. It adjusts for the number of visitors and daily workers commuting into cities. (higher means more crime, U.S. average = 301.1)
City-data.com crime index counts serious crimes and violent crime more heavily. It adjusts for the number of visitors and daily workers commuting into cities. (higher means more crime, U.S. average = 301.1)
Sex Offenders
According to our data, there are 1,506 registered sex offenders living in Columbus and 1,254 registered sex offenders living in . The ratio of residents to sex offenders in Columbus is 573 to 1; the ratio in Sioux Falls is 136 to 1. The number of registered sex offenders compared to the number of residents is a lot smaller in Columbus than in Sioux Falls.
Cost of Living
In terms of the cost of living, Sioux Falls registers a lower index compared to Columbus. Housing costs are notably lower in Sioux Falls, while groceries, healthcare, and utilities are somewhat comparable. Both are cheaper than the national average, making them an economical choice for relocation.
Income Tax
Ohio has a progressive state income tax, and Columbus also levies a 2.5% city income tax. South Dakota, however, is one of the few states that does not collect an income tax, attractive for those seeking tax-friendly environments.
Property Tax
Property taxes in Sioux Falls are relatively lower than Columbus. This is largely due to South Dakota's overall lower tax rates and cost of living in comparison to Ohio.
Sales Tax
Ohio's state sales tax is 5.75%, and Columbus has an additional 2.5%, totaling 8.25%. In contrast, South Dakota holds a 4.5% sales tax, with Sioux Falls adding another 2%, making a total of 6.5%.
Income
Type
Columbus
Sioux Falls
Estimated median household income
$58,202
$73,273
Estimated per capita income
$32,392
$43,144
Cost of living index (U.S. average is 100)
96.1
80.7
If you make $50,000 in Sioux Falls, you will have to make $59,542 in Columbus to maintain the same standard of living.
Geographical Conditions
Columbus is characterized by flat terrain and enjoys access to several large bodies of water, including the Scioto and Olentangy rivers. Sioux Falls is known for its rolling hills, waterfalls, and the Big Sioux River.
Both cities are known for their commitment to education. Columbus is home to The Ohio State University, one of the largest universities in the US, along with several other reputable institutions. Sioux Falls has a strong school system and features prominent institutes such as Augustana University and the University of Sioux Falls.
Columbus supports a diverse economy with various industries including education, government, insurance, fashion, defense, and healthcare. In contrast, Sioux Falls's economy is largely based on healthcare, finance, and retail, with a growing technology sector. Job seekers may find opportunities in a wider range of sectors in Columbus.
Biggest Employers
The prominent employers in Columbus include The Ohio State University, Nationwide Insurance, and Honda. In Sioux Falls, Sanford Health, Avera Health, and Wells Fargo take the lead in employing locals.
There were 913 building permits issued in Columbus in 2012 (246 more than in 2011) compared to 1,313 building permits issued in Sioux Falls in 2012 (798 more than in 2011).
In Columbus (Franklin County), 60.8% voted for Democrats and 37.9% for Republicans in 2012 Presidential Election. In Sioux Falls (Minnehaha County), 45.3% voted for Democrats and 52.7% for Republicans.
Elections
Type
Democrats
Republicans
Other
Year
Columbus
Sioux Falls
Columbus
Sioux Falls
Columbus
Sioux Falls
2020
64.7%
43.8%
33.4%
53.3%
1.9%
2.8%
2016
59.8%
39.1%
33.9%
53.7%
6.2%
7.2%
2012
60.8%
45.3%
37.9%
52.7%
1.3%
2.0%
2008
59.8%
49.5%
39.0%
48.7%
1.2%
1.8%
2004
54.5%
41.8%
45.2%
57.2%
0.3%
1.0%
2000
48.9%
44.1%
47.9%
54.5%
3.2%
1.5%
1996
48.1%
48.0%
44.5%
44.2%
7.3%
7.7%
Breakdown of population affiliated with a religious congregation
Type
Adherents
Congregations
Religion
Columbus
Sioux Falls
Columbus
Sioux Falls
CATHOLIC CHURCH
13.2%
17.9%
5.6%
8.2%
EVANGELICAL LUTHERAN CHURCH IN AMERICA
1.6%
19.6%
3.7%
20.5%
SOUTHERN BAPTIST CONVENTION
1.6%
0.4%
6.8%
5.1%
MUSLIM ESTIMATE
1.3%
0.4%
1.9%
1.5%
VINEYARD USA
1.3%
0.0%
1.2%
0.0%
AMERICAN BAPTIST CHURCHES IN THE USA
1.0%
1.4%
3.3%
3.6%
EPISCOPAL CHURCH
0.4%
0.8%
1.3%
1.5%
SEVENTH DAY ADVENTIST CHURCH
0.4%
0.2%
2.0%
0.5%
LUTHERAN CHURCH
0.2%
2.1%
1.0%
4.6%
WISCONSIN EVANGELICAL LUTHERAN SYNOD
0.1%
0.6%
0.3%
1.0%
CHRISTIAN REFORMED CHURCH NORTH AMERICA
0.0%
1.6%
0.1%
2.1%
REFORMED CHURCH IN AMERICA
0.0%
1.6%
0.1%
2.6%
Weather
Sioux Falls experiences a humid continental climate, meaning cold, dry winters and warm, humid summers. Columbus, on the other hand, has a humid continental and humid subtropical climate mix which makes it relatively warmer with somewhat milder winters and hot, muggy summers. Therefore, your weather preference matters; if you prefer a colder climate, Sioux Falls is a better fit. If a warmer one catches your fancy, Columbus it is.
Weather and climate
Type
Columbus
Sioux Falls
Temperature - Average
52.8°F
45.1°F
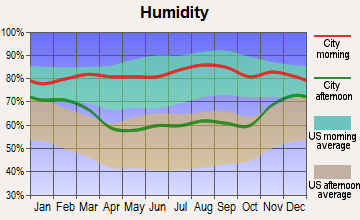
Humidity - Average morning or afternoon humidity
74.8%
76.6%
Humidity - Differences between morning and afternoon humidity
34%
34%
Humidity - Maximum monthly morning or afternoon humidity
86%
87%
Humidity - Minimum monthly morning or afternoon humidity
52%
53%
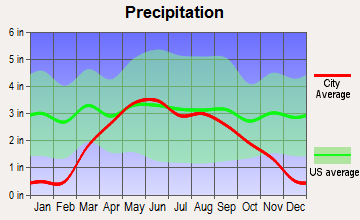
Precipitation - Yearly average
39.3 in
24.7 in
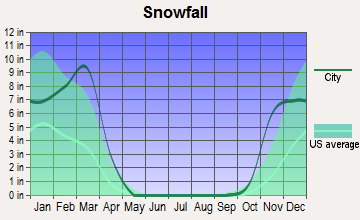
Snowfall - Yearly average
56.6 in
82 in
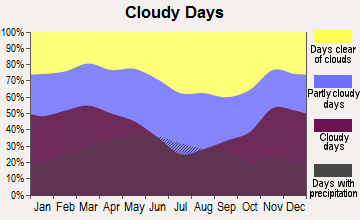
Clouds - Number of days clear of clouds
12%
17.6%
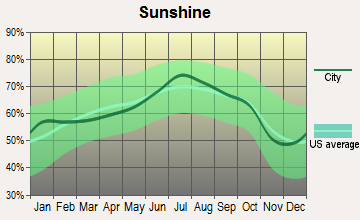
Sunshine amount - Average
49.7%
61.1%
Sunshine amount - Differences during a year
27%
25%
Sunshine amount - Maximum monthly
55%
71%
Sunshine amount - Minimum monthly
28%
46%
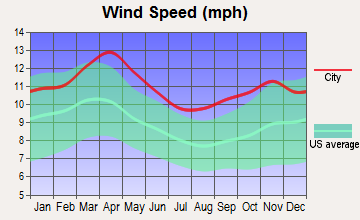
Wind speed - Average
8.2 mph
11.1 mph
Average climate in Columbus, Ohio
Average climate in Sioux Falls, South Dakota
Air pollution
Type
AQI
CO
NO2
OZONE
PM10
PM25
SO2
Year
Columbus
Sioux Falls
Columbus
Sioux Falls
Columbus
Sioux Falls
Columbus
Sioux Falls
Columbus
Sioux Falls
Columbus
Sioux Falls
Columbus
Sioux Falls
2018
69
65
0.11
0.18
10.0
4.7
33.8
29.8
N/A
13.6
6.0
5.4
0.0
0.4
2017
68
64
0.16
0.18
9.6
4.5
28.7
28.2
N/A
17.7
5.5
5.6
0.1
0.6
2016
76
61
0.17
0.19
10.6
4.3
28.5
30.6
N/A
18.5
5.6
6.7
0.1
0.4
2015
74
80
0.16
0.20
11.3
4.7
27.0
23.8
N/A
22.7
6.1
9.0
0.1
0.4
2014
82
73
0.20
0.19
11.0
5.0
28.5
31.9
N/A
21.6
7.4
7.5
0.5
0.7
2013
78
75
N/A
0.18
8.9
5.4
29.6
34.4
N/A
20.5
7.8
9.0
0.6
0.6
2012
87
86
N/A
0.19
N/A
6.2
32.9
32.1
N/A
20.4
8.9
6.2
N/A
0.5
2011
89
76
N/A
0.19
N/A
6.2
28.1
30.9
N/A
N/A
8.9
8.2
N/A
0.5
2010
90
76
N/A
N/A
N/A
6.6
30.5
28.8
N/A
19.9
9.1
10.3
N/A
0.2
2009
61
71
N/A
N/A
N/A
5.6
28.7
26.8
N/A
16.4
N/A
9.1
N/A
0.2
2008
65
49
N/A
N/A
N/A
6.6
31.2
27.9
N/A
17.6
N/A
N/A
1.8
1.1
2007
80
56
N/A
N/A
N/A
4.2
30.8
30.3
N/A
19.2
N/A
N/A
2.8
0.3
2006
75
57
N/A
N/A
N/A
5.3
30.0
29.9
23.7
17.7
N/A
N/A
3.3
0.2
2005
87
58
N/A
N/A
N/A
6.0
29.6
30.0
27.5
17.0
N/A
N/A
4.1
1.0
2004
77
46
N/A
N/A
N/A
6.5
27.8
N/A
24.6
17.0
N/A
N/A
4.4
0.3
2003
91
51
N/A
N/A
N/A
7.8
26.4
N/A
23.9
18.0
N/A
N/A
4.1
0.6
2002
93
48
N/A
N/A
N/A
N/A
31.3
N/A
25.7
18.7
N/A
N/A
4.1
0.5
2001
84
65
N/A
N/A
N/A
N/A
29.2
32.5
25.9
18.9
N/A
N/A
3.5
N/A
2000
57
51
N/A
N/A
N/A
N/A
N/A
26.7
23.5
N/A
N/A
N/A
3.7
N/A
Natural disasters
Type
Columbus
Sioux Falls
Tornado activity compared to U.S. average
119.1%
193.2%
Earthquake activity compared to U.S. average
96.1%
281.1%
Natural disasters compared to U.S. average
16%
14%
Transportation
Columbus offers more in terms of public transportation with COTA buses and car-sharing options. Sioux Falls relies more heavily on personal cars, with minimal public transportation options. Both cities have international airports offering regular flights.
Transport
Type
Columbus
Sioux Falls
Amtrak stations
1
0
Amtrak stations nearby
1
0
FAA registered aircraft
415
279
FAA registered aircraft manufacturers and dealers
4
6
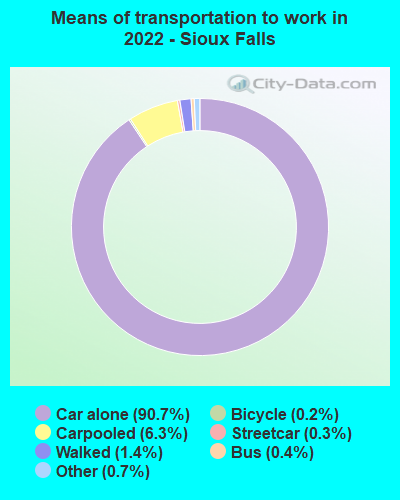
Means of transportation to work
Type
Columbus
Sioux Falls
Bicycle
0.6%
0.3%
Bus
1.6%
0.8%
Carpooled
7.4%
7.5%
Car alone
86.7%
88.6%
Taxicab
0.1%
0.1%
Walked
2.2%
1.8%
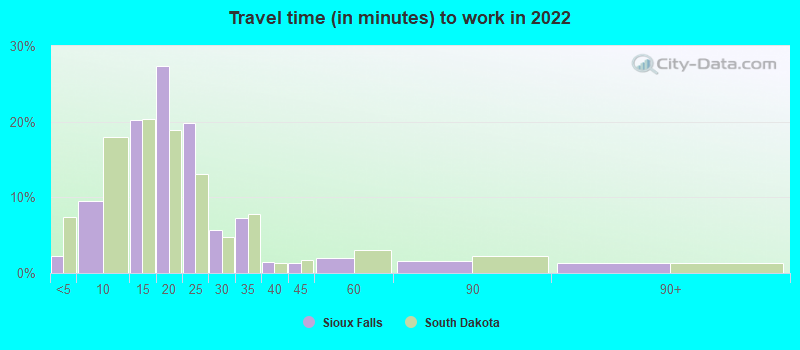
Average travel time to work
Type
Columbus
Sioux Falls
Average
26.1 min
19.9 min
Other means
21.7 min
17.4 min
Public transportation
35.4 min
31 min
Private vehicle occupancy
Type
Columbus
Sioux Falls
Average
1.1
1.1
Drove alone
90.7%
91.3%
In 2 person carpool
7.3%
6.2%
In 3 person carpool
1.4%
1.6%
In 4 person carpool
0.5%
0.3%
In 7+ person carpool
0.1%
0.5%
How many people usually rode to work in the car, truck or van.
Real Estate
Real estate is generally more affordable in Sioux Falls with a lower median home price than Columbus, allowing for more bang for your buck. In Columbus, the ongoing urban revitalization has led to rising property values, particularly in areas like the Short North and German Village.
Neighborhoods
Columbus offers a range of neighborhoods from urban to suburban, with a lively downtown. In contrast, Sioux Falls has more of a small-town feel with quiet, family-friendly neighborhoods and a tranquil downtown area.
Houses and residents
Type
Columbus
Sioux Falls
Houses
422,120
86,893
Average household size (people)
2.3
2.4
Median year apartment built
1982
1994
Median year house/condo built
1977
1993
Length of stay in the house since moving in
12.6 years
9.9 years
Houses occupied
390,605 (92.5%)
83,498 (96.1%)
Houses occupied by owners
175,427 (44.9%)
51,017 (61.1%)
Houses occupied by renters
215,178 (55.1%)
32,481 (38.9%)
Median rent asked for vacant for-rent units
$1,371
$1,080
Median monthly housing costs
$1,110
$1,034
Median price asked for vacant for-sale houses and condos
$195,022
$156,111
Estimated median house or condo value
$219,200
$249,600
Median numbers of rooms
5
5.6
Median number of rooms in apartments
4.2
4
Median number of rooms in houses and condos
6.3
7.2
Median house price - detached houses
$233,452
$330,251
Median house price - in 2-unit structures
$121,729
$177,750
Median house price - in 3-to-4-unit structures
$215,337
$76,244
Median house price - in 5 or more unit structures
$240,711
$153,603
Median house price - mobile homes
$121,578
$38,504
Median house price - Townhouses or other attached units
$218,726
$221,568
Median house price - All housing units
$229,736
$319,378
Median house age
42
28
Renting percentage
53%
37.6%
Housing density (houses/condos per square mile)
2,007.5
1,542.9
House value disparities
30.2%
30.8%
Household income disparities
42.4%
41.9%
Median household income for houses/condes with a mortgage
$89,058
$101,735
Median household income for apartments without a mortgage
$59,295
$76,762
Housing units without a mortgage
4,290 (3.3%)
732 (2.1%)
Housing units with both a second mortgage and home equity loan
10,651 (8.2%)
2,282 (6.4%)
Housing units with a mortgage
125,487 (96.7%)
34,852 (97.9%)
Housing units with a home equity loan
775 (0.6%)
80 (0.2%)
Housing units with a second mortgage
13,558 (10.4%)
2,934 (8.2%)
House/condo owner moved in on average (years ago)
10
7
House/condo renter moved in on average (years ago)
1
1
Housing units lacking complete kitchen facilities
1.6%
1.3%
Housing units lacking complete plumbing facilities
1.3%
0.8%
Housing units in structures
Housing units in structures
Columbus
Sioux Falls
One, detached
45.8%
55.4%
One, attached
9.1%
8.2%
Two
4.0%
1.9%
3 or 4
8.6%
5.0%
5 to 9
11.8%
3.6%
10 to 19
8.6%
6.6%
20 to 49
4.5%
10.7%
50 or more
6.8%
5.2%
Mobile homes
0.8%
3.4%
Boats, RVs, vans, etc.
0.1%
0.1%
Median real estate property taxes paid for housing units
Self-employed workers in own not incorporated business
20,915
4,141
State government workers
31,881
1,762
Unpaid family workers
724
192
Industries and Occupations
Key industries in Columbus include education, insurance, banking, health care, and logistics. Sioux Falls is more focused on healthcare, financial services, and retail, with significant representation in these areas.
Both cities have solid healthcare facilities. Columbus houses several highly-rated hospitals, including the Ohio State University Wexner Medical Center. In Sioux Falls, healthcare is a major part of the local economy, punctuated by the presence of Sanford Health, one of the largest hospital systems in the nation.
Health (county statistics)
Type
Columbus
Sioux Falls
General health status score of residents in this county from 1 (poor) to 5 (excellent)
Columbus is larger and more urbanized, boasting a modern infrastructure complete with notable landmarks. However, Sioux Falls is not far behind with a well-developed, clean, and efficient infrastructure supporting a smaller population.
Infrastructure
Type
Columbus
Sioux Falls
Hospitals
47
13
TV stations
14
17
Arenas or stadiums
3
1
Bank branches located here
200
100
Bank institutions located here
25
25
Main business address for public companies
23
5
Nuclear power plants
0
1
Drinking water stations with no reported violations in the past
17
0
Drinking water stations with reported violations in the past
HMDA - Conventional home purchase loans - Applications denied
Year
Columbus
Sioux Falls
1999
2,450
542
2000
2,376
696
2001
1,897
411
2002
1,483
239
2003
2,087
156
2004
3,216
218
2005
4,275
285
2006
4,662
317
2007
2,679
241
2008
1,015
98
2009
555
75
Culture and Food
Both cities have rich cultural scenes. Columbus offers more diversity with a broad food scene, arts, and nightlife while Sioux Falls provides a more laid-back environment with a blend of outdoor recreation and midwestern charm.
Sports Teams
Sports fans would be at home in Columbus, home to Ohio State Buckeyes, Columbus Crew SC, and the Blue Jackets. Sioux Falls, however, lacks major league teams, but locals enjoy a vibrant minor league sports scene.


 Columbus, OH
 Sioux Falls, SD