Columbus, OH vs Yonkers, NY - Advanced U.S. city comparison tool

Columbus, OH vs Yonkers, NY

Columbus, OH and Yonkers, NY, though geographically different, both have their unique charm. A sprawling Midwest city, Columbus is known for its lower cost of living, diverse job market, and enthusiastic sports culture, while Yonkers, an inner suburb of New York City, boasts a higher cost but better urban amenities and easy access to the metropolis. Each city offers a unique blend of opportunities, amenities, and challenges that may appeal differently to residents or visitors, depending on their interests and lifestyle.
 
 
Distance between Columbus, OH and Yonkers, NY : 484.0 miles

Columbus's population is larger by 333%. Its population has grown by 195,058 people (27.4%) since 2000. The population of Yonkers has grown by 13,444 people (6.9%) during that time.

Population
Type Columbus Yonkers
Population 906,528 209,530
Female / male percentage 50.7% / 49.3%
50.7%
49.3%
51.8% / 48.2%
51.8%
48.2%
Racial makeup - percentage
Ethnicity ColumbusYonkers
White Non-Hispanic 52.9% 35.9%
Black 29.0% 15.3%
Hispanic 6.9% 40.5%
Asian 5.7% 4.8%
Two or more 5.0% 2.6%
American Indian 0.1% 0.1%
Racial makeup - absolute values
Ethnicity ColumbusYonkers
White Non-Hispanic 479,734 75,166
Black 262,859 32,044
Hispanic 62,657 84,930
Asian 51,849 10,085
Two or more 45,592 5,459
American Indian 677 298
Pacific Islander 199 0

Crime and Safety

Relative to Ohio, Columbus has a higher crime rate, but it varies by neighborhood. Columbus has been working on improving safety and has seen some improvements in recent years. Yonkers, on the other hand, is considered one of the safest cities of its size in the U.S. with a declining crime rate. Both cities are dedicated to maintaining safe environments for residents and visitors alike.

Crime by year per 100,000 residents
Type City-data.com crime indexRobberies per 100,000Murders per 100,000Rapes per 100,000Assaults per 100,000Burglaries per 100,000Theft per 100,000Auto theft per 100,000Arson per 100,000
Year ColumbusYonkersColumbusYonkersColumbusYonkersColumbusYonkersColumbusYonkersColumbusYonkersColumbusYonkersColumbusYonkersColumbusYonkers
2020 376.1 139.8 197.1 84.2 19.1 3.5 89.5 18.9 250.1 218.6 609.1 137.4 2,180.6 730.0 340.7 123.5 1.3 6.0
2019 366.2 142.6 200.6 112.0 9.5 3.0 99.0 21.0 198.6 217.9 643.0 104.0 2,286.8 732.7 394.8 76.0 1.2 7.5
2018 391.5 132.2 219.9 105.0 12.3 0.5 100.6 15.3 182.1 227.3 726.4 133.1 2,437.8 662.6 445.2 77.4 1.2 3.0
2017 427.9 160.8 227.6 134.5 16.4 4.0 112.2 17.9 168.7 245.6 820.0 178.6 2,681.7 734.8 482.8 90.3 1.3 7.4
2016 426.3 185.2 250.7 201.9 12.1 4.0 105.9 16.8 175.6 244.0 901.8 208.8 2,775.5 750.2 412.3 123.2 47.0 7.4
2015 418.9 184.3 267.1 178.9 9.8 3.0 105.2 26.8 179.2 262.2 857.3 187.4 2,738.9 672.6 370.4 135.3 47.8 5.5
2014 430.6 178.9 254.2 177.9 10.2 1.5 94.7 17.9 199.3 289.6 1,095.3 206.4 2,828.0 695.3 355.0 99.7 34.4 7.5
2013 465.9 196.0 301.7 195.8 9.6 3.0 84.8 12.6 148.6 308.8 1,444.1 236.0 3,111.8 834.6 414.4 118.5 45.2 5.0
2012 513.5 212.0 380.1 212.6 8.9 2.0 74.0 14.1 140.0 342.1 1,865.9 269.6 3,235.8 906.5 430.3 116.4 65.0 7.1
2011 567.0 221.2 412.8 235.2 11.0 3.6 75.4 17.8 164.5 247.4 1,934.0 382.5 3,888.5 1,024.6 461.5 151.4 30.2 7.6
2010 582.4 202.8 428.1 232.2 12.1 4.6 72.9 14.8 182.2 205.1 1,938.7 265.8 3,926.9 1,064.4 528.4 124.5 51.2 13.8
2009 591.1 215.0 447.6 234.9 10.8 4.0 78.9 17.8 170.5 220.6 1,924.7 306.6 3,977.4 1,079.2 552.0 169.6 56.9 17.3
2008 624.5 214.2 478.9 223.9 13.3 4.5 85.7 21.0 200.7 208.4 1,962.1 327.1 3,788.5 1,062.5 708.2 176.3 62.5 20.0
2007 673.2 210.6 523.8 214.1 10.7 5.0 92.8 22.2 228.9 201.9 1,960.5 324.1 4,233.9 1,006.7 849.3 189.8 86.7 17.7
2006 664.5 231.6 499.5 252.9 11.6 4.1 81.7 15.7 220.8 223.9 2,031.6 330.5 4,243.2 1,218.6 873.6 229.0 76.4 16.8
2005 576.1 221.8 521.7 262.4 14.1 4.6 76.3 10.6 237.3 213.8 2,014.7 324.7 4,406.4 1,153.4 1,097.3 247.2 63.7 17.2
2004 575.7 232.7 460.1 231.1 10.7 7.6 81.9 11.6 261.0 226.0 2,002.6 360.5 4,673.3 1,184.2 1,168.9 342.3 69.5 18.7
2003 587.3 230.2 458.9 229.8 15.0 6.6 84.7 12.7 297.3 195.9 2,017.5 413.0 4,591.7 1,105.9 1,149.2 398.8 22.3 18.2

City-data.com crime index counts serious crimes and violent crime more heavily. It adjusts for the number of visitors and daily workers commuting into cities. (higher means more crime, U.S. average = 301.1)


Crime per year
Type City-data.com crime indexRobberiesMurdersRapesAssaultsBurglariesTheftAuto theftArson
Year ColumbusYonkersColumbusYonkersColumbusYonkersColumbusYonkersColumbusYonkersColumbusYonkersColumbusYonkersColumbusYonkersColumbusYonkers
2019 366.2 142.6 1,818 224 86 6 897 42 1,800 436 5,826 208 20,721 1,466 3,577 152 11 15
2018 391.5 132.2 1,963 213 110 1 898 31 1,625 461 6,484 270 21,759 1,344 3,974 157 11 6
2017 427.9 160.8 1,985 271 143 8 979 36 1,471 495 7,152 360 23,390 1,481 4,211 182 11 15
2016 426.3 185.2 2,162 408 104 8 913 34 1,515 493 7,778 422 23,939 1,516 3,556 249 405 15
2015 418.9 184.3 2,264 361 83 6 892 54 1,519 529 7,268 378 23,219 1,357 3,140 273 405 11
2014 430.6 178.9 2,112 357 85 3 787 36 1,656 581 9,100 414 23,495 1,395 2,949 200 286 15
2013 465.9 196.0 2,463 390 78 6 692 25 1,213 615 11,789 470 25,404 1,662 3,383 236 369 10
2012 513.5 212.0 3,031 422 71 4 590 28 1,116 679 14,878 535 25,802 1,799 3,431 231 518 14
2011 567.0 221.2 3,251 463 87 7 594 35 1,296 487 15,232 753 30,626 2,017 3,635 298 238 15
2010 582.4 202.8 3,369 455 95 9 574 29 1,434 402 15,258 521 30,906 2,086 4,159 244 403 27
2009 591.1 215.0 3,399 475 82 8 599 36 1,295 446 14,616 620 30,204 2,182 4,192 343 432 35
2008 624.5 214.2 3,601 447 100 9 644 42 1,509 416 14,753 653 28,485 2,121 5,325 352 470 40
2007 673.2 210.6 3,855 424 79 10 683 44 1,685 400 14,429 642 31,161 1,994 6,251 376 638 35
2006 664.5 231.6 3,654 498 85 8 598 31 1,615 441 14,862 651 31,041 2,400 6,391 451 559 33
2005 576.1 221.8 3,810 518 103 9 557 21 1,733 422 14,714 641 32,181 2,277 8,014 488 465 34
2004 575.7 232.7 3,358 457 78 15 598 23 1,905 447 14,617 713 34,111 2,342 8,532 677 507 37
2003 587.3 230.2 3,332 454 109 13 615 25 2,159 387 14,650 816 33,343 2,185 8,345 788 162 36

City-data.com crime index counts serious crimes and violent crime more heavily. It adjusts for the number of visitors and daily workers commuting into cities. (higher means more crime, U.S. average = 301.1)

Sex Offenders

According to our data, there are 1,506 registered sex offenders living in Columbus and 121 registered sex offenders living in .
The ratio of residents to sex offenders in Columbus is 573 to 1; the ratio in Yonkers is 1,659 to 1.
The number of registered sex offenders compared to the number of residents is much larger in Columbus than that in Yonkers.

Cost of Living

Columbus has a lower cost of living compared to the national average, particularly in terms of housing. Groceries, health care, and utilities are also less expensive. Conversely, Yonkers, being part of the New York metropolitan area, has a significantly higher cost of living compared to the national average, especially in terms of housing.

Income Tax

Both cities have city and state income taxes. In Columbus, residents face Ohio's state income tax. In Yonkers, residents pay both a New York State income tax and a supplemental income tax for living in Yonkers.

Property Tax

Property taxes are higher in Yonkers than in Columbus, reflecting the overall higher cost of living in the New York area.

Sales Tax

Sales tax in Columbus is moderately high at roughly 7.5%. Nevertheless, it's lower than in Yonkers where the combined state and local sales tax rate can approach 8.375% due to its location in Westchester County.
Income
Type Columbus Yonkers
Estimated median household income $58,202 $66,395
Estimated per capita income $32,392 $37,977
Cost of living index (U.S. average is 100) 96.1 152.2

If you make $50,000 in Columbus, you will have to make $79,188 in Yonkers to maintain the same standard of living.

Geographical Conditions

Columbus is relatively flat with some modest hills, and the Scioto and Olentangy rivers running through it. Yonkers, in contrast, has a more varied topography with the Hudson River to its west, and hilly areas offering views of the Manhattan skyline.
Geographical information
Type Columbus Yonkers
Land area 210.3 sq. miles 18.1 sq. miles
Population density 4,311.3 people per sq. mile 11,591 people per sq. mile
Elevation 800 feet 80 feet
Relative area comparison
Columbus, OH Yonkers, NY
First ancestry reported - percentage
Ancestry ColumbusYonkers
German 7.8% 0.8%
English 5.2% 0.6%
Irish 4.2% 6.8%
Italian 3.2% 10.5%
Polish 1.2% 1.3%
Scottish 0.7% 0.1%
Welsh 0.5% 0.0%
Scotch-Irish 0.5% 0.1%
Slovak 0.3% 0.1%
Dutch 0.3% 0.0%
Russian 0.3% 0.4%
Ukrainian 0.2% 0.7%
Lithuanian 0.2% 0.0%
Greek 0.2% 0.4%
Hungarian 0.2% 0.1%
Arab 0.1% 0.4%
Portuguese 0.0% 1.1%
Population origin - absolute values
Ancestry ColumbusYonkers
German 39,093 960
English 25,954 811
Irish 21,227 8,583
Italian 15,939 13,290
Polish 5,799 1,612
Scottish 3,493 160
Scotch-Irish 2,642 101
Welsh 2,395 53
Slovak 1,547 165
Russian 1,502 488
Dutch 1,361 58
Hungarian 1,088 104
Ukrainian 1,081 927
Lithuanian 1,020 36
Norwegian 937 60
Greek 847 493
French 789 231
Swedish 763 96
Swiss 757 20
Czech 673 114
Foreign born residents - absolute values
Type Count
Region ColumbusYonkers
All 125,304 62,982
Africa 42,208 3,062
Asia 44,859 10,449
Europe 8,129 11,644
Latin America 23,931 39,420
North America 1,235 225
Oceania 245 42
Foreign born residents - percentage
Type Percentage
Region ColumbusYonkers
All 13.9% 30.1%
Africa 4.7% 1.5%
Asia 5.0% 5.0%
Europe 0.9% 5.6%
Latin America 2.6% 18.8%
North America 0.1% 0.1%

Education

Columbus is home to the Ohio State University, one of the largest universities in the U.S., and several other colleges and universities. It also has good public and private schools. Yonkers, despite its smaller size, offers excellent education opportunities with solid public schools and easy access to numerous higher education institutions in New York City.
School enrollment
Type Columbus Yonkers
Nursery, preschool 8,473 (3.8%) 2,856 (5.5%)
Kindergarten 10,536 (4.7%) 3,179 (6.1%)
Grade 1 to 4 40,173 (17.9%) 9,449 (18.1%)
Grade 5 to 8 41,603 (18.5%) 10,102 (19.3%)
Grade 9 to 12 40,616 (18.1%) 12,136 (23.2%)
College undergrad 63,955 (28.4%) 10,098 (19.3%)
Graduate or professional 19,575 (8.7%) 4,391 (8.4%)
Students in private schools - absolute values
Type Count
Grade ColumbusYonkers
Grades 1 to 8 (elementary and middle school) 15,679 3,251
Grades 9 to 12 (high school) 5,030 2,870
Undergraduate colleges 8,811 5,574
Students in private schools - percentage
Type Percentage
Grade ColumbusYonkers
Grades 1 to 8 (elementary and middle school) 19.2% 16.6%
Grades 9 to 12 (high school) 12.4% 23.6%
Undergraduate colleges 13.8% 55.2%
Educational attainment
Type Columbus Yonkers
Less than high school 9.2% 14.4%
High school or equiv. 24.9% 21.9%
Less than 1 year of college 6.3% 6.2%
1 or more years of college 13.6% 11.3%
Associate degree 7.6% 9.5%
Bachelor's degree 25% 19.4%
Master's degree 9.8% 13.8%
Profess. school degree 2% 2.1%
Doctorate degree 1.6% 1.3%
Education level (25-year-olds and older)
Type Columbus Yonkers
Bachelor's degree or higher 38.4% 36.6%
Graduate or professional degree 13.4% 17.2%
High school or higher 90.8% 85.6%

Work and Economy

Columbus has a diversified economy with sectors like education, government, and insurance playing major roles. Job growth has been consistently positive over the past years. Yonkers' economy revolves around sectors like retail, healthcare, and professional services. It benefits from its proximity to NYC, offering a short commute for those working in Manhattan.

Biggest Employers

In Columbus, the Ohio State University, state government, and Nationwide Insurance are among the biggest employers. On the other end, in Yonkers, the biggest employers include Montefiore Medical, Empire City Casino, and Yonkers Public Schools.
Employment and residency - absolute values
Kind ColumbusYonkers
Work and live in this city 254,193 22,785
Work and live in this county 412,410 58,944
Workers who work outside the city they live in 457,277 173,301
Workers who work outside the county they live in 56,853 34,469
Working at home 111,379 14,845
Not working at home 357,884 78,568
Daytime population change due to commuting 82,520 N/A
Employment and residency - percentage
Kind ColumbusYonkers
Work and live in this city 69.2% 27.7%
Work and live in this county 87.9% 63.1%
Workers who work outside the city they live in 30.8% 72.3%
Workers who work outside the county they live in 12.1% 36.9%
Working at home 23.7% 15.9%
Not working at home 76.3% 84.1%
Daytime population change due to commuting 11.6% N/A
Geographical mobility: all
Type all
Mobility ColumbusYonkers
Same house 1 year ago 79.0% 89.5%
Moved from abroad 0.8% 0.3%
Moved within same county 13.5% 4.7%
Moved from different state 2.7% 1.2%
Moved within same state 4.0% 4.3%
Geographical mobility: Asian
Type Asian
Mobility ColumbusYonkers
Same house 1 year ago 72.4% 91.3%
Moved from abroad 3.5% 0.4%
Moved within same county 13.7% 4.9%
Moved from different state 8.9% 0.5%
Moved within same state 1.6% 3.4%
Geographical mobility: Black
Type Black
Mobility ColumbusYonkers
Same house 1 year ago 78.9% 84.6%
Moved from abroad 1.6% 0.1%
Moved within same county 14.7% 6.8%
Moved from different state 1.9% 1.9%
Moved within same state 2.8% 6.7%
Geographical mobility: White
Type White
Mobility ColumbusYonkers
Same house 1 year ago 79.8% 93.2%
Moved from abroad 0.4% 0.0%
Moved within same county 12.6% 2.5%
Moved from different state 2.7% 1.2%
Moved within same state 4.5% 3.0%
Building permits
Type Average valueCount
City ColumbusYonkersColumbusYonkers
1997 $74,900 $130,000 1,822 11
1998 $78,200 $126,900 1,979 19
1999 $105,800 $135,400 2,871 18
2000 $128,300 $149,900 2,903 29
2001 $130,400 $160,200 3,058 30
2002 $133,600 $180,600 3,196 20
2003 $137,900 $156,700 3,188 24
2004 $141,300 $186,400 2,687 92
2005 $160,500 $226,400 2,360 38
2006 $168,800 $228,500 1,223 31
2007 $163,200 $225,700 1,008 31
2008 $169,200 $237,900 686 14
2009 $162,500 $317,300 852 9
2010 $164,100 $231,700 716 9
2011 $160,000 $259,900 667 7
2012 $163,700 $207,000 723 10
2013 $174,000 $290,000 770 16
2014 $211,100 $229,300 724 23
2015 $244,000 $218,000 729 16
2016 $243,500 $279,500 649 17
2017 $257,700 $215,300 650 7
2018 $226,600 $241,800 555 10
2019 $259,300 $228,200 512 10
2020 $266,700 $230,900 834 10
2021 $306,700 $230,200 913 12

There were 913 building permits issued in Columbus in 2012 (246 more than in 2011) compared to 12 building permits issued in Yonkers in 2012 (5 more than in 2011).

In Columbus (Franklin County), 60.8% voted for Democrats and 37.9% for Republicans in 2012 Presidential Election. In Yonkers (Westchester County), 62.1% voted for Democrats and 36.9% for Republicans.

Elections
Type DemocratsRepublicansOther
Year ColumbusYonkersColumbusYonkersColumbusYonkers
2020 64.7% 67.8% 33.4% 31.4% 1.9% 0.8%
2016 59.8% 65.0% 33.9% 31.2% 6.2% 3.8%
2012 60.8% 62.1% 37.9% 36.9% 1.3% 0.9%
2008 59.8% 63.7% 39.0% 36.0% 1.2% 0.3%
2004 54.5% 58.2% 45.2% 40.4% 0.3% 1.4%
2000 48.9% 58.9% 47.9% 37.6% 3.2% 3.5%
1996 48.1% 56.9% 44.5% 35.9% 7.3% 7.2%
Breakdown of population affiliated with a religious congregation
Type AdherentsCongregations
Religion ColumbusYonkersColumbusYonkers
CATHOLIC CHURCH 13.2% 45.9% 5.6% 15.3%
EVANGELICAL LUTHERAN CHURCH IN AMERICA 1.6% 0.5% 3.7% 2.5%
SOUTHERN BAPTIST CONVENTION 1.6% 0.1% 6.8% 2.0%
MUSLIM ESTIMATE 1.3% 1.4% 1.9% 1.5%
VINEYARD USA 1.3% 0.0% 1.2% 0.3%
AMERICAN BAPTIST CHURCHES IN THE USA 1.0% 0.6% 3.3% 3.4%
EPISCOPAL CHURCH 0.4% 1.5% 1.3% 7.5%
SEVENTH DAY ADVENTIST CHURCH 0.4% 0.4% 2.0% 3.5%
REFORMED CHURCH IN AMERICA 0.0% 0.3% 0.1% 1.7%

Weather

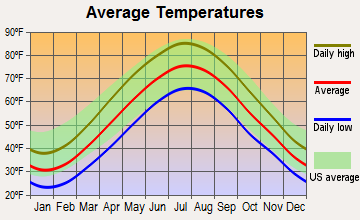
The weather in Columbus is typically Midwestern, with hot, humid summers and cold, dry winters. It experiences four distinct seasons. Yonkers, located in the Northeast, also experiences four seasons, but with milder summers and potentially more severe winters, with occasional Nor'easter storms bringing heavy snow.
Weather and climate
Type Columbus Yonkers
Temperature - Average 52.8°F 53.5°F
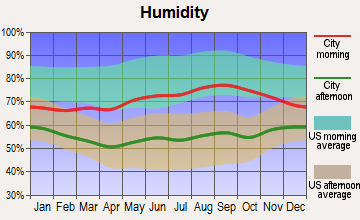
Humidity - Average morning or afternoon humidity 74.8% 67.4%
Humidity - Differences between morning and afternoon humidity 34% 26.9%
Humidity - Maximum monthly morning or afternoon humidity 86% 75.9%
Humidity - Minimum monthly morning or afternoon humidity 52% 49%
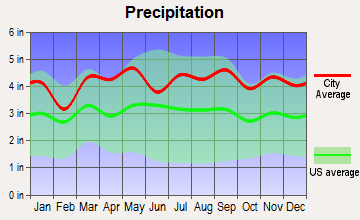
Precipitation - Yearly average 39.3 in 50.1 in
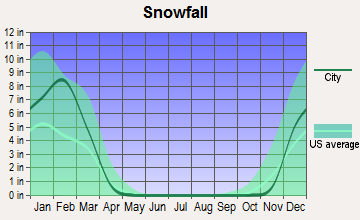
Snowfall - Yearly average 56.6 in 54.9 in
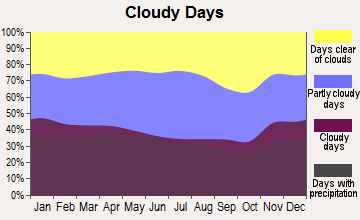
Clouds - Number of days clear of clouds 12% 16.7%
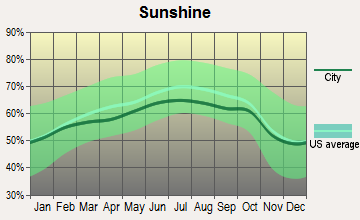
Sunshine amount - Average 49.7% 60.2%
Sunshine amount - Differences during a year 27% 20%
Sunshine amount - Maximum monthly 55% 64%
Sunshine amount - Minimum monthly 28% 44%
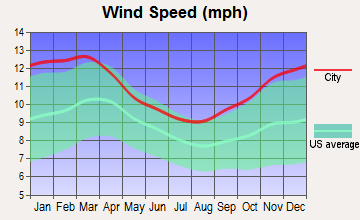
Wind speed - Average 8.2 mph 10 mph

Average climate in Columbus, Ohio

Chicago, Illinois average temperatures Chicago, Illinois average precipitation Chicago, Illinois humidity Chicago, Illinois wind speed Chicago, Illinois snowfall Chicago, Illinois sunshine Chicago, Illinois clear and cloudy days
 

Average climate in Yonkers, New York

Chicago, Illinois average temperatures Chicago, Illinois average precipitation Chicago, Illinois humidity Chicago, Illinois wind speed Chicago, Illinois snowfall Chicago, Illinois sunshine Chicago, Illinois clear and cloudy days
 

Air pollution
Type AQICONO2OZONEPBPM10PM25SO2
Year ColumbusYonkersColumbusYonkersColumbusYonkersColumbusYonkersYonkers ColumbusYonkersColumbusYonkersColumbusYonkers
2018 69 102 0.11 0.30 10.0 16.1 33.8 24.6 N/A N/A N/A N/A 6.0 7.5 0.0 0.6
2017 68 97 0.16 0.10 9.6 16.1 28.7 24.8 N/A N/A N/A N/A 5.5 7.2 0.1 0.5
2016 76 97 0.17 0.28 10.6 16.8 28.5 24.7 N/A N/A N/A N/A 5.6 7.5 0.1 0.7
2015 74 105 0.16 0.29 11.3 18.1 27.0 23.9 N/A N/A N/A N/A 6.1 8.7 0.1 1.3
2014 82 96 0.20 0.33 11.0 18.3 28.5 23.7 N/A N/A N/A N/A 7.4 8.2 0.5 1.6
2013 78 103 N/A 0.39 8.9 18.8 29.6 23.8 N/A N/A N/A N/A 7.8 8.9 0.6 1.9
2012 87 102 N/A 0.43 N/A 18.6 32.9 24.2 N/A N/A N/A N/A 8.9 8.9 N/A 2.8
2011 89 107 N/A 0.45 N/A 20.8 28.1 22.6 N/A N/A N/A N/A 8.9 10.9 N/A 4.1
2010 90 113 N/A 0.48 N/A 19.3 30.5 24.0 N/A N/A N/A N/A 9.1 10.3 N/A 3.7
2009 61 102 N/A 0.50 N/A 21.4 28.7 19.7 N/A N/A N/A N/A N/A 10.4 N/A 4.5
2008 65 114 N/A 0.51 N/A 22.5 31.2 20.4 0.013 N/A N/A N/A N/A 11.7 1.8 5.0
2007 80 120 N/A 0.58 N/A 24.2 30.8 19.7 0.016 N/A N/A N/A N/A 12.8 2.8 6.0
2006 75 115 N/A 0.53 N/A 23.9 30.0 19.7 0.018 N/A 23.7 N/A N/A 12.8 3.3 6.1
2005 87 112 N/A 0.62 N/A 26.1 29.6 18.8 N/A N/A 27.5 N/A N/A N/A 4.1 8.1
2004 77 99 N/A 0.63 N/A 25.0 27.8 17.6 0.030 N/A 24.6 N/A N/A N/A 4.4 7.9
2003 91 106 N/A 0.74 N/A 26.5 26.4 18.1 0.025 N/A 23.9 26.9 N/A N/A 4.1 8.0
2002 93 122 N/A 0.68 N/A 26.7 31.3 18.9 N/A N/A 25.7 25.4 N/A N/A 4.1 7.6
2001 84 123 N/A 0.69 N/A 28.9 29.2 19.4 N/A N/A 25.9 23.6 N/A N/A 3.5 8.9
2000 57 111 N/A 0.71 N/A 29.2 N/A 17.1 N/A N/A 23.5 22.2 N/A N/A 3.7 8.4
Natural disasters
Type Columbus Yonkers
Tornado activity compared to U.S. average 119.1% 60.2%
Earthquake activity compared to U.S. average 96.1% 31.2%
Natural disasters compared to U.S. average 16% 26%

Transportation

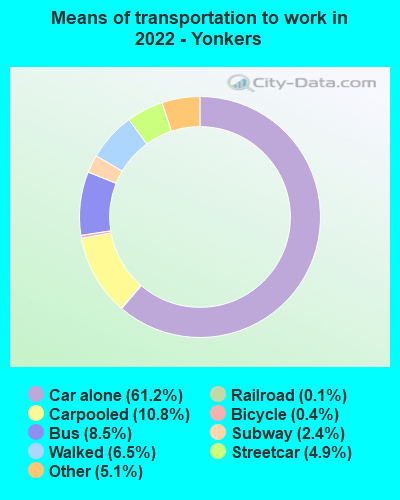
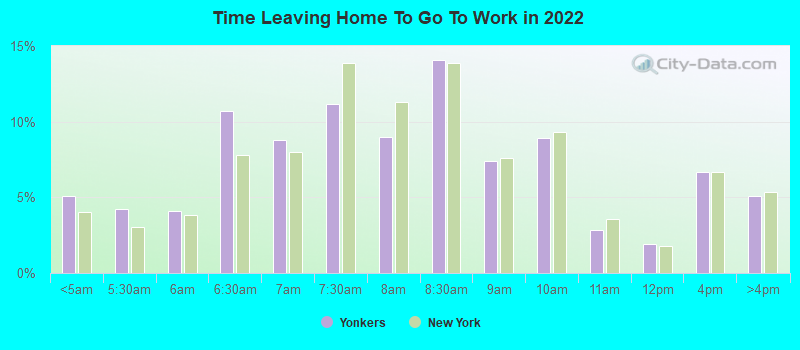
Columbus, being more spread out, relies heavily on car transportation, though it does have a growing bus system. Yonkers has excellent public transit with buses, trains, and subway service to NYC, and most of the population prefer public transit for daily commuting.
Transport
Type Columbus Yonkers
Amtrak stations 1 1
Amtrak stations nearby 1 3
FAA registered aircraft 415 17
FAA registered aircraft manufacturers and dealers 4 0
Means of transportation to work
Type Columbus Yonkers
Bicycle 0.6% 0.1%
Bus 1.6% 13.9%
Carpooled 7.4% 12.2%
Car alone 86.7% 60.3%
Railroad 0% 6.2%
Streetcar 0% 2.5%
Subway 0% 2.5%
Taxicab 0.1% 0.9%
Walked 2.2% 4.4%
Means of transportation to work
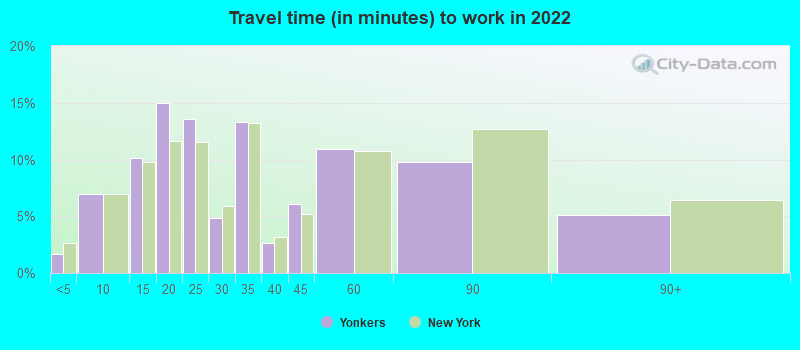
Average travel time to work
Type Columbus Yonkers
Average 26.1 min 33.9 min
Other means 21.7 min 27.4 min
Public transportation 35.4 min 52 min
Travel time to work
Time leaving to work
Travel time to work
Time leaving to work
Private vehicle occupancy
Type Columbus Yonkers
Average 1.1 1.2
Drove alone 90.7% 85.9%
In 2 person carpool 7.3% 10.4%
In 3 person carpool 1.4% 1.4%
In 4 person carpool 0.5% 1.1%
In 5-6 person carpool 0.1% 1.1%
In 7+ person carpool 0.1% 0.1%

How many people usually rode to work in the car, truck or van.

Real Estate

Real-estate in Columbus generally skews cheaper with a median home price significantly lower than the national average. Yonkers' real estate is much pricier, reflecting typical New York real estate values, but is still less expensive than in Manhattan.

Neighborhoods

Columbus possesses many character-filled neighborhoods, from the gentrified Short North to the student-heavy University District. Yonkers also offers a range of neighborhoods, from more urban settings downtown to quieter, suburban-like areas such as Woodstock Park.
Houses and residents
Type Columbus Yonkers
Houses 422,120 83,368
Average household size (people) 2.3 2.6
Median year apartment built 1982 1964
Median year house/condo built 1977 1955
Length of stay in the house since moving in 12.6 years 16.2 years
Houses occupied 390,605 (92.5%) 81,397 (97.6%)
Houses occupied by owners 175,427 (44.9%) 40,385 (49.6%)
Houses occupied by renters 215,178 (55.1%) 41,012 (50.4%)
Median rent asked for vacant for-rent units $1,371 $746.05
Median monthly housing costs $1,110 $1,515
Median price asked for vacant for-sale houses and condos $195,022 $214,056
Estimated median house or condo value $219,200 $424,100
Median numbers of rooms 5 4.5
Median number of rooms in apartments 4.2 3.8
Median number of rooms in houses and condos 6.3 5.5
Median house price - detached houses $233,452 $633,111
Median house price - in 2-unit structures $121,729 $422,890
Median house price - in 3-to-4-unit structures $215,337 $362,555
Median house price - in 5 or more unit structures $240,711 $246,208
Median house price - Townhouses or other attached units $218,726 $360,577
Median house price - All housing units $229,736 $455,533
Median house age 42 62
Renting percentage 53% 53.9%
Housing density (houses/condos per square mile) 2,007.5 4,611.9
House value disparities 30.2% 31%
Household income disparities 42.4% 48.5%
Median household income for houses/condes with a mortgage $89,058 $129,663
Median household income for apartments without a mortgage $59,295 $72,991
Housing units without a mortgage 4,290 (3.3%) 759 (3.3%)
Housing units with both a second mortgage and home equity loan 10,651 (8.2%) 2,672 (11.7%)
Housing units with a mortgage 125,487 (96.7%) 21,988 (96.7%)
Housing units with a home equity loan 775 (0.6%) 118 (0.5%)
Housing units with a second mortgage 13,558 (10.4%) 3,163 (13.9%)
House/condo owner moved in on average (years ago) 10 17
House/condo renter moved in on average (years ago) 1 5
Housing units lacking complete kitchen facilities 1.6% 0.9%
Housing units lacking complete plumbing facilities 1.3% 1.3%
Housing units in structures
Housing units in structures ColumbusYonkers
One, detached 45.8% 24.7%
One, attached 9.1% 6.3%
Two 4.0% 10.0%
3 or 4 8.6% 10.0%
5 to 9 11.8% 5.1%
10 to 19 8.6% 6.1%
20 to 49 4.5% 10.3%
50 or more 6.8% 27.3%
Mobile homes 0.8% 0.1%
Boats, RVs, vans, etc. 0.1% 0.0%
Median real estate property taxes paid for housing units
Type Columbus Yonkers
With mortgages $3,145 (1.4%) $8,610 (1.9%)
With no mortgages $2,472 (1.3%) $8,121 (2%)
Marital status
Type Columbus Yonkers
Divorced 10.2% 8.8%
Never married 45.1% 39.7%
Now married 38.4% 43.3%
Separated 2.3% 2.2%
Widowed 4% 6.1%
Class of workers - percentage
Class of Workers ColumbusYonkers
Employee of private company 70.7% 58.4%
Private not-for-profit wage and salary workers 8.8% 11.4%
State government workers 6.7% 4.6%
Local government workers 5.4% 13.3%
Self-employed workers in own not incorporated business 4.4% 5.6%
Self-employed in own incorporated business 2.2% 3.3%
Federal government workers 1.7% 3.0%
Unpaid family workers 0.2% 0.4%
Class of workers - absolute values
Class of Workers ColumbusYonkers
Employee of private company 337,898 55,914
Federal government workers 7,961 2,842
Local government workers 25,846 12,697
Private not-for-profit wage and salary workers 42,209 10,900
Self-employed in own incorporated business 10,584 3,171
Self-employed workers in own not incorporated business 20,915 5,405
State government workers 31,881 4,428
Unpaid family workers 724 337

Industries and Occupations

The diverse economy of Columbus is represented by industries such as healthcare, insurance, fashion, defense, aviation, food, logistics, steel, and many others. In Yonkers, the major industries are healthcare, retail, and educational services with many residents also working in nearby NYC.
Most common male industries
Industry ColumbusYonkers
Retail trade 11.9% 10.4%
Manufacturing 11.3% 5.4%
Transportation and warehousing 10.4% 9.3%
Professional, scientific, and technical services 8.2% 5.7%
Construction 7.8% 10.9%
Accommodation and food services 7.5% 4.2%
Health care and social assistance 7.0% 9.2%
Finance and insurance 6.8% 6.7%
Educational services 6.3% 11.3%
Administrative and support and waste management services 5.1% 2.1%
Public administration 4.0% 5.6%
Other services, except public administration 3.6% 6.3%
Wholesale trade 3.0% 2.5%
Information 2.5% 1.6%
Arts, entertainment, and recreation 2.0% 2.7%
Real estate and rental and leasing 1.2% 3.9%
Utilities 1.0% 1.3%
Management of companies and enterprises 0.2% 0.0%
Agriculture, forestry, fishing and hunting 0.2% 0.8%
Mining, quarrying, and oil and gas extraction 0.1% 0.0%
Most common female industries
Industry ColumbusYonkers
Health care and social assistance 23.8% 34.3%
Retail trade 11.7% 6.7%
Educational services 10.9% 19.3%
Finance and insurance 9.3% 5.1%
Professional, scientific, and technical services 6.7% 5.7%
Accommodation and food services 6.5% 3.2%
Manufacturing 4.8% 3.0%
Transportation and warehousing 4.7% 2.4%
Other services, except public administration 4.3% 2.6%
Administrative and support and waste management services 4.2% 2.8%
Public administration 3.8% 5.9%
Arts, entertainment, and recreation 1.8% 1.6%
Construction 1.8% 0.9%
Information 1.7% 1.8%
Real estate and rental and leasing 1.4% 3.1%
Wholesale trade 1.2% 0.6%
Utilities 0.9% 0.5%
Agriculture, forestry, fishing and hunting 0.2% 0.5%
Management of companies and enterprises 0.2% 0.0%
Most common male occupations
Occupation ColumbusYonkers
Management occupations 10.7% 12.2%
Material moving occupations 9.2% 5.4%
Office and administrative support occupations 9.1% 4.6%
Sales and related occupations 8.0% 8.1%
Computer and mathematical occupations 6.9% 0.8%
Production occupations 6.2% 3.1%
Construction and extraction occupations 6.1% 8.0%
Food preparation and serving related occupations 5.8% 5.4%
Transportation occupations 5.7% 6.2%
Business and financial operations occupations 5.5% 5.2%
Educational instruction, and library occupations 3.5% 7.2%
Building and grounds cleaning and maintenance occupations 3.4% 3.8%
Installation, maintenance, and repair occupations 3.2% 7.7%
Architecture and engineering occupations 2.8% 1.6%
Arts, design, entertainment, sports, and media occupations 2.3% 2.8%
Health diagnosing and treating practitioners and other technical occupations 1.9% 0.9%
Firefighting and prevention, and other protective service workers including supervisors 1.8% 1.7%
Life, physical, and social science occupations 1.7% 1.1%
Community and social service occupations 1.4% 1.2%
Personal care and service occupations 1.2% 2.2%
Most common female occupations
Occupation ColumbusYonkers
Office and administrative support occupations 17.1% 15.9%
Management occupations 9.2% 7.4%
Business and financial operations occupations 8.8% 5.3%
Sales and related occupations 7.3% 8.9%
Educational instruction, and library occupations 7.1% 13.7%
Health diagnosing and treating practitioners and other technical occupations 7.0% 7.8%
Healthcare support occupations 6.1% 11.4%
Food preparation and serving related occupations 4.8% 2.4%
Material moving occupations 4.4% 0.0%
Production occupations 3.7% 1.8%
Health technologists and technicians 3.3% 3.1%
Building and grounds cleaning and maintenance occupations 3.3% 2.9%
Personal care and service occupations 3.1% 3.1%
Computer and mathematical occupations 2.9% 1.2%
Arts, design, entertainment, sports, and media occupations 2.6% 1.6%
Community and social service occupations 2.5% 6.2%
Transportation occupations 1.5% 1.3%
Legal occupations 1.5% 0.6%
Life, physical, and social science occupations 1.4% 1.9%
Law enforcement workers including supervisors 0.1% 2.0%
Food environment data per 10,000 residents
Food environment statistics ColumbusYonkers
Number of convenience stores (no gas) 2.6 1.2
Number of convenience stores (with gas) 1.3 0.8
Number of full-service restaurants 6.5 9.5
Number of grocery stores 2.3 4.4
Number of supercenters and club stores 0.1 0.1
Food environment - absolute values
Food environment statistics ColumbusYonkers
Number of convenience stores (no gas) 285 111
Number of convenience stores (with gas) 146 71
Number of full-service restaurants 730 904
Number of grocery stores 251 417
Number of supercenters and club stores 11 5
Obesity and diabetes
Food environment statistics rate ColumbusYonkers
Adult diabetes rate 9.5% 7.6%
Adult obesity rate 30.2% 19.1%
Low-income preschool obesity rate 13.3% 17.8%

Health Care

Both cities have excellent health care services. Columbus is home to the Ohio State University Medical Center and other major hospitals. Yonkers residents have access to top-rated hospitals in New York City and Westchester County.
Health (county statistics)
Type Columbus Yonkers
General health status score of residents in this county from 1 (poor) to 5 (excellent) 3.5 3.7
Average weight of females (lbs) 167.2 lbs 156.1 lbs
Average weight of males (lbs) 201.7 lbs 187.8 lbs
Residents visited a dentist within the past year 72.1% 80.5%
Residents exercised in the past month 71.6% 78.5%
Adult residents drank alcohol in the past 30 days 52.4% 88.4%
Residents smoked 100+ cigarettes in their lives 41.6% 45.1%

Fatal vehicle accidents per 100,000 residents
Type Total count per 100,000Drunk per 100,000Fatal count per 100,000Pedestrian count per 100,000Person count per 100,000Vehicle count per 100,000
Year ColumbusYonkersColumbusYonkersColumbusYonkersColumbusYonkersColumbusYonkersColumbusYonkers
2021 10.5 3.8 0.0 0.0 11.3 4.8 3.5 0.5 24.2 11.0 18.1 5.7
2020 9.6 4.3 2.9 0.9 10.0 4.7 2.8 0.9 20.4 14.2 15.5 6.6
2019 8.6 3.5 2.8 0.0 9.4 3.5 3.6 2.0 18.4 5.0 13.4 4.0
2018 7.5 0.5 2.5 0.0 8.2 0.5 2.2 0.5 16.4 0.5 11.4 1.5
2017 7.1 1.5 2.3 0.0 7.4 1.5 2.4 0.0 15.3 4.5 11.6 2.5
2016 7.0 4.0 3.2 1.0 7.0 4.0 2.5 1.5 15.3 10.0 11.2 6.5
2015 6.5 6.5 2.6 1.5 7.1 7.0 1.9 2.5 15.0 11.5 11.0 9.0
2014 6.0 3.0 2.5 1.0 6.3 3.0 2.2 0.0 12.4 5.5 10.3 5.5
2013 5.3 3.5 1.6 0.5 6.1 3.5 1.3 1.5 12.6 14.0 8.8 10.5
2012 6.9 2.5 2.8 0.5 7.9 3.0 2.1 1.0 16.5 6.0 11.6 5.5
2011 7.4 3.0 1.9 1.0 7.8 3.5 3.1 1.0 15.2 6.6 11.5 5.6
2010 6.6 2.0 2.2 1.5 6.9 2.0 1.8 0.5 15.9 2.6 11.4 2.6
2009 7.3 4.0 2.9 1.0 7.7 4.0 1.8 0.5 18.6 12.4 12.0 7.5
2008 8.6 4.0 3.6 1.0 9.2 4.0 2.9 1.5 25.5 14.0 14.9 7.0
2007 7.3 2.5 3.1 0.5 7.9 3.0 1.7 0.5 16.1 5.6 11.1 4.0
2006 6.3 3.0 2.6 1.0 6.7 3.0 1.3 0.5 16.0 7.1 11.4 4.0
2005 8.3 4.0 2.8 0.5 8.4 4.0 1.8 1.5 21.7 8.6 13.7 5.0
2004 7.7 3.0 1.9 1.0 8.3 3.0 1.5 0.5 19.3 8.1 12.1 4.0
2003 7.6 3.0 3.5 0.0 8.2 3.0 1.8 1.5 24.1 9.6 13.1 3.0
2002 7.7 7.1 2.6 1.5 8.5 8.1 1.2 5.0 17.7 20.7 11.4 10.6
2001 9.7 5.1 3.0 0.5 10.2 6.1 2.9 1.5 28.2 13.1 16.0 5.6
2000 6.5 6.1 1.5 3.1 6.5 6.1 1.4 2.0 16.4 20.9 10.0 12.2
1999 9.4 4.7 3.6 0.5 9.8 4.7 2.2 1.6 25.2 14.6 14.6 6.3
1998 7.6 3.7 2.2 1.0 8.8 4.2 2.1 1.6 22.7 7.9 12.5 3.7
1997 7.5 4.7 2.7 1.0 8.2 5.2 2.7 1.0 19.0 11.5 11.7 6.8
1996 7.4 4.2 2.9 1.1 7.5 4.2 1.7 3.2 22.3 8.9 11.8 4.2
1995 6.8 6.3 1.5 1.6 7.1 6.3 2.0 2.1 16.5 16.3 9.5 6.8
1994 5.0 4.7 1.4 0.5 5.2 5.8 2.1 4.7 11.7 14.7 7.3 4.7
1993 6.9 5.3 2.4 0.5 7.3 5.3 2.9 2.1 17.5 11.6 9.9 7.4
1992 5.5 6.3 0.3 0.5 5.7 6.9 1.5 3.2 13.5 20.6 8.6 9.5
1991 7.3 6.4 1.5 2.1 8.4 6.9 1.1 3.7 18.1 18.1 10.7 10.1
1990 5.3 5.8 1.4 0.5 5.3 5.8 0.0 0.0 12.1 11.7 7.2 6.4
1989 8.8 11.1 1.1 3.2 9.6 12.7 0.0 0.0 23.8 26.5 14.5 15.4
1988 10.0 9.0 4.8 2.6 11.6 9.5 0.0 0.0 23.7 30.1 14.9 12.1
1987 10.4 6.3 3.8 0.5 10.8 6.8 0.0 0.0 27.8 20.0 17.8 11.0
1986 8.9 11.0 5.4 1.0 9.2 11.5 0.0 0.0 19.8 34.6 12.2 14.1
1985 8.7 7.3 4.2 3.7 9.3 7.8 0.0 0.0 22.2 17.2 13.7 7.8
1984 11.5 7.3 4.9 2.6 12.2 7.8 0.0 0.0 27.2 21.8 17.1 10.9
1983 7.7 7.2 3.8 1.0 8.4 7.8 0.0 0.0 18.6 21.7 11.8 10.4
1982 10.7 6.2 4.1 2.6 11.2 6.2 0.0 0.0 25.6 16.5 15.2 7.7
1981 12.1 9.2 3.0 6.7 13.5 11.8 0.0 0.0 30.4 30.3 18.2 14.9
1980 13.6 6.7 3.2 0.5 14.7 6.7 0.0 0.0 30.8 13.3 19.1 8.2
1979 11.2 4.6 2.3 0.5 12.8 4.6 0.0 0.0 27.0 8.7 17.4 3.6
1978 10.2 9.1 2.9 1.5 11.4 9.1 0.0 0.0 24.8 18.3 14.3 10.7
1977 9.5 7.1 2.5 0.5 10.2 7.1 0.0 0.0 20.8 15.1 12.9 8.1
1976 8.3 12.1 0.0 2.5 9.4 13.6 0.0 0.0 21.3 29.7 11.9 13.6
1975 8.3 12.0 0.0 2.5 9.4 13.5 0.0 0.0 21.4 29.5 11.9 13.5

Fatal vehicle accidents
Type Total countDrunkFatal countPedestrian countPerson countVehicle count
Year ColumbusYonkersColumbusYonkersColumbusYonkersColumbusYonkersColumbusYonkersColumbusYonkers
1975 46 24 0 5 52 27 0 0 118 59 66 27
1976 46 24 0 5 52 27 0 0 118 59 66 27
1977 53 14 14 1 57 14 0 0 116 30 72 16
1978 57 18 16 3 64 18 0 0 139 36 80 21
1979 63 9 13 1 72 9 0 0 152 17 98 7
1980 77 13 18 1 83 13 0 0 174 26 108 16
1981 69 18 17 13 77 23 0 0 174 59 104 29
1982 62 12 24 5 65 12 0 0 148 32 88 15
1983 45 14 22 2 49 15 0 0 109 42 69 20
1984 68 14 29 5 72 15 0 0 161 42 101 21
1985 52 14 25 7 56 15 0 0 133 33 82 15
1986 54 21 33 2 56 22 0 0 120 66 74 27
1987 64 12 23 1 66 13 0 0 170 38 109 21
1988 62 17 30 5 72 18 0 0 147 57 92 23
1989 55 21 7 6 60 24 0 0 149 50 91 29
1990 34 11 9 1 34 11 0 0 77 22 46 12
1991 47 12 10 4 54 13 7 7 117 34 69 19
1992 36 12 2 1 37 13 10 6 88 39 56 18
1993 45 10 16 1 48 10 19 4 115 22 65 14
1994 33 9 9 1 34 11 14 9 77 28 48 9
1995 45 12 10 3 47 12 13 4 109 31 63 13
1996 49 8 19 2 50 8 11 6 148 17 78 8
1997 50 9 18 2 55 10 18 2 127 22 78 13
1998 51 7 15 2 59 8 14 3 152 15 84 7
1999 63 9 24 1 66 9 15 3 169 28 98 12
2000 46 12 11 6 46 12 10 4 117 41 71 24
2001 70 10 22 1 74 12 21 3 204 26 116 11
2002 56 14 19 3 62 16 9 10 129 41 83 21
2003 56 6 26 0 60 6 13 3 177 19 96 6
2004 57 6 14 2 61 6 11 1 142 16 89 8
2005 61 8 21 1 62 8 13 3 160 17 101 10
2006 47 6 19 2 50 6 10 1 119 14 85 8
2007 55 5 23 1 59 6 13 1 121 11 83 8
2008 65 8 27 2 70 8 22 3 194 28 113 14
2009 56 8 22 2 59 8 14 1 143 25 92 15
2010 52 4 17 3 54 4 14 1 125 5 90 5
2011 59 6 15 2 62 7 25 2 121 13 92 11
2012 56 5 23 1 64 6 17 2 134 12 94 11
2013 44 7 13 1 50 7 11 3 104 28 72 21
2014 50 6 21 2 53 6 18 0 104 11 86 11
2015 56 13 22 3 61 14 16 5 128 23 94 18
2016 61 8 28 2 61 8 22 3 133 20 97 13
2017 63 3 20 0 65 3 21 0 135 9 102 5
2018 67 1 22 0 73 1 20 1 146 1 102 3
2019 77 7 25 0 85 7 32 4 166 10 121 8
2020 87 9 26 2 91 10 25 2 185 30 140 14
2021 95 8 0 0 102 10 32 1 219 23 164 12
Police full-time law enforcement employees
Year ColumbusYonkers
2021 0 694
2020 2,277 688
2019 0 681
2018 2,255 669
2017 1,937 689
2016 0 696
2015 2,205 702
2014 2,203 693
2013 2,181 694
2012 2,138 677
2011 2,114 694
2010 0 659
2009 2,179 695
2008 0 726
2007 0 722
2006 2,178 682
2005 2,136 685
2004 0 690
2003 2,150 694
Police full-time law enforcement employees (per 1,000 residents)
Year ColumbusYonkers
2021 0.0 3.5
2020 2.5 3.4
2019 0.0 3.4
2018 2.5 3.3
2017 2.2 3.4
2016 0.0 3.4
2015 2.6 3.5
2014 2.7 3.5
2013 2.7 3.5
2012 2.7 3.4
2011 2.7 3.5
2010 0.0 3.4
2009 2.9 3.4
2008 0.0 3.6
2007 0.0 3.6
2006 3.0 3.5
2005 2.9 3.5
2004 0.0 3.5
2003 3.0 3.5
Local government: full-time employees
Job ColumbusYonkers
Correction 71 25
Financial administration 312 123
Firefighters 1,574 433
Fire - other 50 5
Health 431 0
Judicial and legal 453 23
Other and unallocable 408 63
Other government administration 571 115
Parks and recreation 326 89
Police - other 368 99
Police protection - officers 1,925 609
Sewerage 429 33
Solid waste management 199 155
Streets and highways 461 59
Totals for government 8,465 6,138
Water supply 412 70
Welfare 309 70
Local government: part-time employees
Job ColumbusYonkers
Correction 4 0
Financial administration 9 9
Fire - other 7 2
Health 45 0
Judicial and legal 32 1
Other and unallocable 33 1
Other government administration 33 9
Parks and recreation 398 142
Police - other 10 33
Sewerage 2 0
Solid waste management 0 15
Streets and highways 7 1
Totals for government 608 388
Water supply 11 2
Welfare 15 31
Place of birth - Foreign born
Residents ColumbusYonkers
All residents 15.1% 29.2%
American Indian / Alaska Native residents 44.9% 43.2%
Asian residents 76.3% 75.9%
Black or African American residents 20.9% 18.4%
Native Hawaiian / Pacific Islander residents 5.8% 24.5%
Other race residents 38.8% 46.3%
Two or more races residents 13.7% 39.2%
White residents 3.5% 19.0%
White alone, not Hispanic / Latino residents 3.4% 19.2%
Place of birth - Native, outside of US
Residents ColumbusYonkers
All residents 1.6% 4.2%
American Indian / Alaska Native residents 3.4% 8.2%
Asian residents 0.7% 2.9%
Black or African American residents 1.6% 1.5%
Other race residents 4.8% 6.8%
Two or more races residents 2.4% 4.7%
White residents 1.0% 4.3%
White alone, not Hispanic / Latino residents 0.6% 2.1%
Place of birth - Born in state of residence
Residents ColumbusYonkers
All residents 62.5% 58.8%
American Indian / Alaska Native residents 37.9% 47.3%
Asian residents 14.2% 20.9%
Black or African American residents 59.3% 66.9%
Native Hawaiian / Pacific Islander residents 82.5% 0.0%
Other race residents 38.8% 43.5%
Two or more races residents 65.3% 47.4%
White residents 71.0% 67.2%
White alone, not Hispanic / Latino residents 71.2% 68.8%
Place of birth - Born in other state
Residents ColumbusYonkers
All residents 20.8% 7.8%
American Indian / Alaska Native residents 13.7% 1.3%
Asian residents 8.8% 0.3%
Black or African American residents 18.2% 13.2%
Native Hawaiian / Pacific Islander residents 11.7% 75.5%
Other race residents 17.6% 3.3%
Two or more races residents 18.6% 8.8%
White residents 24.5% 9.5%
White alone, not Hispanic / Latino residents 24.8% 10.0%
English speakers (speaking English at home)
Type Columbus Yonkers
Born in the United States residents 93.7% 77.6%
Foreign born residents 16.6% 19.7%
Native, born elsewhere residents 56.3% 26.4%
Total residents 83.6% 52.1%
Mechanisms of suicide per 1,000,000 residents
Mechanism ColumbusYonkers
Suicides from 2000 to 2006 100.0 44.0
Fall 2.9 4.1
Firearm 47.6 13.8
Poisoning 19.6 6.5
Suffocation 24.0 12.9

Infrastructure

Columbus boasts a solid infrastructure for a mid-sized city. It has a robust freeway system and an international airport. Yonkers enjoys a more urbanized infrastructure with well-maintained roads, bridges, and public buildings due to its urban nature and connection with NYC.
Infrastructure
Type Columbus Yonkers
Hospitals 47 7
TV stations 14 30
Bank branches located here 200 52
Bank institutions located here 25 16
Main business address for public companies 23 4
Drinking water stations with no reported violations in the past 17 0
Drinking water stations with reported violations in the past 40 1

Schools

School facilities
Type Columbus Yonkers
Private elementary/middle schools 34 15
Private high schools 12 5
Public elementary/middle schools 162 32
Public high schools 64 9
Colleges/Universities 37 2
HMDA - Conventional home purchase loans - Applications denied
Year ColumbusYonkers
1999 2,450 379
2000 2,376 529
2001 1,897 366
2002 1,483 362
2003 2,087 470
2004 3,216 649
2005 4,275 799
2006 4,662 999
2007 2,679 748
2008 1,015 472
2009 555 271

Culture and Food

Columbus offers a diverse food scene, multiple festivals, and is home to one of the largest fairs in the country. Yonkers also has a diverse culture, being so close to NYC, and offers a wealth of dining, shopping, and entertainment venues.

Sports Teams

Columbus is home to the Buckeyes of the Ohio State University, as well as professional hockey and soccer teams. Yonkers doesn't have its own professional sports teams, but New York City’s sports teams are readily accessible.