Dallas, Texas and Buffalo, New York are both unique cities with distinct characteristics that contribute to their overall charm. Dallas promises warmer weather, a growing economy and a more animated urban lifestyle, whilst Buffalo offers a smaller, friendly city with a great cost of living, rich history and culture. Whether you plan to visit or permanently relocate, these cities present a diverse range of experiences that may befit prospective tourists and residents. Here, we compare these two cities on various aspects including crime/safety, weather, cost of living, among others.
Distance between
Dallas, TX and
Buffalo, NY : 1,197.9 miles
Dallas's population is larger by 366%. Its population has grown by 99,877 people (8.4%) since 2000. The population of Buffalo has decreased by 15,841 people (5.4%) during that time.
Dallas, TX has higher crime rates compared to national averages, particularly in property crime. However, most crimes are concentrated in specific neighborhoods. In comparison, Buffalo, NY, has a lower crime rate compared to Dallas, but it's also somewhat higher than the national average. Downtown Buffalo and university areas are generally safer. It's always important to research neighborhoods before relocation.
City-data.com crime index counts serious crimes and violent crime more heavily. It adjusts for the number of visitors and daily workers commuting into cities. (higher means more crime, U.S. average = 301.1)
City-data.com crime index counts serious crimes and violent crime more heavily. It adjusts for the number of visitors and daily workers commuting into cities. (higher means more crime, U.S. average = 301.1)
Sex Offenders
According to our data, there are 4,297 registered sex offenders living in Dallas and 720 registered sex offenders living in . The ratio of residents to sex offenders in Dallas is 307 to 1; the ratio in Buffalo is 357 to 1. The number of registered sex offenders compared to the number of residents in Dallas is near to than in Buffalo.
Cost of Living
When it comes to cost of living, Buffalo NY wins hands down. This city’s cost of living is significantly lower than the national average, with housing being the most affordable sector. Dallas, though less expensive than many other major US cities, is pricier than Buffalo, with housing and transportation being higher.
Income Tax
Texas has no state income tax making Dallas attractive for high earning individuals. New York State's income tax ranges from 4% to 8.82%.
Property Tax
Property taxation in Dallas is higher than the national average. Buffalo's property taxes are also high, especially considering home values, but several tax exemption programs exist to offset these costs.
Sales Tax
Sales tax in Dallas, Texas stands at 8.25% compared to Buffalo, New York’s 8.75%. While the difference isn’t much, it is worth noting for those planning a budget.
Income
Type
Dallas
Buffalo
Estimated median household income
$57,995
$40,669
Estimated per capita income
$38,479
$27,269
Cost of living index (U.S. average is 100)
96.1
101.9
If you make $50,000 in Dallas, you will have to make $53,018 in Buffalo to maintain the same standard of living.
Geographical Conditions
Dallas is located in a flat prairie landscape with few natural lakes. Buffalo is located at the eastern end of Lake Erie and boasts an array of parks and recreational spaces.
Dallas’s educational structure is serviced by a large number of public and private institutions. Notably, it’s home to the University of Texas Southwestern Medical Center, a globally renowned medical institution. Buffalo is renowned for its strong educational sector, including the University at Buffalo (SUNY), one of the nation's top public research institutions.
Dallas's economy is robust and diverse, with major industries being financial services, information technology, and healthcare. Buffalo, once an industrial powerhouse, is now experience economic renewal. While the growth is slower compared to Dallas, fields like healthcare, education, and tech are developing.
Biggest Employers
In Dallas, the biggest employers are AT&T, American Airlines, and the Baylor Healthcare System. Buffalo's largest employers are the State of New York, Kaleida Health and Federal government.
There were 2,245 building permits issued in Dallas in 2012 (1436 more than in 2011) compared to 35 building permits issued in Buffalo in 2012 (29 more than in 2011).
In Dallas (Dallas County), 57.3% voted for Democrats and 41.8% for Republicans in 2012 Presidential Election. In Buffalo (Erie County), 57.4% voted for Democrats and 41.0% for Republicans.
Elections
Type
Democrats
Republicans
Other
Year
Dallas
Buffalo
Dallas
Buffalo
Dallas
Buffalo
2020
65.1%
56.3%
33.4%
41.6%
1.4%
2.1%
2016
60.8%
51.0%
34.7%
44.5%
4.5%
4.5%
2012
57.3%
57.4%
41.8%
41.0%
1.0%
1.6%
2008
57.4%
58.2%
42.0%
40.6%
0.6%
1.3%
2004
49.0%
56.5%
50.4%
41.5%
0.5%
1.9%
2000
45.0%
56.7%
52.7%
37.8%
2.4%
5.5%
1996
46.0%
54.7%
46.8%
32.3%
7.2%
13.0%
Breakdown of population affiliated with a religious congregation
Type
Adherents
Congregations
Religion
Dallas
Buffalo
Dallas
Buffalo
CATHOLIC CHURCH
18.9%
38.4%
2.4%
15.8%
SOUTHERN BAPTIST CONVENTION
11.0%
0.2%
31.1%
2.5%
MUSLIM ESTIMATE
3.6%
1.8%
1.1%
1.9%
EPISCOPAL CHURCH
1.0%
0.8%
1.5%
4.4%
SEVENTH DAY ADVENTIST CHURCH
0.5%
0.1%
1.7%
0.6%
EVANGELICAL LUTHERAN CHURCH IN AMERICA
0.3%
1.7%
0.9%
4.9%
LUTHERAN CHURCH
0.3%
0.9%
0.7%
3.3%
AMERICAN BAPTIST CHURCHES IN THE USA
0.1%
0.8%
0.2%
3.6%
Weather
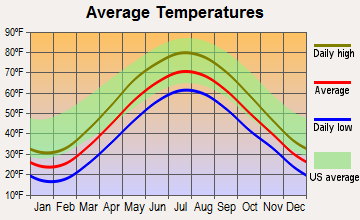
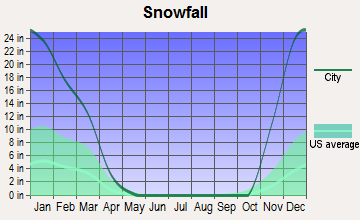
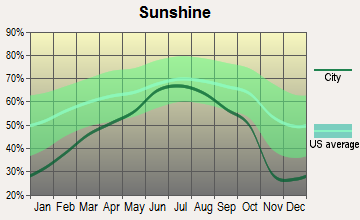
With regard to weather, Dallas, Texas is known for its hot summers and mild winters. Buffalo, New York, on the other hand, is famous for its harsh winters and snowfalls, yet pleasant and cooler summers. If you love sunshine, Dallas would be a better choice, but Buffalo could appeal to those who enjoy winter sports and a cooler climate.
Weather and climate
Type
Dallas
Buffalo
Temperature - Average
66.6°F
47.7°F
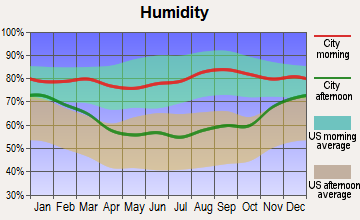
Humidity - Average morning or afternoon humidity
71.3%
76.3%
Humidity - Differences between morning and afternoon humidity
34%
28%
Humidity - Maximum monthly morning or afternoon humidity
82%
83%
Humidity - Minimum monthly morning or afternoon humidity
48%
55%
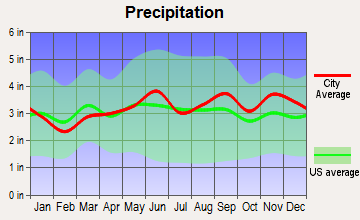
Precipitation - Yearly average
37.3 in
38.7 in
Snowfall - Yearly average
4.2 in
183.7 in
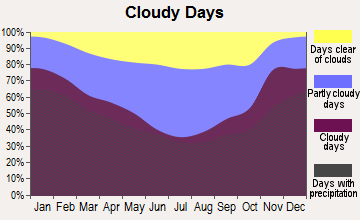
Clouds - Number of days clear of clouds
22.8%
8.9%
Sunshine amount - Average
66.6%
51.3%
Sunshine amount - Differences during a year
20%
43%
Sunshine amount - Maximum monthly
74%
66%
Sunshine amount - Minimum monthly
54%
23%
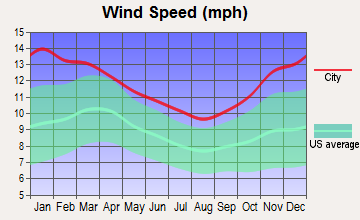
Wind speed - Average
10.3 mph
11.2 mph
Average climate in Dallas, Texas
Average climate in Buffalo, New York
Air pollution
Type
AQI
CO
NO2
OZONE
PB
PM25
SO2
Year
Dallas
Buffalo
Buffalo
Dallas
Buffalo
Dallas
Buffalo
Dallas
Buffalo
Dallas
Buffalo
Dallas
Buffalo
2018
86
62
0.26
N/A
5.7
N/A
28.7
30.2
N/A
N/A
9.7
7.5
0.4
0.4
2017
84
68
0.32
N/A
5.5
N/A
28.6
29.8
N/A
N/A
9.1
7.5
0.3
0.4
2016
81
71
0.30
N/A
6.1
N/A
27.2
31.7
N/A
N/A
8.4
7.7
0.2
0.5
2015
85
69
0.35
N/A
6.5
N/A
26.7
30.2
N/A
N/A
8.9
8.8
0.3
1.1
2014
83
69
0.39
N/A
6.3
N/A
27.6
30.7
N/A
N/A
9.9
8.6
0.3
1.5
2013
97
73
0.33
N/A
7.3
N/A
28.8
31.4
N/A
N/A
13.0
9.0
0.2
2.4
2012
116
83
0.34
N/A
8.6
6.4
31.0
30.5
N/A
N/A
12.0
9.4
0.3
2.7
2011
98
82
0.41
N/A
9.4
8.3
30.9
28.8
N/A
N/A
11.9
8.9
0.6
2.0
2010
79
85
0.35
N/A
9.4
8.3
28.3
30.6
N/A
N/A
N/A
10.3
0.7
1.5
2009
88
78
0.28
N/A
9.2
7.4
28.8
28.7
N/A
N/A
N/A
9.8
0.5
1.7
2008
88
90
0.36
N/A
9.8
9.5
29.2
29.5
0.121
N/A
N/A
11.4
0.5
2.3
2007
94
97
0.38
N/A
11.0
10.2
25.7
29.5
0.070
N/A
N/A
12.4
0.3
2.7
2006
107
76
0.38
N/A
10.8
10.5
30.6
27.4
0.106
N/A
N/A
N/A
0.7
2.8
2005
108
94
0.41
N/A
13.0
12.3
29.7
29.7
0.142
N/A
11.0
N/A
0.9
3.8
2004
96
76
0.43
N/A
12.3
11.9
26.0
27.6
0.099
N/A
N/A
N/A
0.8
3.4
2003
102
89
0.50
N/A
13.6
13.0
27.1
27.6
0.121
0.005
N/A
N/A
1.0
5.5
2002
100
100
0.46
N/A
14.0
13.4
25.2
30.5
0.080
0.008
N/A
N/A
0.4
5.8
2001
100
93
0.46
N/A
14.3
15.2
26.0
27.9
0.069
0.021
N/A
N/A
1.0
7.2
2000
109
85
0.53
N/A
14.5
15.3
27.0
25.6
0.092
0.023
N/A
N/A
1.1
6.8
Natural disasters
Type
Dallas
Buffalo
Tornado activity compared to U.S. average
254.7%
26.3%
Earthquake activity compared to U.S. average
567%
32.9%
Natural disasters compared to U.S. average
21%
22%
Transportation
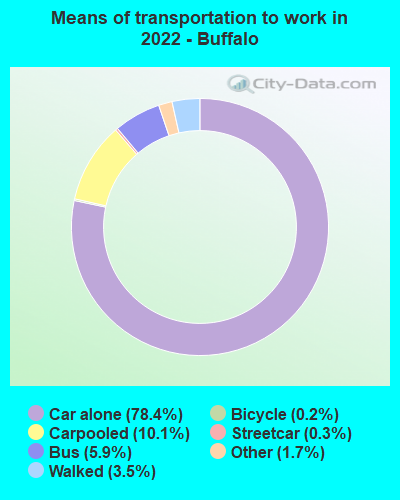
Dallas relies heavily on car travel but does offer a light rail system. Buffalo has a more extensive public transit system, including a metro rail and extensive bus networks that covers most of the city.
Transport
Type
Dallas
Buffalo
Amtrak stations
1
0
Amtrak stations nearby
1
3
FAA registered aircraft
2
87
FAA registered aircraft manufacturers and dealers
56
1
Means of transportation to work
Type
Dallas
Buffalo
Bicycle
0.3%
0.5%
Bus
1.4%
5.8%
Carpooled
10.9%
7.8%
Car alone
83.9%
80.5%
Railroad
0.2%
0.2%
Streetcar
0.1%
0.3%
Subway
0.2%
0.6%
Taxicab
0.1%
0.3%
Walked
1.6%
3.1%
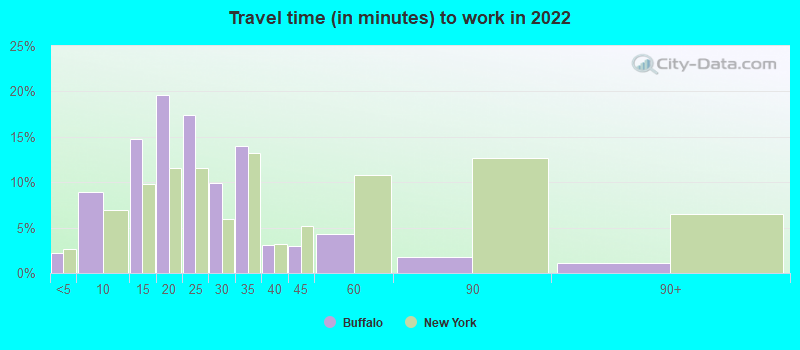
Average travel time to work
Type
Dallas
Buffalo
Average
31.5 min
23.8 min
Other means
26.5 min
19.9 min
Public transportation
46 min
36.6 min
Private vehicle occupancy
Type
Dallas
Buffalo
Average
1.2
1.1
Drove alone
86.8%
89.9%
In 2 person carpool
9%
6.9%
In 3 person carpool
2.6%
2.6%
In 4 person carpool
0.9%
0.3%
In 5-6 person carpool
0.5%
0.2%
In 7+ person carpool
0.2%
0.1%
How many people usually rode to work in the car, truck or van.
Real Estate
Real estate prices in Dallas are comparatively higher, with the median home value well above Buffalo’s. On the other hand, Buffalo real estate remains affordable, standing significantly lower than the national average.
Neighborhoods
Dallas is known for its vibrant neighborhoods such as Deep Ellum known for its arts scene and nightlife, and Highland Park known for its luxury homes. Buffalo has Elmwood Village which is known for its shopping and dining, and North Buffalo for its quiet, family-friendly environment.
Houses and residents
Type
Dallas
Buffalo
Houses
591,773
137,222
Average household size (people)
2.6
2.2
Length of stay in the house since moving in
13.9 years
15.8 years
Houses occupied
536,008 (90.6%)
122,569 (89.3%)
Houses occupied by owners
229,518 (42.8%)
54,108 (44.1%)
Houses occupied by renters
306,490 (57.2%)
68,461 (55.9%)
Median rent asked for vacant for-rent units
$1,403
$372.33
Median monthly housing costs
$1,225
$812
Median price asked for vacant for-sale houses and condos
$574,934
$283,454
Estimated median house or condo value
$267,600
$155,200
Median numbers of rooms
4.6
5.6
Median number of rooms in apartments
3.7
4.9
Median number of rooms in houses and condos
6.1
6.5
Median house price - detached houses
$410,272
$160,989
Median house price - in 2-unit structures
$255,160
$176,595
Median house price - in 3-to-4-unit structures
$230,927
$166,381
Median house price - in 5 or more unit structures
$444,589
$451,923
Median house price - mobile homes
$91,039
$51,009
Median house price - Townhouses or other attached units
$350,045
$280,424
Median house price - All housing units
$402,215
$172,704
Median house age
40
2,021
Renting percentage
55.9%
59.3%
Housing density (houses/condos per square mile)
1,727.6
3,378.8
House value disparities
41.3%
44.5%
Household income disparities
48.2%
50.4%
Median household income for houses/condes with a mortgage
$103,798
$78,318
Median household income for apartments without a mortgage
$61,909
$50,382
Housing units without a mortgage
1,309 (1%)
2,243 (7.7%)
Housing units with both a second mortgage and home equity loan
3,320 (2.6%)
1,953 (6.7%)
Housing units with a mortgage
124,846 (99%)
26,930 (92.3%)
Housing units with a home equity loan
204 (0.2%)
69 (0.2%)
Housing units with a second mortgage
5,351 (4.2%)
2,377 (8.1%)
House/condo owner moved in on average (years ago)
12
16
House/condo renter moved in on average (years ago)
1
3
Housing units lacking complete kitchen facilities
1.2%
5.5%
Housing units lacking complete plumbing facilities
0.9%
1.9%
Housing units in structures
Housing units in structures
Dallas
Buffalo
One, detached
41.8%
39.4%
One, attached
4.3%
2.7%
Two
1.5%
34.2%
3 or 4
4.9%
8.0%
5 to 9
7.9%
3.3%
10 to 19
12.1%
2.6%
20 to 49
8.1%
3.4%
50 or more
18.4%
6.1%
Mobile homes
1.0%
0.0%
Boats, RVs, vans, etc.
0.0%
0.2%
Median real estate property taxes paid for housing units
Self-employed workers in own not incorporated business
43,703
5,576
State government workers
17,325
6,135
Unpaid family workers
754
313
Industries and Occupations
Dallas is a major hub for high-tech industries, with companies in telecommunications, computer technology, and life sciences dominating. Buffalo's economy relies heavily on healthcare and education with steady growth in tech sector.
Dallas has some of the best healthcare facilities in the nation while Buffalo's healthcare system is respected, notably the Roswell Park Comprehensive Cancer center.
Health (county statistics)
Type
Dallas
Buffalo
General health status score of residents in this county from 1 (poor) to 5 (excellent)
Dallas hosts a robust and modern infrastructure that supports a rapidly growing population. Conversely, Buffalo boasts an extensive collection of historical buildings and infrastructure, giving it a charming old-city feel.
Infrastructure
Type
Dallas
Buffalo
Hospitals
74
15
TV stations
25
14
Arenas or stadiums
2
2
Bank branches located here
394
69
Bank institutions located here
80
10
Main business address for public companies
122
6
Drinking water stations with no reported violations in the past
8
4
Drinking water stations with reported violations in the past
HMDA - Conventional home purchase loans - Applications denied
Year
Dallas
Buffalo
1999
5,030
426
2000
3,390
620
2001
2,626
559
2002
2,657
407
2003
3,617
335
2004
5,460
468
2005
7,445
447
2006
7,397
701
2007
5,056
619
2008
2,200
316
2009
1,121
105
Culture and Food
Dallas is known for its lively cultural scene with great emphasis on music, arts and food. Buffalo has a rich cultural heritage best exemplified by its numerous festivals and iconic food offerings like Buffalo wings.
Sports Teams
Dallas is big on sports, hosting teams like the Dallas Cowboys (NFL), and the Dallas Mavericks (NBA). Buffalo is known for its passionate support of the Buffalo Bills (NFL) and Buffalo Sabres (NHL).


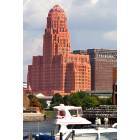

 Dallas, TX
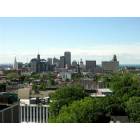
 Buffalo, NY