Overview
Comparing Dallas, the state's third largest city, with Corpus Christi, a coastal port, we notice stark contrasts across many domains. Whether it's the bustling city life of Dallas versus Corpus Christi's quieter beach town vibe, or the differences in economy, cost of living, and education, each city encapsulates a unique Texan experience. Tourists and those contemplating relocation will need to weigh these distinctions carefully to decide what best suits their needs.
Distance between
Dallas, TX and
Corpus Christi, TX : 351.3 miles
Dallas's population is larger by 306%. Its population has grown by 99,877 people (8.4%) since 2000. The population of Corpus Christi has grown by 40,319 people (14.5%) during that time.
Dallas' crime rate is higher than the national average, particularly in certain neighborhoods. However, efforts are on the way to enhance safety, including additional police units and community initiatives. Corpus Christi, while having a slightly higher crime rate compared to the rest of Texas, has a lower crime rate than Dallas. Its crime tends to be concentrated in certain areas as well, which can be avoided.
City-data.com crime index counts serious crimes and violent crime more heavily. It adjusts for the number of visitors and daily workers commuting into cities. (higher means more crime, U.S. average = 301.1)
City-data.com crime index counts serious crimes and violent crime more heavily. It adjusts for the number of visitors and daily workers commuting into cities. (higher means more crime, U.S. average = 301.1)
Sex Offenders
According to our data, there are 4,271 registered sex offenders living in Dallas and 1,070 registered sex offenders living in . The ratio of residents to sex offenders in Dallas is 309 to 1; the ratio in Corpus Christi is 304 to 1. The number of registered sex offenders compared to the number of residents in Dallas is near to than in Corpus Christi.
Cost of Living
The cost of living in Dallas is slightly higher than in Corpus Christi mainly due to the cost of housing. However, Dallas offers more job opportunities and higher salaries, which can offset this higher cost. Corpus Christi has a lower cost of living but also lower average salaries.
Income Tax
Texas doesn't impose state income tax, which applies equally to both Dallas and Corpus Christi.
Property Tax
Dallas has higher property taxes compared to Corpus Christi. This is something potential residents should keep in mind when considering the cost of homeownership.
Sales Tax
Both cities are subject to Texas’ base 6.25% sales tax, with Dallas having an added 2% and Corpus an additional 1.5% to fund local services.
Income
Type
Dallas
Corpus Christi
Estimated median household income
$57,995
$59,812
Estimated per capita income
$38,479
$29,969
Cost of living index (U.S. average is 100)
96.1
86.6
If you make $50,000 in Corpus Christi, you will have to make $55,485 in Dallas to maintain the same standard of living.
Geographical Conditions
Dallas is landlocked and relatively flat, while Corpus Christi boasts a coastal location with beaches, islands, and a bay.
Dallas is home to renowned universities like Southern Methodist University, the University of Texas Dallas and Dallas Baptist University. The Dallas Independent School District, however, faces challenges regarding performance and equity. Corpus Christi, while hosting fewer higher education institutions, boasts a higher average school rating.
Dallas is an economic powerhouse, with diverse industries like technology, healthcare, finance, and telecommunications. Corpus Christi's economy is centered around oil, refining, tourism, and shipping. The job market in Dallas is more dynamic and offers more opportunities, so if you're looking for career growth, Dallas might be the better choice.
Biggest Employers
Dallas is home to companies like AT&T, Southwest Airlines, and Texas Health Resources. In Corpus Christi, the largest employers are the healthcare system, school districts, and the Naval Air Station.
There were 2,245 building permits issued in Dallas in 2012 (1436 more than in 2011) compared to 1,470 building permits issued in Corpus Christi in 2012 (839 more than in 2011).
In Dallas (Dallas County), 57.3% voted for Democrats and 41.8% for Republicans in 2012 Presidential Election. In Corpus Christi (Nueces County), 47.6% voted for Democrats and 51.0% for Republicans.
Elections
Type
Democrats
Republicans
Other
Year
Dallas
Corpus Christi
Dallas
Corpus Christi
Dallas
Corpus Christi
2020
65.1%
47.9%
33.4%
50.8%
1.4%
1.4%
2016
60.8%
47.2%
34.7%
48.8%
4.5%
4.0%
2012
57.3%
47.6%
41.8%
51.0%
1.0%
1.4%
2008
57.4%
47.4%
42.0%
51.8%
0.6%
0.8%
2004
49.0%
42.6%
50.4%
56.9%
0.5%
0.4%
2000
45.0%
46.7%
52.7%
51.4%
2.4%
1.9%
1996
46.0%
53.7%
46.8%
40.2%
7.2%
6.1%
Breakdown of population affiliated with a religious congregation
Type
Adherents
Congregations
Religion
Dallas
Corpus Christi
Dallas
Corpus Christi
CATHOLIC CHURCH
18.9%
32.8%
2.4%
10.8%
SOUTHERN BAPTIST CONVENTION
11.0%
10.6%
31.1%
28.6%
MUSLIM ESTIMATE
3.6%
0.7%
1.1%
0.3%
EPISCOPAL CHURCH
1.0%
0.8%
1.5%
2.0%
SEVENTH DAY ADVENTIST CHURCH
0.5%
0.2%
1.7%
0.9%
EVANGELICAL LUTHERAN CHURCH IN AMERICA
0.3%
0.3%
0.9%
1.1%
LUTHERAN CHURCH
0.3%
0.5%
0.7%
1.7%
SALVATION ARMY
0.2%
0.5%
0.3%
0.3%
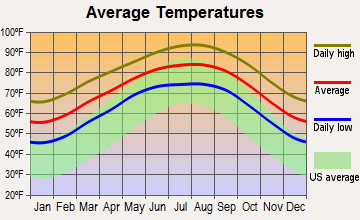
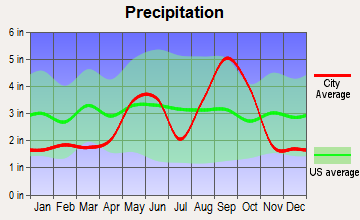
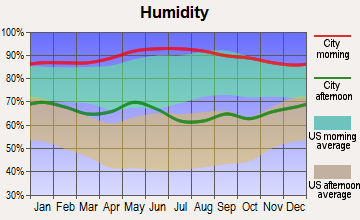
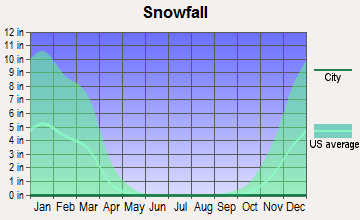
Weather
Dallas experiences a humid subtropical climate with hot summers and mild winters, while Corpus Christi enjoys a more moderate climate due to its coastal location. Tourists and potential residents who love beach climates and milder summers might prefer Corpus Christi.
Weather and climate
Type
Dallas
Corpus Christi
Temperature - Average
66.6°F
71.5°F
Humidity - Average morning or afternoon humidity
71.3%
81.5%
Humidity - Differences between morning and afternoon humidity
34%
37%
Humidity - Maximum monthly morning or afternoon humidity
82%
93%
Humidity - Minimum monthly morning or afternoon humidity
48%
56%
Precipitation - Yearly average
37.3 in
32.6 in
Snowfall - Yearly average
4.2 in
0.2 in
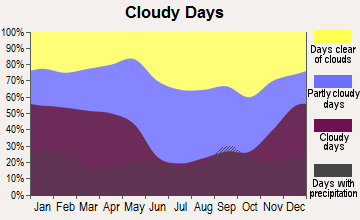
Clouds - Number of days clear of clouds
22.8%
17%
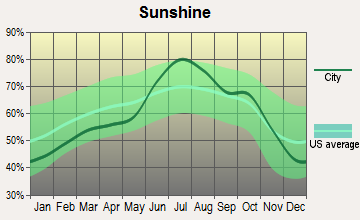
Sunshine amount - Average
66.6%
64.5%
Sunshine amount - Differences during a year
20%
36%
Sunshine amount - Maximum monthly
74%
79%
Sunshine amount - Minimum monthly
54%
43%
Wind speed - Average
10.3 mph
12.7 mph
Average climate in Dallas, Texas
Average climate in Corpus Christi, Texas
Air pollution
Type
AQI
NO2
OZONE
PB
PM25
SO2
Year
Dallas
Corpus Christi
Dallas
Dallas
Corpus Christi
Dallas
Dallas
Corpus Christi
Dallas
Corpus Christi
2018
86
89
5.7
N/A
28.7
23.9
N/A
N/A
9.7
9.2
0.4
0.4
2017
84
70
5.5
N/A
28.6
27.3
N/A
N/A
9.1
8.7
0.3
0.4
2016
81
59
6.1
N/A
27.2
26.9
N/A
N/A
8.4
8.1
0.2
0.5
2015
85
75
6.5
N/A
26.7
25.9
N/A
N/A
8.9
9.3
0.3
0.3
2014
83
75
6.3
N/A
27.6
26.1
N/A
N/A
9.9
9.3
0.3
0.2
2013
97
80
7.3
N/A
28.8
27.3
N/A
N/A
13.0
8.6
0.2
0.2
2012
116
78
8.6
N/A
31.0
28.6
N/A
N/A
12.0
8.9
0.3
0.2
2011
98
80
9.4
N/A
30.9
29.3
N/A
N/A
11.9
10.0
0.6
0.3
2010
79
85
9.4
N/A
28.3
27.9
N/A
N/A
N/A
9.7
0.7
0.5
2009
88
72
9.2
N/A
28.8
26.3
N/A
N/A
N/A
9.9
0.5
0.4
2008
88
82
9.8
N/A
29.2
26.4
0.121
N/A
N/A
10.0
0.5
0.6
2007
94
85
11.0
N/A
25.7
25.3
0.070
N/A
N/A
10.3
0.3
0.5
2006
107
88
10.8
N/A
30.6
27.0
0.106
N/A
N/A
10.3
0.7
0.7
2005
108
81
13.0
N/A
29.7
24.8
0.142
N/A
11.0
10.3
0.9
1.1
2004
96
74
12.3
N/A
26.0
26.8
0.099
N/A
N/A
N/A
0.8
1.3
2003
102
88
13.6
N/A
27.1
27.0
0.121
N/A
N/A
N/A
1.0
1.0
2002
100
88
14.0
N/A
25.2
27.6
0.080
N/A
N/A
N/A
0.4
0.9
2001
100
85
14.3
N/A
26.0
26.5
0.069
N/A
N/A
N/A
1.0
1.2
2000
109
78
14.5
N/A
27.0
25.8
0.092
N/A
N/A
N/A
1.1
1.3
Natural disasters
Type
Dallas
Corpus Christi
Tornado activity compared to U.S. average
254.7%
68.2%
Earthquake activity compared to U.S. average
567%
52%
Natural disasters compared to U.S. average
21%
24%
Transportation
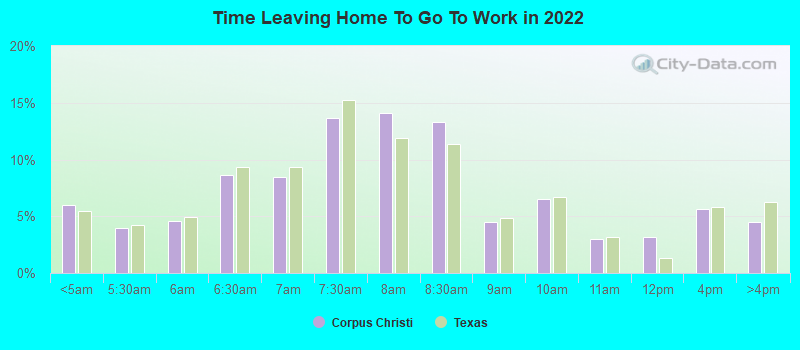
Dallas has a larger public transportation system, the DART, providing both bus and rail options. Corpus Christi's transportation system is more limited, with the main form of commuting being by car.
Transport
Type
Dallas
Corpus Christi
Amtrak stations
1
0
Amtrak stations nearby
1
0
FAA registered aircraft
2
298
FAA registered aircraft manufacturers and dealers
56
1
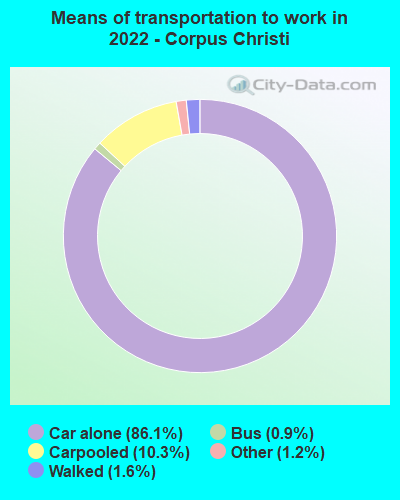
Means of transportation to work
Type
Dallas
Corpus Christi
Bicycle
0.3%
0.2%
Bus
1.4%
1.1%
Carpooled
10.9%
9.9%
Car alone
83.9%
86.5%
Motorcycle
0%
0.2%
Railroad
0.2%
0%
Subway
0.2%
0%
Taxicab
0.1%
0.1%
Walked
1.6%
1.4%
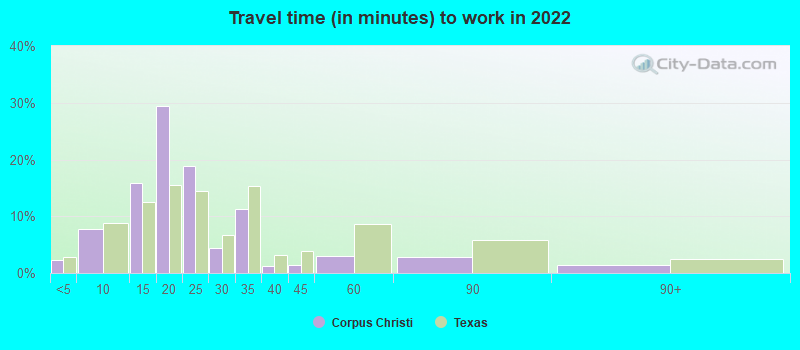
Average travel time to work
Type
Dallas
Corpus Christi
Average
31.5 min
21.4 min
Other means
26.5 min
20.1 min
Public transportation
46 min
37.6 min
Private vehicle occupancy
Type
Dallas
Corpus Christi
Average
1.2
1.1
Drove alone
86.8%
90.4%
In 2 person carpool
9%
7.6%
In 3 person carpool
2.6%
1.2%
In 4 person carpool
0.9%
0.4%
In 5-6 person carpool
0.5%
0.3%
In 7+ person carpool
0.2%
0%
How many people usually rode to work in the car, truck or van.
Real Estate
Dallas's real estate market is more expensive but also offers a higher potential for property value appreciation. Corpus Christi's real estate market is more affordable, making it attractive to those looking for lower-cost housing options.
Neighborhoods
Dallas offers a wide range of neighborhoods from bustling downtown spots like Uptown and Deep Ellum to suburban-like areas like Highland Park. Corpus Christi offers a quieter, coastal life with neighborhoods like Mustang Island offering beachfront views.
Houses and residents
Type
Dallas
Corpus Christi
Houses
591,773
137,431
Average household size (people)
2.6
2.7
Median year apartment built
1987
1984
Median year house/condo built
1969
1981
Length of stay in the house since moving in
13.9 years
13.3 years
Houses occupied
536,008 (90.6%)
117,366 (85.4%)
Houses occupied by owners
229,518 (42.8%)
67,874 (57.8%)
Houses occupied by renters
306,490 (57.2%)
49,492 (42.2%)
Median rent asked for vacant for-rent units
$1,403
$1,470
Median monthly housing costs
$1,225
$1,102
Median price asked for vacant for-sale houses and condos
$574,934
$329,579
Estimated median house or condo value
$267,600
$171,500
Median numbers of rooms
4.6
4.9
Median number of rooms in apartments
3.7
4.1
Median number of rooms in houses and condos
6.1
5.6
Median house price - detached houses
$410,272
$212,792
Median house price - in 2-unit structures
$255,160
$219,111
Median house price - in 3-to-4-unit structures
$230,927
$270,664
Median house price - in 5 or more unit structures
$444,589
$270,817
Median house price - mobile homes
$91,039
$33,205
Median house price - Townhouses or other attached units
$350,045
$168,101
Median house price - All housing units
$402,215
$210,115
Median house age
40
40
Renting percentage
55.9%
40.7%
Housing density (houses/condos per square mile)
1,727.6
888.7
House value disparities
41.3%
37.5%
Household income disparities
48.2%
45%
Median household income for houses/condes with a mortgage
$103,798
$84,755
Median household income for apartments without a mortgage
$61,909
$55,283
Housing units without a mortgage
1,309 (1%)
190 (0.5%)
Housing units with both a second mortgage and home equity loan
3,320 (2.6%)
1,163 (3.1%)
Housing units with a mortgage
124,846 (99%)
37,907 (99.5%)
Housing units with a home equity loan
204 (0.2%)
0 (0%)
Housing units with a second mortgage
5,351 (4.2%)
1,292 (3.4%)
House/condo owner moved in on average (years ago)
12
11
House/condo renter moved in on average (years ago)
1
1
Housing units lacking complete kitchen facilities
1.2%
2.9%
Housing units lacking complete plumbing facilities
0.9%
2.8%
Housing units in structures
Housing units in structures
Dallas
Corpus Christi
One, detached
41.8%
65.0%
One, attached
4.3%
1.6%
Two
1.5%
3.0%
3 or 4
4.9%
6.5%
5 to 9
7.9%
8.7%
10 to 19
12.1%
5.7%
20 to 49
8.1%
2.3%
50 or more
18.4%
4.1%
Mobile homes
1.0%
2.8%
Boats, RVs, vans, etc.
0.0%
0.3%
Median real estate property taxes paid for housing units
Self-employed workers in own not incorporated business
43,703
10,817
State government workers
17,325
6,884
Unpaid family workers
754
230
Industries and Occupations
Dallas hosts many Fortune 500 companies and offers diverse job sectors, including IT, finance, and healthcare. Corpus Christi has a more focused job market, with predominant sectors being oil, tourism, service, and shipping.
Dallas offers a wide range of top-rated health facilities, including UT Southwestern and Baylor University Medical Center. Corpus Christi also has good medical facilities but does not match Dallas in terms of quantity or national rankings.
Health (county statistics)
Type
Dallas
Corpus Christi
General health status score of residents in this county from 1 (poor) to 5 (excellent)
Dallas, being a larger city, has more developed infrastructure including a vast network of highways, airports, and rail lines. Corpus Christi's infrastructure, while robust, is narrower, focusing more on maritime infrastructure due to its coastal location.
Infrastructure
Type
Dallas
Corpus Christi
Hospitals
74
34
TV stations
25
21
Arenas or stadiums
2
1
Bank branches located here
394
83
Bank institutions located here
80
17
Main business address for public companies
122
1
Drinking water stations with no reported violations in the past
8
1
Drinking water stations with reported violations in the past
HMDA - Conventional home purchase loans - Applications denied
Year
Dallas
Corpus Christi
1999
5,030
1,534
2000
3,390
814
2001
2,626
738
2002
2,657
631
2003
3,617
737
2004
5,460
1,013
2005
7,445
1,275
2006
7,397
1,217
2007
5,056
942
2008
2,200
546
2009
1,121
413
Culture and Food
Dallas offers a rich cultural scene with numerous museums, art centers, sports venues, and a vibrant food and music scene. Corpus Christi, while smaller, boasts a laid-back coastal culture, excellent seafood, and family-friendly beaches and parks.
Sports Teams
Dallas is home to several major league sports teams like the Dallas Cowboys, Mavericks, and Stars, while Corpus Christi hosts minor league and semi-pro teams such as the Corpus Christi Hooks.


 Dallas, TX
 Corpus Christi, TX