Dallas, Texas and Greensboro, North Carolina are both unique cities in the United States with different appeals for residents and tourists alike. While Dallas is a major city with bustling trade, sports, and entertainment, Greensboro offers a more slow-paced, affordable quality of life with rich history and nature. Whether you plan on relocating or visiting, it's vital to weigh factors such as crime and safety, weather, cost of living, and culture among other things. This comparative analysis provides key insights into the two cities across various areas of interest.
Distance between
Dallas, TX and
Greensboro, NC : 991.6 miles
Dallas's population is larger by 332%. Its population has grown by 99,877 people (8.4%) since 2000. The population of Greensboro has grown by 74,372 people (33.2%) during that time.
Dallas, being much larger, has a higher crime rate than Greensboro. Violent crime rate is higher in Dallas than in Greensboro. However, local law enforcement in both cities put considerable effort into maintaining safety. For tourists, like anywhere else, it's advisable to stay vigilant, especially in crowded areas. It's noteworthy that crime rates can vary between neighborhoods within each city.
City-data.com crime index counts serious crimes and violent crime more heavily. It adjusts for the number of visitors and daily workers commuting into cities. (higher means more crime, U.S. average = 301.1)
City-data.com crime index counts serious crimes and violent crime more heavily. It adjusts for the number of visitors and daily workers commuting into cities. (higher means more crime, U.S. average = 301.1)
Sex Offenders
According to our data, there are 4,271 registered sex offenders living in Dallas and 609 registered sex offenders living in . The ratio of residents to sex offenders in Dallas is 309 to 1; the ratio in Greensboro is 471 to 1. The number of registered sex offenders compared to the number of residents is larger in Dallas than in Greensboro.
Cost of Living
The cost of living is generally higher in Dallas than in Greensboro. While housing is relatively more expensive in Dallas, groceries, health care, and utilities can also cost more. Greensboro is seen as a cost-effective city with lower average rent and overall living expenses. For someone considering relocating, Greensboro may pose as a more affordable option.
Income Tax
Texas does not have a state income tax, which is beneficial for residents in Dallas. In comparison, North Carolina does have a flat rate state income tax, which Greensboro residents are subject to.
Property Tax
Property taxes are higher in Dallas than in Greensboro. Texas's property taxes are some of the highest in the nation, while North Carolina's are more moderate, making it more attractive for prospective homeowners.
Sales Tax
Texas has a higher state sales tax rate than North Carolina, and Dallas has an additional city sales tax. Greensboro does not have a separate city sales tax, but North Carolina's state sales tax applies.
Income
Type
Dallas
Greensboro
Estimated median household income
$57,995
$51,825
Estimated per capita income
$38,479
$32,208
Cost of living index (U.S. average is 100)
96.1
91.2
If you make $50,000 in Greensboro, you will have to make $52,686 in Dallas to maintain the same standard of living.
Geographical Conditions
Dallas is part of the humid subtropical zone and has relatively flat terrain, while Greensboro enjoys a more diversified geographical set-up with lush parks, gardens, and three watersheds running across the city.
Both Dallas and Greensboro emphasize education, each with their own set of merits. Dallas has a larger network of public and private schools, along with several reputable universities such as the University of Texas at Dallas. Greensboro is home to highly rated universities like the University of North Carolina at Greensboro and Guilford College, making it a competitive area for higher education.
Dallas has a robust and diversified economy, with a strong concentration in sectors like technology, healthcare, and financial services. Retail and hospitality sectors also thrive because of Dallas's popularity as a tourist destination. Greensboro's economy historically relied on textiles, but now healthcare, education, and retail trade are significant contributors. The city's economic environment is growing and attracting more businesses.
Biggest Employers
The biggest employers in Dallas are the Dallas Independent School District, Bank of America, and Texas Health Resources. In Greensboro, the biggest employers are Cone Health, Guilford County Schools, and the City of Greensboro.
There were 2,245 building permits issued in Dallas in 2012 (1436 more than in 2011) compared to 529 building permits issued in Greensboro in 2012 (235 more than in 2011).
In Dallas (Dallas County), 57.3% voted for Democrats and 41.8% for Republicans in 2012 Presidential Election. In Greensboro (Guilford County), 57.8% voted for Democrats and 41.4% for Republicans.
Elections
Type
Democrats
Republicans
Other
Year
Dallas
Greensboro
Dallas
Greensboro
Dallas
Greensboro
2020
65.1%
61.1%
33.4%
37.9%
1.4%
1.1%
2016
60.8%
58.0%
34.7%
38.1%
4.5%
3.9%
2012
57.3%
57.8%
41.8%
41.4%
1.0%
0.8%
2008
57.4%
58.9%
42.0%
40.5%
0.6%
0.5%
2004
49.0%
50.2%
50.4%
49.3%
0.5%
0.4%
2000
45.0%
48.6%
52.7%
50.8%
2.4%
0.7%
1996
46.0%
46.9%
46.8%
45.9%
7.2%
7.2%
Breakdown of population affiliated with a religious congregation
Type
Adherents
Congregations
Religion
Dallas
Greensboro
Dallas
Greensboro
CATHOLIC CHURCH
18.9%
3.6%
2.4%
1.0%
SOUTHERN BAPTIST CONVENTION
11.0%
9.6%
31.1%
16.5%
MUSLIM ESTIMATE
3.6%
0.8%
1.1%
0.7%
EPISCOPAL CHURCH
1.0%
1.2%
1.5%
1.5%
SEVENTH DAY ADVENTIST CHURCH
0.5%
0.5%
1.7%
0.7%
EVANGELICAL LUTHERAN CHURCH IN AMERICA
0.3%
0.8%
0.9%
2.2%
INTERNA PENTECO HOLINESS CHURCH
0.0%
0.3%
0.3%
1.5%
Weather
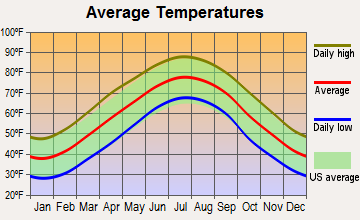
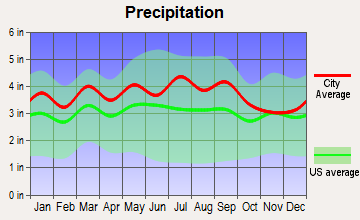
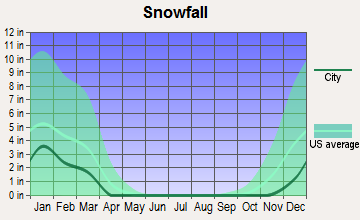
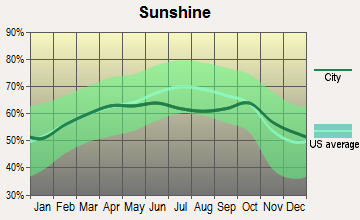
Dallas's weather is characterized by hot, humid summers and mild winters. Greensboro usually has moderate to high humidity year-round with warm summers and cold winters. Dallas gets more sunshine, which may be beneficial for outdoor activities. Greensboro, on the other hand, sees more rainfall and experiences seasonal changes more distinctly.
Weather and climate
Type
Dallas
Greensboro
Temperature - Average
66.6°F
58.4°F
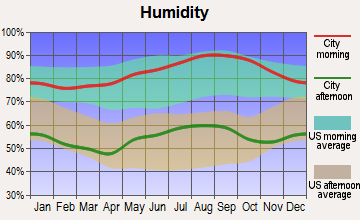
Humidity - Average morning or afternoon humidity
71.3%
72.8%
Humidity - Differences between morning and afternoon humidity
34%
42%
Humidity - Maximum monthly morning or afternoon humidity
82%
88%
Humidity - Minimum monthly morning or afternoon humidity
48%
46%
Precipitation - Yearly average
37.3 in
44.3 in
Snowfall - Yearly average
4.2 in
17 in
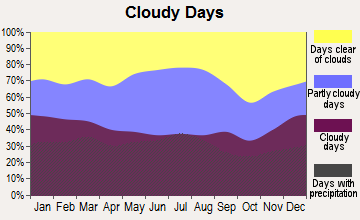
Clouds - Number of days clear of clouds
22.8%
18.3%
Sunshine amount - Average
66.6%
64.7%
Sunshine amount - Differences during a year
20%
10%
Sunshine amount - Maximum monthly
74%
64%
Sunshine amount - Minimum monthly
54%
54%
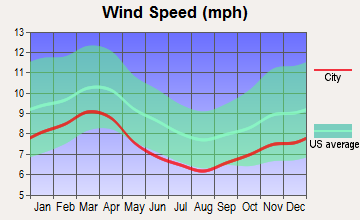
Wind speed - Average
10.3 mph
7.7 mph
Average climate in Dallas, Texas
Average climate in Greensboro, North Carolina
Air pollution
Type
AQI
CO
NO2
OZONE
PB
PM10
PM25
SO2
Year
Dallas
Greensboro
Greensboro
Dallas
Greensboro
Dallas
Greensboro
Dallas
Greensboro
Dallas
Greensboro
Dallas
Greensboro
2018
86
69
N/A
N/A
5.7
6.7
28.7
32.1
N/A
N/A
16.7
N/A
9.7
7.4
0.4
0.2
2017
84
71
N/A
N/A
5.5
7.0
28.6
29.1
N/A
N/A
11.9
N/A
9.1
7.9
0.3
0.3
2016
81
82
N/A
N/A
6.1
6.6
27.2
31.9
N/A
N/A
11.1
N/A
8.4
8.5
0.2
0.2
2015
85
74
N/A
N/A
6.5
6.8
26.7
28.8
N/A
N/A
12.3
N/A
8.9
8.2
0.3
0.3
2014
83
72
N/A
N/A
6.3
6.3
27.6
33.5
N/A
N/A
12.9
N/A
9.9
9.0
0.3
0.4
2013
97
74
N/A
N/A
7.3
6.0
28.8
28.5
N/A
N/A
12.0
N/A
13.0
8.3
0.2
0.3
2012
116
83
N/A
N/A
8.6
8.9
31.0
32.5
N/A
N/A
13.5
N/A
12.0
9.2
0.3
0.4
2011
98
84
N/A
N/A
9.4
7.5
30.9
34.7
N/A
N/A
14.8
N/A
11.9
9.9
0.6
1.0
2010
79
97
N/A
N/A
9.4
9.5
28.3
35.6
N/A
N/A
16.0
N/A
N/A
10.4
0.7
0.3
2009
88
81
N/A
N/A
9.2
13.3
28.8
30.4
N/A
N/A
14.2
N/A
N/A
9.9
0.5
3.9
2008
88
98
N/A
N/A
9.8
11.1
29.2
33.7
0.121
N/A
16.7
N/A
N/A
12.7
0.5
6.3
2007
94
102
N/A
N/A
11.0
11.1
25.7
37.9
0.070
N/A
19.8
N/A
N/A
13.7
0.3
5.5
2006
107
90
N/A
N/A
10.8
10.3
30.6
33.6
0.106
N/A
19.4
N/A
N/A
14.9
0.7
5.1
2005
108
83
0.70
N/A
13.0
10.5
29.7
33.1
0.142
N/A
19.6
N/A
11.0
N/A
0.9
5.1
2004
96
76
0.56
N/A
12.3
12.9
26.0
24.9
0.099
N/A
19.8
N/A
N/A
N/A
0.8
4.3
2003
102
88
0.56
N/A
13.6
14.8
27.1
29.3
0.121
N/A
18.9
N/A
N/A
N/A
1.0
5.5
2002
100
99
0.65
N/A
14.0
14.3
25.2
34.8
0.080
N/A
19.7
N/A
N/A
N/A
0.4
5.0
2001
100
103
0.70
N/A
14.3
16.0
26.0
31.0
0.069
N/A
21.4
N/A
N/A
N/A
1.0
4.5
2000
109
90
0.68
N/A
14.5
17.1
27.0
31.2
0.092
N/A
21.2
N/A
N/A
N/A
1.1
4.4
Natural disasters
Type
Dallas
Greensboro
Tornado activity compared to U.S. average
254.7%
76.6%
Earthquake activity compared to U.S. average
567%
67.4%
Natural disasters compared to U.S. average
21%
20%
Transportation
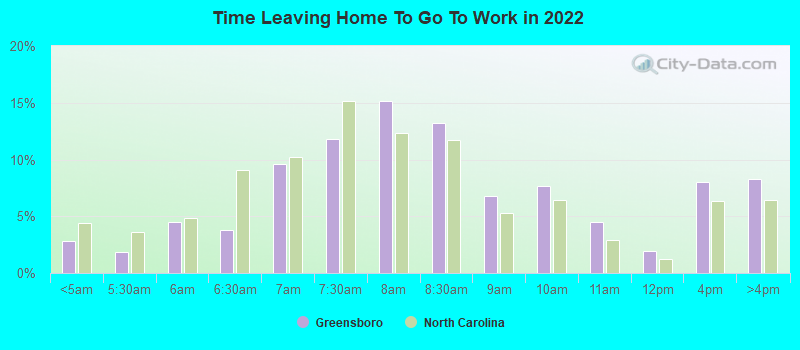
Dallas offers more in terms of public transit with the Dallas Area Rapid Transit (DART) system providing rail, bus and high-occupancy vehicle lane services. Greensboro, though smaller, maintains an efficient bus transit system known as Greensboro Transit Authority (GTA), but lacks a rail system. Commute times in both cities are similar, but Dallas's sprawling nature can sometimes result in longer commutes.
Transport
Type
Dallas
Greensboro
Amtrak stations
1
1
Amtrak stations nearby
1
2
FAA registered aircraft
2
300
FAA registered aircraft manufacturers and dealers
56
13
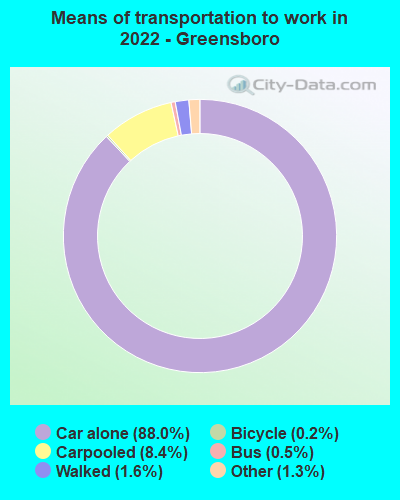
Means of transportation to work
Type
Dallas
Greensboro
Bicycle
0.3%
0.1%
Bus
1.4%
1%
Carpooled
10.9%
6.8%
Car alone
83.9%
89.4%
Railroad
0.2%
0%
Subway
0.2%
0%
Taxicab
0.1%
0.2%
Walked
1.6%
1.2%
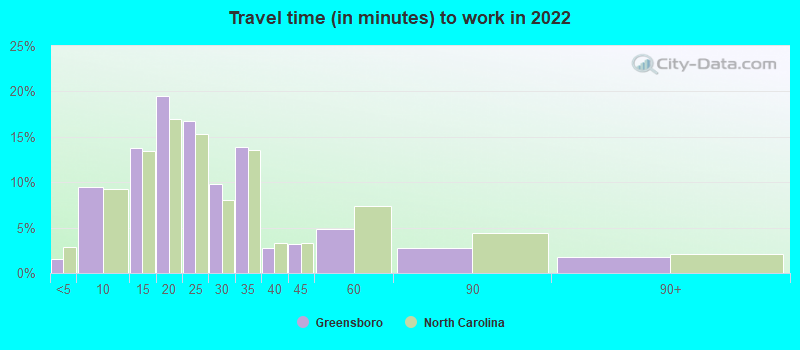
Average travel time to work
Type
Dallas
Greensboro
Average
31.5 min
24.8 min
Other means
26.5 min
20.9 min
Public transportation
46 min
42.2 min
Private vehicle occupancy
Type
Dallas
Greensboro
Average
1.2
1.1
Drove alone
86.8%
91.9%
In 2 person carpool
9%
5.8%
In 3 person carpool
2.6%
1.5%
In 4 person carpool
0.9%
0.5%
In 5-6 person carpool
0.5%
0.1%
In 7+ person carpool
0.2%
0.2%
How many people usually rode to work in the car, truck or van.
Real Estate
Dallas's real estate market is more expensive, with a median home cost significantly higher than the national average. Greensboro's real estate is more affordable, with the median home price well below the national average. This makes Greensboro an attractive destination for those looking for affordable homeownership or investment opportunities.
Neighborhoods
Both Dallas and Greensboro come with diverse neighborhoods catering to different lifestyles. Dallas features upscale neighborhoods like Highland Park and University Park. It also has artsy areas like Deep Ellum and Bishop Arts District. Greensboro offers neighborhoods like Fisher Park and Irving Park for those looking for historic charm, while newer areas like New Irving Park cater to modern suburban living.
Houses and residents
Type
Dallas
Greensboro
Houses
591,773
139,565
Average household size (people)
2.6
2.3
Median year apartment built
1987
1989
Median year house/condo built
1969
1981
Length of stay in the house since moving in
13.9 years
13.6 years
Houses occupied
536,008 (90.6%)
123,955 (88.8%)
Houses occupied by owners
229,518 (42.8%)
69,834 (56.3%)
Houses occupied by renters
306,490 (57.2%)
54,121 (43.7%)
Median rent asked for vacant for-rent units
$1,403
$1,295
Median monthly housing costs
$1,225
$981
Median price asked for vacant for-sale houses and condos
$574,934
$336,309
Estimated median house or condo value
$267,600
$186,200
Median numbers of rooms
4.6
5.3
Median number of rooms in apartments
3.7
4
Median number of rooms in houses and condos
6.1
6.3
Median house price - detached houses
$410,272
$261,886
Median house price - in 2-unit structures
$255,160
$205,442
Median house price - in 3-to-4-unit structures
$230,927
$240,978
Median house price - in 5 or more unit structures
$444,589
$129,256
Median house price - mobile homes
$91,039
$86,037
Median house price - Townhouses or other attached units
$350,045
$221,087
Median house price - All housing units
$402,215
$252,845
Median house age
40
37
Renting percentage
55.9%
47.5%
Housing density (houses/condos per square mile)
1,727.6
1,332.9
House value disparities
41.3%
36.2%
Household income disparities
48.2%
45.9%
Median household income for houses/condes with a mortgage
$103,798
$75,953
Median household income for apartments without a mortgage
$61,909
$62,470
Housing units without a mortgage
1,309 (1%)
1,421 (3.1%)
Housing units with both a second mortgage and home equity loan
3,320 (2.6%)
3,736 (8.1%)
Housing units with a mortgage
124,846 (99%)
44,909 (96.9%)
Housing units with a home equity loan
204 (0.2%)
227 (0.5%)
Housing units with a second mortgage
5,351 (4.2%)
5,099 (11%)
House/condo owner moved in on average (years ago)
12
12
House/condo renter moved in on average (years ago)
1
1
Housing units lacking complete kitchen facilities
1.2%
1.8%
Housing units lacking complete plumbing facilities
0.9%
0.5%
Housing units in structures
Housing units in structures
Dallas
Greensboro
One, detached
41.8%
55.4%
One, attached
4.3%
7.3%
Two
1.5%
1.7%
3 or 4
4.9%
5.4%
5 to 9
7.9%
9.0%
10 to 19
12.1%
8.6%
20 to 49
8.1%
7.0%
50 or more
18.4%
4.3%
Mobile homes
1.0%
1.3%
Median real estate property taxes paid for housing units
Self-employed workers in own not incorporated business
43,703
6,258
State government workers
17,325
9,041
Unpaid family workers
754
205
Industries and Occupations
In Dallas, the most prominent industries are technology, healthcare, finance, and trade, offering diverse occupational opportunities across various sectors. Greensboro's dominant industries include healthcare, education, and trade, with a rising presence of logistics and distribution companies.
Dallas is known for its exceptional healthcare facilities such as the UT Southwestern Medical Center. Greensboro too has commendable healthcare services predominantly offered by Cone Health. For people with specific healthcare needs, both cities are equipped to provide quality care.
Health (county statistics)
Type
Dallas
Greensboro
General health status score of residents in this county from 1 (poor) to 5 (excellent)
Dallas, as a bigger cosmopolitan city, boasts more significant infrastructure including numerous airports (including the DFW International), highways, stadiums, and large-scale real estate developments. Greensboro, being smaller, has less expansive infrastructure, but still features convenient highways, Piedmont Triad International airport, and well-maintained public facilities.
Infrastructure
Type
Dallas
Greensboro
Hospitals
74
16
TV stations
25
10
Arenas or stadiums
2
1
Bank branches located here
394
97
Bank institutions located here
80
19
Main business address for public companies
122
11
Drinking water stations with no reported violations in the past
8
3
Drinking water stations with reported violations in the past
HMDA - Conventional home purchase loans - Applications denied
Year
Dallas
Greensboro
1999
5,030
1,540
2000
3,390
1,012
2001
2,626
739
2002
2,657
787
2003
3,617
568
2004
5,460
692
2005
7,445
748
2006
7,397
880
2007
5,056
653
2008
2,200
290
2009
1,121
164
Culture and Food
Dallas offers a diverse cultural scene with plenty of arts, music, and entertainment options. It's well known for its BBQ food, Mexican cuisine, and Steak houses. Greensboro, on the other hand, offers a more relaxed culture with a focus on its rich history. The city offers southern cuisine, and is renowned for its local craft beer scene.
Sports Teams
Dallas takes the lead in professional sports, housing NFL's Dallas Cowboys, NBA's Dallas Mavericks, MLB's Texas Rangers, and NHL's Dallas Stars. Greensboro, while lacking big-name professional sports teams, takes pride in its local college sports, especially the teams from the University of North Carolina at Greensboro.


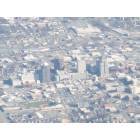
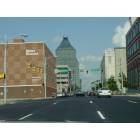
 Dallas, TX
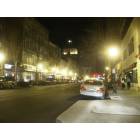
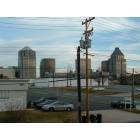
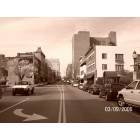
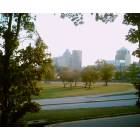
 Greensboro, NC