Comparing Dallas, Texas and New Orleans, Louisiana reveals two cities with distinct characteristics, attractions, and challenges. Experiences in both cities can vary greatly based on a variety of factors including weather, crime, cost of living, and culture. Both cities offer a rich cultural experience but differ greatly in terms of economy, education, and infrastructure among others. This contrast not only impacts tourists but also plays a key role for individuals planning to relocate.
Distance between
Dallas, TX and
New Orleans, LA : 442.2 miles
Dallas's population is larger by 242%. Its population has grown by 99,877 people (8.4%) since 2000. The population of New Orleans has decreased by 107,703 people (22.2%) during that time.
Both cities grapple with crime at levels higher than national averages. While Dallas has seen a significant decrease in violent crime in recent years, it’s still slightly higher than the national average. New Orleans, on the other hand, still struggles with a high crime rate, especially in specific neighborhoods. It is vital to conduct targeted research on neighbourhood safety before visiting or relocating to these cities.
City-data.com crime index counts serious crimes and violent crime more heavily. It adjusts for the number of visitors and daily workers commuting into cities. (higher means more crime, U.S. average = 301.1)
City-data.com crime index counts serious crimes and violent crime more heavily. It adjusts for the number of visitors and daily workers commuting into cities. (higher means more crime, U.S. average = 301.1)
Sex Offenders
According to our data, there are 4,271 registered sex offenders living in Dallas and 700 registered sex offenders living in . The ratio of residents to sex offenders in Dallas is 309 to 1; the ratio in New Orleans is 559 to 1. The number of registered sex offenders compared to the number of residents is larger in Dallas than in New Orleans.
Cost of Living
The cost of living in Dallas is significantly lower than that of New Orleans. Dallas offers affordable housing, cheaper grocery costs, and overall lower expenses in comparison. New Orleans, while not as expensive as other major cities, has a higher cost of living than Dallas largely due to the cost of housing.
Income Tax
Texas, including Dallas, does not impose a state income tax. Louisiana, however, charges a state income tax, adding to the overall cost of living in New Orleans.
Property Tax
Dallas has a relatively high property tax rate. Although property tax rates in New Orleans are lower, they are offset by higher housing prices.
Sales Tax
Dallas holds a combined city and state sales tax of 8.25%, one of the highest in the country. New Orleans, on the other hand, has a combined rate of 9.45%.
Income
Type
Dallas
New Orleans
Estimated median household income
$57,995
$46,942
Estimated per capita income
$38,479
$35,587
Cost of living index (U.S. average is 100)
96.1
97.9
If you make $50,000 in Dallas, you will have to make $50,937 in New Orleans to maintain the same standard of living.
Geographical Conditions
Dallas is located in North Texas, characterized by flat prairies. New Orleans is located in southeastern Louisiana and is known for its below-sea-level elevation, making it susceptible to flooding.
Both cities have a good range of education options. Dallas is home to top-rated public and private schools, as well as renowned universities such as the University of Texas at Dallas. New Orleans, while having numerous public and private schools, faces challenges in its public school system with performance and infrastructure. It is home to notable universities like Tulane and Loyola University.
The Dallas economy is diverse, with strengths in sectors like technology, healthcare, and finance. Job growth is strong, and the unemployment rate is generally lower than the national average. New Orleans has a service and tourism-based economy, with job growth expected but at a slower rate than Dallas.
Biggest Employers
In Dallas, some of the biggest employers are AT&T, Texas Health Resources, and American Airlines. In New Orleans, top employers include Ochsner Health System, Tulane University, and Hilton New Orleans.
There were 2,245 building permits issued in Dallas in 2012 (1436 more than in 2011) compared to 716 building permits issued in New Orleans in 2012 (1 less than in 2011).
In Dallas (Dallas County), 57.3% voted for Democrats and 41.8% for Republicans in 2012 Presidential Election. In New Orleans (Orleans Parish), 80.5% voted for Democrats and 17.8% for Republicans.
Elections
Type
Democrats
Republicans
Other
Year
Dallas
New Orleans
Dallas
New Orleans
Dallas
New Orleans
2020
65.1%
83.6%
33.4%
15.1%
1.4%
1.3%
2016
60.8%
81.1%
34.7%
14.7%
4.5%
4.2%
2012
57.3%
80.5%
41.8%
17.8%
1.0%
1.7%
2008
57.4%
79.6%
42.0%
19.1%
0.6%
1.3%
2004
49.0%
77.8%
50.4%
21.8%
0.5%
0.4%
2000
45.0%
76.2%
52.7%
21.8%
2.4%
2.0%
1996
46.0%
90.7%
46.8%
8.2%
7.2%
1.2%
Breakdown of population affiliated with a religious congregation
Type
Adherents
Congregations
Religion
Dallas
New Orleans
Dallas
New Orleans
CATHOLIC CHURCH
18.9%
30.9%
2.4%
16.0%
SOUTHERN BAPTIST CONVENTION
11.0%
4.3%
31.1%
13.0%
MUSLIM ESTIMATE
3.6%
0.5%
1.1%
1.8%
EPISCOPAL CHURCH
1.0%
1.5%
1.5%
4.2%
SEVENTH DAY ADVENTIST CHURCH
0.5%
1.1%
1.7%
1.8%
EVANGELICAL LUTHERAN CHURCH IN AMERICA
0.3%
0.2%
0.9%
0.9%
LUTHERAN CHURCH
0.3%
0.5%
0.7%
3.9%
AMERICAN BAPTIST CHURCHES IN THE USA
0.1%
0.6%
0.2%
0.6%
Weather
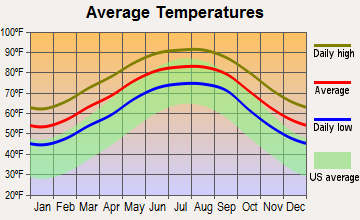
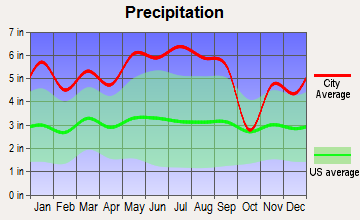
Dallas experiences a subtropical climate with hot, humid summers and generally mild winters. New Orleans shares a similarly humid climate, but it experiences more rainfall than Dallas, especially during hurricane season.
Weather and climate
Type
Dallas
New Orleans
Temperature - Average
66.6°F
69.6°F
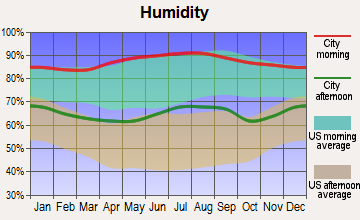
Humidity - Average morning or afternoon humidity
71.3%
80.8%
Humidity - Differences between morning and afternoon humidity
34%
32%
Humidity - Maximum monthly morning or afternoon humidity
82%
91%
Humidity - Minimum monthly morning or afternoon humidity
48%
59%
Precipitation - Yearly average
37.3 in
62.2 in
Snowfall - Yearly average
4.2 in
0.2 in
Clouds - Number of days clear of clouds
22.8%
16.9%
Sunshine amount - Average
66.6%
63.7%
Sunshine amount - Differences during a year
20%
22%
Sunshine amount - Maximum monthly
74%
70%
Sunshine amount - Minimum monthly
54%
48%
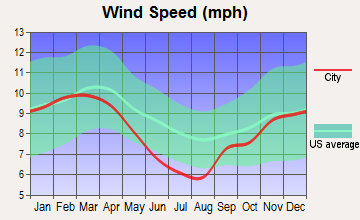
Wind speed - Average
10.3 mph
8.7 mph
Average climate in Dallas, Texas
Average climate in New Orleans, Louisiana
Air pollution
Type
AQI
CO
NO2
OZONE
PB
PM10
PM25
SO2
Year
Dallas
New Orleans
New Orleans
Dallas
New Orleans
Dallas
New Orleans
Dallas
New Orleans
Dallas
New Orleans
Dallas
New Orleans
2018
86
75
N/A
N/A
5.7
5.5
28.7
27.9
N/A
N/A
19.6
N/A
9.7
9.5
0.4
1.1
2017
84
73
N/A
N/A
5.5
6.0
28.6
27.6
N/A
N/A
18.8
N/A
9.1
9.5
0.3
1.6
2016
81
71
N/A
N/A
6.1
6.7
27.2
29.1
N/A
N/A
16.5
N/A
8.4
9.4
0.2
1.7
2015
85
76
N/A
N/A
6.5
6.3
26.7
26.5
N/A
N/A
17.5
N/A
8.9
8.8
0.3
1.3
2014
83
79
N/A
N/A
6.3
6.7
27.6
25.6
N/A
N/A
17.7
N/A
9.9
7.7
0.3
2.0
2013
97
73
N/A
N/A
7.3
6.5
28.8
25.8
N/A
N/A
17.8
N/A
13.0
7.4
0.2
2.6
2012
116
84
N/A
N/A
8.6
7.8
31.0
26.8
N/A
N/A
24.0
N/A
12.0
10.0
0.3
2.5
2011
98
93
N/A
N/A
9.4
7.8
30.9
27.0
N/A
N/A
24.9
N/A
11.9
8.8
0.6
2.1
2010
79
89
N/A
N/A
9.4
7.8
28.3
27.5
N/A
N/A
26.7
N/A
N/A
9.5
0.7
2.9
2009
88
81
N/A
N/A
9.2
7.6
28.8
26.5
N/A
N/A
N/A
N/A
N/A
9.1
0.5
2.8
2008
88
81
N/A
N/A
9.8
9.3
29.2
27.3
0.121
N/A
N/A
N/A
N/A
10.0
0.5
3.0
2007
94
97
N/A
N/A
11.0
9.1
25.7
28.4
0.070
N/A
N/A
N/A
N/A
10.2
0.3
3.6
2006
107
93
N/A
N/A
10.8
9.7
30.6
28.7
0.106
N/A
N/A
N/A
N/A
11.2
0.7
N/A
2005
108
93
0.58
N/A
13.0
9.0
29.7
24.7
0.142
N/A
N/A
N/A
11.0
10.6
0.9
N/A
2004
96
96
0.68
N/A
12.3
9.5
26.0
21.3
0.099
N/A
N/A
N/A
N/A
10.3
0.8
N/A
2003
102
91
0.84
N/A
13.6
9.9
27.1
19.5
0.121
N/A
N/A
N/A
N/A
11.5
1.0
N/A
2002
100
68
0.61
N/A
14.0
9.3
25.2
20.2
0.080
N/A
N/A
N/A
N/A
N/A
0.4
N/A
2001
100
88
0.81
N/A
14.3
10.2
26.0
20.6
0.069
N/A
N/A
N/A
N/A
N/A
1.0
N/A
2000
109
105
0.55
N/A
14.5
11.3
27.0
24.5
0.092
N/A
N/A
N/A
N/A
N/A
1.1
N/A
Natural disasters
Type
Dallas
New Orleans
Tornado activity compared to U.S. average
254.7%
125.4%
Earthquake activity compared to U.S. average
567%
44.4%
Natural disasters compared to U.S. average
21%
21%
Transportation
Dallas has a more developed public transit system, including light rail and bus services. Commuting is more common in Dallas compared to New Orleans. However, New Orleans offers well-managed public transit options, including iconic streetcars.
Transport
Type
Dallas
New Orleans
Amtrak stations
1
1
Amtrak stations nearby
1
1
FAA registered aircraft
2
201
FAA registered aircraft manufacturers and dealers
56
2
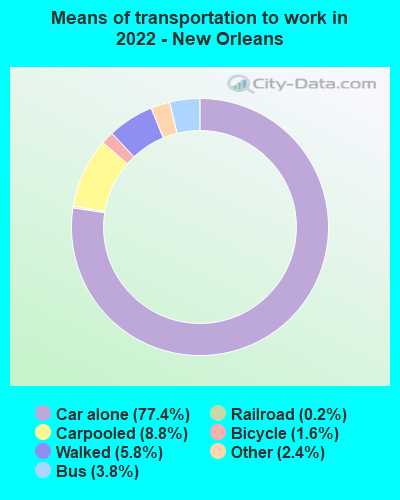
Means of transportation to work
Type
Dallas
New Orleans
Bicycle
0.3%
1.4%
Bus
1.4%
3.3%
Carpooled
10.9%
9%
Car alone
83.9%
79.9%
Ferryboat
0%
0.1%
Motorcycle
0%
0.1%
Railroad
0.2%
0.2%
Subway
0.2%
0.1%
Taxicab
0.1%
0.5%
Walked
1.6%
3.6%
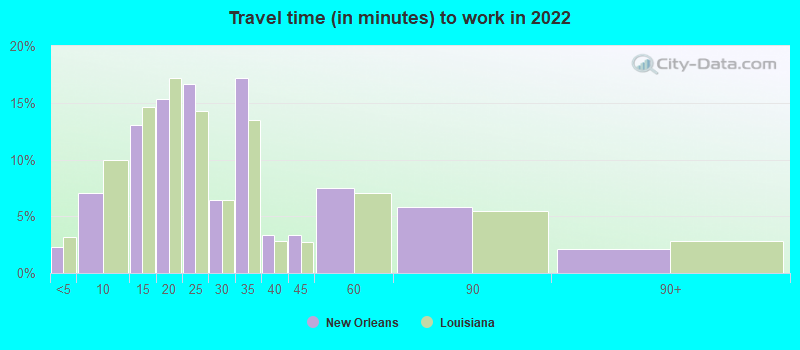
Average travel time to work
Type
Dallas
New Orleans
Average
31.5 min
27.7 min
Other means
26.5 min
23.4 min
Public transportation
46 min
42.3 min
Private vehicle occupancy
Type
Dallas
New Orleans
Average
1.2
1.2
Drove alone
86.8%
89.9%
In 2 person carpool
9%
8.2%
In 3 person carpool
2.6%
0.8%
In 4 person carpool
0.9%
0.4%
In 5-6 person carpool
0.5%
0.1%
In 7+ person carpool
0.2%
0.6%
How many people usually rode to work in the car, truck or van.
Real Estate
The real estate market in Dallas offers a mix of affordable and luxury housing options. In contrast, real estate in New Orleans tends to be more expensive, although this varies significantly by neighborhood.
Neighborhoods
Both cities have diverse neighborhoods offering unique living experiences. In Dallas, the Bishop Arts District is known for its vibrant nightlife, while the French Quarter is the heart of New Orleans with its unique architecture and bustling street life.
Houses and residents
Type
Dallas
New Orleans
Houses
591,773
194,701
Average household size (people)
2.6
2.3
Median year apartment built
1987
1966
Median year house/condo built
1969
1960
Length of stay in the house since moving in
13.9 years
15.5 years
Houses occupied
536,008 (90.6%)
158,827 (81.6%)
Houses occupied by owners
229,518 (42.8%)
83,516 (52.6%)
Houses occupied by renters
306,490 (57.2%)
75,311 (47.4%)
Median rent asked for vacant for-rent units
$1,403
$1,126
Median monthly housing costs
$1,225
$1,106
Median price asked for vacant for-sale houses and condos
$574,934
$470,732
Estimated median house or condo value
$267,600
$279,100
Median numbers of rooms
4.6
5.2
Median number of rooms in apartments
3.7
4.4
Median number of rooms in houses and condos
6.1
6.3
Median house price - detached houses
$410,272
$360,278
Median house price - in 2-unit structures
$255,160
$499,015
Median house price - in 3-to-4-unit structures
$230,927
$347,348
Median house price - in 5 or more unit structures
$444,589
$400,453
Median house price - mobile homes
$91,039
$25,502
Median house price - Townhouses or other attached units
$350,045
$365,362
Median house price - All housing units
$402,215
$369,282
Median house age
40
61
Renting percentage
55.9%
52.2%
Housing density (houses/condos per square mile)
1,727.6
1,078.3
House value disparities
41.3%
38.2%
Household income disparities
48.2%
53.1%
Median household income for houses/condes with a mortgage
$103,798
$89,566
Median household income for apartments without a mortgage
$61,909
$53,790
Housing units without a mortgage
1,309 (1%)
629 (1.3%)
Housing units with both a second mortgage and home equity loan
3,320 (2.6%)
3,326 (6.9%)
Housing units with a mortgage
124,846 (99%)
47,733 (98.7%)
Housing units with a home equity loan
204 (0.2%)
296 (0.6%)
Housing units with a second mortgage
5,351 (4.2%)
4,588 (9.5%)
House/condo owner moved in on average (years ago)
12
14
House/condo renter moved in on average (years ago)
1
3
Housing units lacking complete kitchen facilities
1.2%
5.6%
Housing units lacking complete plumbing facilities
0.9%
4.6%
Housing units in structures
Housing units in structures
Dallas
New Orleans
One, detached
41.8%
48.0%
One, attached
4.3%
9.7%
Two
1.5%
15.1%
3 or 4
4.9%
6.9%
5 to 9
7.9%
4.1%
10 to 19
12.1%
3.8%
20 to 49
8.1%
3.9%
50 or more
18.4%
8.1%
Mobile homes
1.0%
0.4%
Median real estate property taxes paid for housing units
Self-employed workers in own not incorporated business
43,703
9,492
State government workers
17,325
9,130
Unpaid family workers
754
527
Industries and Occupations
Dallas is a hub for technology, finance, and telecommunications jobs whereas New Orleans sees a dominance of occupations in healthcare, hospitality, and entertainment sectors due to its strong tourism industry.
Both cities have respectable healthcare facilities. Dallas has more hospitals and a larger concentration of healthcare professionals. While New Orleans also has high-quality healthcare, it has fewer facilities and professionals compared to Dallas.
Health (county statistics)
Type
Dallas
New Orleans
General health status score of residents in this county from 1 (poor) to 5 (excellent)
Dallas boasts a well-developed infrastructure with an efficient public transportation system, and the DFW airport being one of the busiest in the world. New Orleans, however, struggles with outdated infrastructure, notably with drainage systems which can lead to serious flooding.
HMDA - Conventional home purchase loans - Applications denied
Year
Dallas
New Orleans
1999
5,030
1,021
2000
3,390
942
2001
2,626
820
2002
2,657
820
2003
3,617
991
2004
5,460
1,379
2005
7,445
1,899
2006
7,397
1,426
2007
5,056
1,245
2008
2,200
683
2009
1,121
378
Culture and Food
Both cities showcase rich cultural experiences and are foodie paradises. Dallas is known for its Tex-Mex and BBQ, while New Orleans is famed for Cajun and Creole dishes like jambalaya and crawfish.
Sports Teams
Dallas is home to popular sports teams such as the Dallas Cowboys (NFL) and the Dallas Mavericks (NBA), while New Orleans supports the New Orleans Saints (NFL) and the New Orleans Pelicans (NBA).


 Dallas, TX
 New Orleans, LA