Dallas, TX and Newark, NJ offer different experiences for their residents and visitors. While Dallas boasts mild winters and a thriving job market, Newark offers a bustling urban landscape, rich history, and robust public transit. Each city has unique cultural, economic, and geographical elements that make them appealing, but they also come with their distinct challenges. It's important to consider each aspect before deciding to relocate or plan a visit.
Distance between
Dallas, TX and
Newark, NJ : 1,360.7 miles
Dallas's population is larger by 319%. Its population has grown by 99,877 people (8.4%) since 2000. The population of Newark has grown by 33,674 people (12.3%) during that time.
Dallas and Newark vary greatly in crime levels. Although crime rates have been decreasing in recent years, Newark has a high crime rate compared to the national average, particularly in violent crime. Dallas' crime rate is lower than Newark's but still higher than the national median. Both cities have programs and initiatives in place for crime prevention and safety, so it's vital to research the neighborhoods you would be living in or visiting.
City-data.com crime index counts serious crimes and violent crime more heavily. It adjusts for the number of visitors and daily workers commuting into cities. (higher means more crime, U.S. average = 301.1)
City-data.com crime index counts serious crimes and violent crime more heavily. It adjusts for the number of visitors and daily workers commuting into cities. (higher means more crime, U.S. average = 301.1)
Sex Offenders
According to our data, there are 4,297 registered sex offenders living in Dallas and 560 registered sex offenders living in . The ratio of residents to sex offenders in Dallas is 307 to 1; the ratio in Newark is 503 to 1. The number of registered sex offenders compared to the number of residents is larger in Dallas than in Newark.
Cost of Living
The cost of living in Dallas is generally lower than Newark. This lower cost is noticeable in areas like housing, groceries, and general living expenses. Newark has a dense population and limited space, which impacts the cost of living and housing affordability. However, Newark's proximity to New York City may be a factor that offsets the cost for some.
Income Tax
Texas does not have a state income tax, making Dallas an attractive location for those conscious of income tax rates. However, Newark, NJ, with an income tax rate of 5.525% for most incomes, and a top rate of 8.97% on incomes over $500,000 can represent a larger financial burden.
Property Tax
Dallas has a property tax rate of about 2.06%, which is on the high side for the US. Newark, however, has a rate of 2.74%, one of the highest in the nation.
Sales Tax
The sales tax of Dallas is 8.25%, which includes the Texas state sales tax of 6.25% and a Dallas local sales tax of 2%. Newark has a lower overall sales tax of 6.625%, with no additional city sales tax on top of the New Jersey state tax.
Income
Type
Dallas
Newark
Estimated median household income
$57,995
$43,242
Estimated per capita income
$38,479
$23,767
Cost of living index (U.S. average is 100)
96.1
118.1
If you make $50,000 in Dallas, you will have to make $61,446 in Newark to maintain the same standard of living.
Geographical Conditions
Dallas offers a flat, prairie-like topography and is part of the Tornado Alley. It's also known for its extreme temperatures in the summer. Newark, with its coastal plain geography, experiences a milder climate. However, its location near the Atlantic Ocean makes it vulnerable to hurricanes and coastal storms.
Both cities have an array of educational opportunities. Dallas is home to several colleges and universities, including Southern Methodist University and the University of Texas Southwestern Medical Center. Newark, a vital education hub, hosts Rutgers University - Newark, the New Jersey Institute of Technology (NJIT), and a campus of Berkeley College.
In terms of work and economy, Dallas and Newark operate in different sectors. Dallas' economy is primarily driven by sectors like defense, financial services, information technology, and life sciences. Newark, on the other hand, is a major hub for shipping, transportation, and manufacturing industries. Newark's economy also thrives in the sectors of healthcare, education, and public administration.
Biggest Employers
The largest employer in Dallas is American Airlines, followed by Bank of America and Texas Health Resources. For Newark, major employers include the Newark Liberty International Airport, University Hospital, Rutgers University, and several city, county, and federal government offices.
There were 2,245 building permits issued in Dallas in 2012 (1436 more than in 2011) compared to 1 building permits issued in Newark in 2012.
In Dallas (Dallas County), 57.3% voted for Democrats and 41.8% for Republicans in 2012 Presidential Election. In Newark (Essex County), 78.3% voted for Democrats and 21.4% for Republicans.
Elections
Type
Democrats
Republicans
Other
Year
Dallas
Newark
Dallas
Newark
Dallas
Newark
2020
65.1%
77.4%
33.4%
21.9%
1.4%
0.7%
2016
60.8%
77.2%
34.7%
20.2%
4.5%
2.6%
2012
57.3%
78.3%
41.8%
21.4%
1.0%
0.3%
2008
57.4%
76.2%
42.0%
23.5%
0.6%
0.3%
2004
49.0%
70.7%
50.4%
28.9%
0.5%
0.4%
2000
45.0%
71.9%
52.7%
25.9%
2.4%
2.2%
1996
46.0%
69.0%
46.8%
25.6%
7.2%
5.4%
Breakdown of population affiliated with a religious congregation
Type
Adherents
Congregations
Religion
Dallas
Newark
Dallas
Newark
CATHOLIC CHURCH
18.9%
33.4%
2.4%
10.7%
SOUTHERN BAPTIST CONVENTION
11.0%
0.3%
31.1%
2.6%
MUSLIM ESTIMATE
3.6%
3.0%
1.1%
2.8%
EPISCOPAL CHURCH
1.0%
0.9%
1.5%
3.6%
SEVENTH DAY ADVENTIST CHURCH
0.5%
0.8%
1.7%
2.8%
EVANGELICAL LUTHERAN CHURCH IN AMERICA
0.3%
0.1%
0.9%
1.0%
AMERICAN BAPTIST CHURCHES IN THE USA
0.1%
2.1%
0.2%
8.2%
Weather
Dallas experiences a humid subtropical climate with hot, humid summers and mild winters. You can expect summer temperatures to regularly hit above 90°F. On the other hand, Newark has a humid continental climate, meaning summers are typically hot and muggy, while winters can be cold to very cold with ample snowfall. If you prefer a warmer climate, Dallas might be more appealing.
Weather and climate
Type
Dallas
Newark
Temperature - Average
66.6°F
54°F
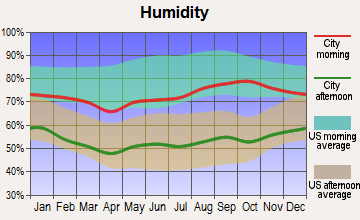
Humidity - Average morning or afternoon humidity
71.3%
67.3%
Humidity - Differences between morning and afternoon humidity
34%
30%
Humidity - Maximum monthly morning or afternoon humidity
82%
77%
Humidity - Minimum monthly morning or afternoon humidity
48%
47%
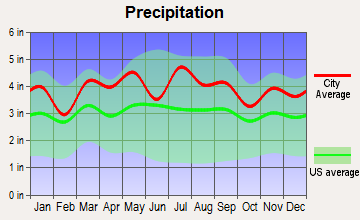
Precipitation - Yearly average
37.3 in
47 in
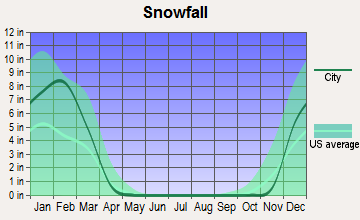
Snowfall - Yearly average
4.2 in
60.3 in
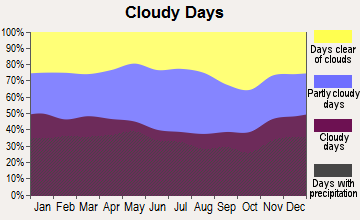
Clouds - Number of days clear of clouds
22.8%
15.7%
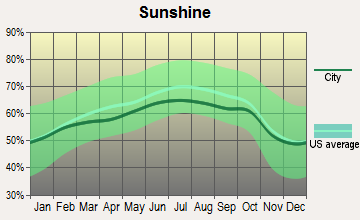
Sunshine amount - Average
66.6%
60.2%
Sunshine amount - Differences during a year
20%
20%
Sunshine amount - Maximum monthly
74%
64%
Sunshine amount - Minimum monthly
54%
44%
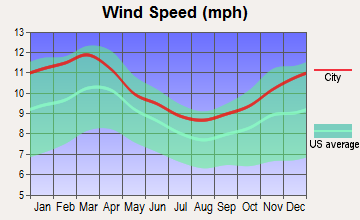
Wind speed - Average
10.3 mph
10.6 mph
Average climate in Dallas, Texas
Average climate in Newark, New Jersey
Air pollution
Type
AQI
CO
NO2
OZONE
PB
PM10
PM25
SO2
Year
Dallas
Newark
Newark
Dallas
Newark
Dallas
Newark
Dallas
Newark
Newark
Dallas
Newark
Dallas
Newark
2018
86
95
0.30
N/A
5.7
14.4
28.7
23.4
N/A
N/A
N/A
N/A
9.7
8.7
0.4
0.2
2017
84
99
0.30
N/A
5.5
15.1
28.6
22.7
N/A
N/A
N/A
N/A
9.1
8.7
0.3
0.2
2016
81
95
0.31
N/A
6.1
15.5
27.2
23.6
N/A
N/A
N/A
N/A
8.4
8.8
0.2
0.3
2015
85
100
0.33
N/A
6.5
16.7
26.7
23.2
N/A
N/A
N/A
N/A
8.9
8.7
0.3
0.5
2014
83
95
0.33
N/A
6.3
18.8
27.6
23.5
N/A
N/A
N/A
N/A
9.9
8.2
0.3
0.8
2013
97
97
0.35
N/A
7.3
18.3
28.8
23.5
N/A
N/A
N/A
N/A
13.0
9.1
0.2
0.8
2012
116
99
0.33
N/A
8.6
18.5
31.0
23.5
N/A
N/A
N/A
N/A
12.0
9.2
0.3
1.1
2011
98
108
0.36
N/A
9.4
21.2
30.9
22.7
N/A
N/A
N/A
N/A
11.9
8.5
0.6
2.0
2010
79
114
0.33
N/A
9.4
19.4
28.3
26.3
N/A
N/A
N/A
N/A
N/A
8.2
0.7
1.9
2009
88
104
0.38
N/A
9.2
21.6
28.8
19.6
N/A
N/A
N/A
N/A
N/A
9.8
0.5
2.3
2008
88
111
0.46
N/A
9.8
22.4
29.2
21.8
0.121
0.013
N/A
N/A
N/A
12.4
0.5
3.4
2007
94
123
0.51
N/A
11.0
23.5
25.7
22.3
0.070
0.016
N/A
N/A
N/A
12.7
0.3
4.3
2006
107
116
0.64
N/A
10.8
24.6
30.6
21.5
0.106
0.018
N/A
N/A
N/A
12.9
0.7
5.3
2005
108
113
0.78
N/A
13.0
26.1
29.7
20.5
0.142
N/A
N/A
N/A
11.0
N/A
0.9
7.2
2004
96
108
0.79
N/A
12.3
25.4
26.0
19.5
0.099
0.030
N/A
N/A
N/A
N/A
0.8
6.8
2003
102
108
0.76
N/A
13.6
26.1
27.1
18.1
0.121
0.013
26.9
N/A
N/A
N/A
1.0
6.0
2002
100
124
0.65
N/A
14.0
28.5
25.2
18.3
0.080
0.008
26.1
N/A
N/A
N/A
0.4
3.8
2001
100
125
0.79
N/A
14.3
30.1
26.0
21.2
0.069
0.020
26.7
N/A
N/A
N/A
1.0
6.2
2000
109
116
1.02
N/A
14.5
31.2
27.0
20.0
0.092
0.022
22.2
N/A
N/A
N/A
1.1
6.7
Natural disasters
Type
Dallas
Newark
Tornado activity compared to U.S. average
254.7%
64.1%
Earthquake activity compared to U.S. average
567%
31.6%
Natural disasters compared to U.S. average
21%
30%
Transportation
Dallas is more car-centric, with sprawling highways and vast distances to traverse. Public transit exists via the Dallas Area Rapid Transit (DART) system. In contrast, Newark's dense urban structure is well-served by extensive public transit, including New Jersey Transit buses and trains, the Newark Light Rail, and the PATH train to Manhattan.
Transport
Type
Dallas
Newark
Amtrak stations
1
2
Amtrak stations nearby
1
3
FAA registered aircraft
2
20
FAA registered aircraft manufacturers and dealers
56
0
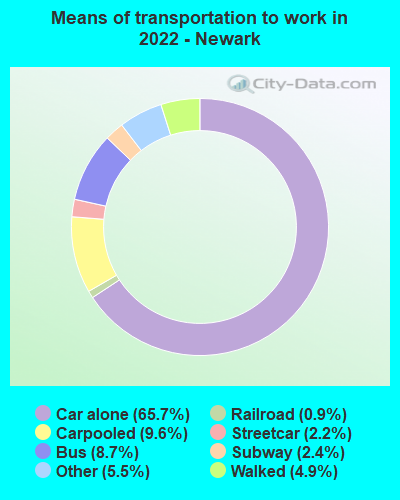
Means of transportation to work
Type
Dallas
Newark
Bicycle
0.3%
0.2%
Bus
1.4%
6.8%
Carpooled
10.9%
9.2%
Car alone
83.9%
69.3%
Railroad
0.2%
0.2%
Streetcar
0.1%
0.9%
Subway
0.2%
1.2%
Taxicab
0.1%
0.7%
Walked
1.6%
3.5%
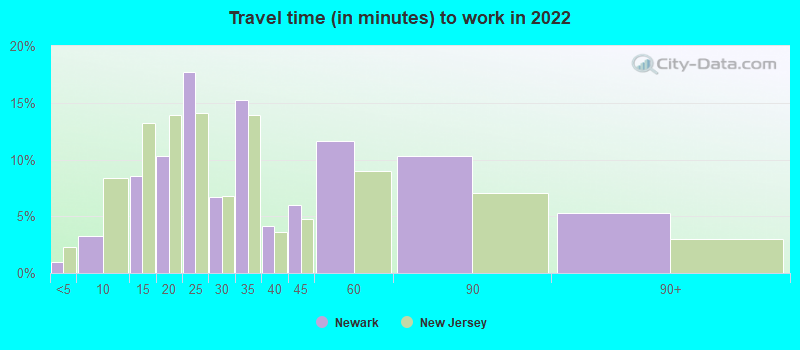
Average travel time to work
Type
Dallas
Newark
Average
31.5 min
33.2 min
Other means
26.5 min
28 min
Public transportation
46 min
45.1 min
Private vehicle occupancy
Type
Dallas
Newark
Average
1.2
1.2
Drove alone
86.8%
81.7%
In 2 person carpool
9%
14.8%
In 3 person carpool
2.6%
2.4%
In 4 person carpool
0.9%
0.6%
In 5-6 person carpool
0.5%
0.1%
In 7+ person carpool
0.2%
0.4%
How many people usually rode to work in the car, truck or van.
Real Estate
The real estate markets in both cities differ significantly. Dallas has a more substantial real-estate market with relatively affordable houses and apartments. Newark, being part of the densely populated Greater New York area, has higher real estate prices, but offers proximity to New York City's opportunities.
Neighborhoods
Each city offers a variety of neighborhoods, each with a unique character. Dallas' popular neighborhoods include Uptown, Oak Lawn, and Deep Ellum, known for their nightlife, restaurants, and arts scenes. Newark's most celebrated neighborhoods, like the Ironbound, Downtown, and the Central Ward, are recognized for their cultural diversity, historical architecture, and vibrant nightlife.
Houses and residents
Type
Dallas
Newark
Houses
591,773
122,145
Average household size (people)
2.6
2.8
Median year apartment built
1987
1967
Median year house/condo built
1969
1960
Length of stay in the house since moving in
13.9 years
17.1 years
Houses occupied
536,008 (90.6%)
115,145 (94.3%)
Houses occupied by owners
229,518 (42.8%)
24,002 (20.8%)
Houses occupied by renters
306,490 (57.2%)
91,143 (79.2%)
Median rent asked for vacant for-rent units
$1,403
$408.22
Median monthly housing costs
$1,225
$1,277
Median price asked for vacant for-sale houses and condos
$574,934
$153,754
Estimated median house or condo value
$267,600
$323,200
Median numbers of rooms
4.6
4.5
Median number of rooms in apartments
3.7
4.2
Median number of rooms in houses and condos
6.1
5.7
Median house price - detached houses
$410,272
$321,688
Median house price - in 2-unit structures
$255,160
$347,644
Median house price - in 3-to-4-unit structures
$230,927
$337,992
Median house price - in 5 or more unit structures
$444,589
$210,604
Median house price - mobile homes
$91,039
$129,070
Median house price - Townhouses or other attached units
$350,045
$224,107
Median house price - All housing units
$402,215
$325,388
Median house age
40
55
Renting percentage
55.9%
77.9%
Housing density (houses/condos per square mile)
1,727.6
5,132.8
House value disparities
41.3%
31.5%
Household income disparities
48.2%
47.8%
Median household income for houses/condes with a mortgage
$103,798
$71,676
Median household income for apartments without a mortgage
$61,909
$62,906
Housing units without a mortgage
1,309 (1%)
459 (2.7%)
Housing units with both a second mortgage and home equity loan
3,320 (2.6%)
647 (3.8%)
Housing units with a mortgage
124,846 (99%)
16,603 (97.3%)
Housing units with a home equity loan
204 (0.2%)
0 (0%)
Housing units with a second mortgage
5,351 (4.2%)
769 (4.5%)
House/condo owner moved in on average (years ago)
12
18
House/condo renter moved in on average (years ago)
1
5
Housing units lacking complete kitchen facilities
1.2%
2.3%
Housing units lacking complete plumbing facilities
0.9%
1%
Housing units in structures
Housing units in structures
Dallas
Newark
One, detached
41.8%
10.7%
One, attached
4.3%
11.4%
Two
1.5%
19.5%
3 or 4
4.9%
21.1%
5 to 9
7.9%
8.2%
10 to 19
12.1%
6.0%
20 to 49
8.1%
6.5%
50 or more
18.4%
15.8%
Mobile homes
1.0%
0.9%
Boats, RVs, vans, etc.
0.0%
0.1%
Median real estate property taxes paid for housing units
Self-employed workers in own not incorporated business
43,703
7,752
State government workers
17,325
5,591
Unpaid family workers
754
121
Industries and Occupations
Key industries in Dallas include tech, financial services, defense, life sciences, and telecommunications, offering myriad opportunities for people seeking employment. Newark's dominant industries are transportation, education, healthcare, manufacturing, and public administration. Both cities have a diverse mix of occupations available given their economic composition.
Dallas boasts some of the best healthcare facilities in Texas, including the UT Southwestern Medical Center. Newark is home to the exceptional University Hospital, a teaching hospital affiliated with Rutgers Biomedical and Health Sciences.
Health (county statistics)
Type
Dallas
Newark
General health status score of residents in this county from 1 (poor) to 5 (excellent)
Dallas has an extensive road network, offering multiple highways connecting the city to other major locales. Meanwhile, Newark prides itself on an excellent public transit system, with several bus and train lines, light rail transit, and a major international airport. Both cities have ambitious infrastructure plans to increase connectivity and suitability.
Infrastructure
Type
Dallas
Newark
Hospitals
74
8
TV stations
25
31
Bank branches located here
394
69
Bank institutions located here
80
19
Main business address for public companies
122
15
Drinking water stations with no reported violations in the past
8
0
Drinking water stations with reported violations in the past
HMDA - Conventional home purchase loans - Applications denied
Year
Dallas
Newark
1999
5,030
429
2000
3,390
515
2001
2,626
536
2002
2,657
547
2003
3,617
740
2004
5,460
1,167
2005
7,445
2,198
2006
7,397
3,193
2007
5,056
2,300
2008
2,200
508
2009
1,121
182
Culture and Food
Both Dallas and Newark offer vibrant culture and dining options. Dallas is known for its BBQ, Tex-Mex, and world-class restaurants. It's also a hub for country music and has a growing arts scene. Newark boasts one of the nation's largest Portuguese communities, resulting in a rich food culture with standout dishes like Portuguese BBQ chicken and dishes from the Ironbound District. Newark also has a significant jazz music history.
Sports Teams
Dallas hosts several professional sports teams, including the Dallas Cowboys (NFL), Dallas Mavericks (NBA), Texas Rangers (MLB), and Dallas Stars (NHL). Newark, on the other hand, is home to the New Jersey Devils (NHL), but residents also support New York City's sports teams, given its proximity.


 Dallas, TX
 Newark, NJ