Dallas, TX and Orlando, FL are two cities that offer unique lifestyles with distinctive amenities and challenges. Both cities have thriving economies, diverse populations, and are hubs for significant industries. However, they differ in aspects such as weather, cost of living, taxes, and culture. This comprehensive comparison will help those planning to visit or relocate to either city gain a clear understanding of the similarities and differences.
Distance between
Dallas, TX and
Orlando, FL : 961.0 miles
Dallas's population is larger by 317%. Its population has grown by 99,877 people (8.4%) since 2000. The population of Orlando has grown by 123,203 people (66.3%) during that time.
Dallas and Orlando both have higher crime rates compared to the national average. Dallas, however, has a lower violent crime rate when compared to Orlando. Security measures, police response rates, and community efforts play significant roles in maintaining safety in both cities.
City-data.com crime index counts serious crimes and violent crime more heavily. It adjusts for the number of visitors and daily workers commuting into cities. (higher means more crime, U.S. average = 301.1)
City-data.com crime index counts serious crimes and violent crime more heavily. It adjusts for the number of visitors and daily workers commuting into cities. (higher means more crime, U.S. average = 301.1)
Sex Offenders
According to our data, there are 4,271 registered sex offenders living in Dallas and 2,506 registered sex offenders living in . The ratio of residents to sex offenders in Dallas is 309 to 1; the ratio in Orlando is 111 to 1. The number of registered sex offenders compared to the number of residents is a lot smaller in Dallas than in Orlando.
Cost of Living
The cost of living is relatively lower in Dallas compared to Orlando. Groceries, health care, and utilities are cheaper in Dallas, but housing costs are comparable in both cities. However, Dallas has a higher median household income which may balance out the overall cost of living.
Income Tax
Both Texas (Dallas) and Florida (Orlando) have no state income tax. Consequently, no additional state income tax needs to be paid apart from the federal income tax.
Property Tax
Dallas has one of the highest property tax rates in the country, at about 2.08%. On the contrary, Orlando, Florida has lower property tax rates, approximately 0.95%.
Sales Tax
The combined sales tax rate for Dallas is 8.25%, while in Orlando, it's 6.5%. Texas has no state income tax, so visitors and residents in Dallas only pay the federal income tax. Florida also does not have a state income tax.
Income
Type
Dallas
Orlando
Estimated median household income
$57,995
$54,167
Estimated per capita income
$38,479
$36,370
Cost of living index (U.S. average is 100)
96.1
93.5
If you make $50,000 in Orlando, you will have to make $51,390 in Dallas to maintain the same standard of living.
Geographical Conditions
Dallas is part of the Southern Great Plains and tends to be relatively flat with a mix of prairie, woodlands, and lakes. Orlando is located in central Florida and is fringed by various bodies of water, offering a more tropical environment.
Both cities have good educational facilities, with Dallas being home to several highly-rated schools and colleges. Orlando also has a strong educational system, with the University of Central Florida being one of the biggest undergraduate campuses in the United States. Both cities provide school choice options, including public, magnet, and charter schools.
Dallas has a diverse economy, with industries like telecommunications, banking, and technology driving growth. Orlando's economy is primarily driven by tourism, with supporting sectors in aerospace, software design, and digital media. Both cities have relatively low unemployment rates, with a variety of job opportunities available in different sectors.
Biggest Employers
In Dallas, the biggest employers include American Airlines, Bank of America, and Texas Health Resources. In Orlando, the largest employers are Walt Disney World, Universal Orlando Resort, and Florida Hospital.
There were 2,245 building permits issued in Dallas in 2012 (1436 more than in 2011) compared to 990 building permits issued in Orlando in 2012 (682 more than in 2011).
In Dallas (Dallas County), 57.3% voted for Democrats and 41.8% for Republicans in 2012 Presidential Election. In Orlando (Orange County), 58.8% voted for Democrats and 40.5% for Republicans.
Elections
Type
Democrats
Republicans
Other
Year
Dallas
Orlando
Dallas
Orlando
Dallas
Orlando
2020
65.1%
61.1%
33.4%
37.9%
1.4%
1.0%
2016
60.8%
60.0%
34.7%
35.5%
4.5%
4.5%
2012
57.3%
58.8%
41.8%
40.5%
1.0%
0.6%
2008
57.4%
59.4%
42.0%
40.6%
0.6%
0.0%
2004
49.0%
50.0%
50.4%
49.7%
0.5%
0.3%
2000
45.0%
50.2%
52.7%
48.1%
2.4%
1.7%
1996
46.0%
45.7%
46.8%
45.9%
7.2%
8.4%
Breakdown of population affiliated with a religious congregation
Type
Adherents
Congregations
Religion
Dallas
Orlando
Dallas
Orlando
CATHOLIC CHURCH
18.9%
12.7%
2.4%
2.5%
SOUTHERN BAPTIST CONVENTION
11.0%
5.5%
31.1%
14.3%
MUSLIM ESTIMATE
3.6%
1.1%
1.1%
1.1%
EPISCOPAL CHURCH
1.0%
0.7%
1.5%
1.9%
SEVENTH DAY ADVENTIST CHURCH
0.5%
1.8%
1.7%
4.7%
EVANGELICAL LUTHERAN CHURCH IN AMERICA
0.3%
0.3%
0.9%
1.2%
LUTHERAN CHURCH
0.3%
0.3%
0.7%
1.0%
Weather
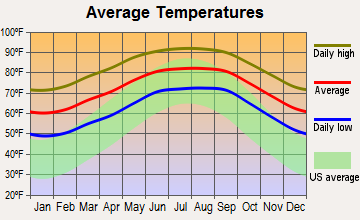
Dallas experiences a more diverse weather pattern, with hot summers and mild winters. Orlando, located in Central Florida, boasts a subtropical climate with high humidity levels and warm temperatures almost year-round. Both cities are susceptible to storms, but Orlando is at a higher risk of hurricanes.
Weather and climate
Type
Dallas
Orlando
Temperature - Average
66.6°F
72.4°F
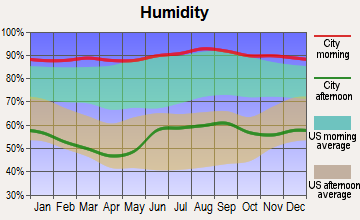
Humidity - Average morning or afternoon humidity
71.3%
77.6%
Humidity - Differences between morning and afternoon humidity
34%
44%
Humidity - Maximum monthly morning or afternoon humidity
82%
91%
Humidity - Minimum monthly morning or afternoon humidity
48%
47%
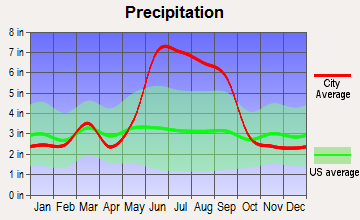
Precipitation - Yearly average
37.3 in
48.7 in
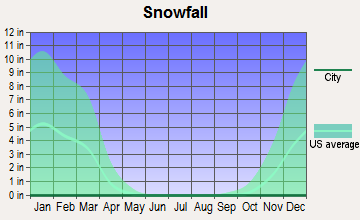
Snowfall - Yearly average
4.2 in
0 in
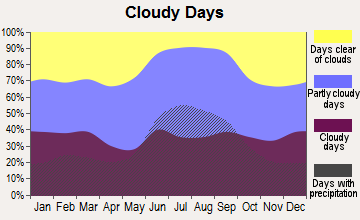
Clouds - Number of days clear of clouds
22.8%
14.8%
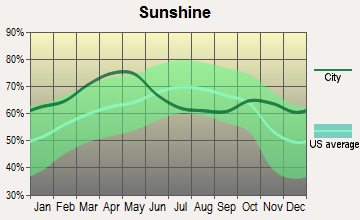
Sunshine amount - Average
66.6%
74.5%
Sunshine amount - Differences during a year
20%
17.8%
Sunshine amount - Maximum monthly
74%
79.7%
Sunshine amount - Minimum monthly
54%
61.9%
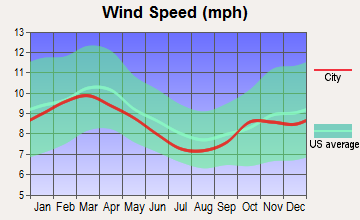
Wind speed - Average
10.3 mph
8.3 mph
Average climate in Dallas, Texas
Average climate in Orlando, Florida
Air pollution
Type
AQI
CO
NO2
OZONE
PB
PM10
PM25
SO2
Year
Dallas
Orlando
Orlando
Dallas
Orlando
Dallas
Orlando
Dallas
Orlando
Dallas
Orlando
Dallas
2018
86
65
0.49
N/A
5.7
4.5
28.7
28.1
N/A
N/A
12.3
N/A
9.7
7.1
0.4
N/A
2017
84
70
0.46
N/A
5.5
4.1
28.6
28.3
N/A
N/A
13.8
N/A
9.1
8.1
0.3
N/A
2016
81
68
0.48
N/A
6.1
4.1
27.2
29.1
N/A
N/A
13.8
N/A
8.4
8.6
0.2
N/A
2015
85
64
0.51
N/A
6.5
4.0
26.7
26.9
N/A
N/A
14.2
N/A
8.9
8.4
0.3
N/A
2014
83
65
0.45
N/A
6.3
4.9
27.6
27.1
N/A
N/A
13.9
N/A
9.9
8.5
0.3
N/A
2013
97
61
0.29
N/A
7.3
4.5
28.8
26.2
N/A
N/A
14.1
N/A
13.0
8.2
0.2
N/A
2012
116
66
0.38
N/A
8.6
5.4
31.0
26.7
N/A
N/A
14.9
N/A
12.0
8.5
0.3
N/A
2011
98
72
0.43
N/A
9.4
5.4
30.9
28.0
N/A
N/A
15.3
N/A
11.9
9.8
0.6
N/A
2010
79
69
0.40
N/A
9.4
5.6
28.3
27.3
N/A
N/A
15.7
N/A
N/A
9.5
0.7
N/A
2009
88
69
0.33
N/A
9.2
5.9
28.8
27.0
N/A
N/A
16.0
N/A
N/A
9.5
0.5
N/A
2008
88
73
0.25
N/A
9.8
6.1
29.2
28.0
0.121
N/A
16.8
N/A
N/A
10.2
0.5
N/A
2007
94
83
0.37
N/A
11.0
6.9
25.7
30.3
0.070
N/A
16.9
N/A
N/A
11.0
0.3
N/A
2006
107
87
0.39
N/A
10.8
8.5
30.6
31.5
0.106
N/A
21.4
N/A
N/A
11.6
0.7
N/A
2005
108
89
0.56
N/A
13.0
8.6
29.7
29.6
0.142
N/A
18.7
N/A
11.0
12.6
0.9
N/A
2004
96
86
0.52
N/A
12.3
9.5
26.0
28.4
0.099
N/A
18.5
N/A
N/A
11.7
0.8
N/A
2003
102
84
0.44
N/A
13.6
11.0
27.1
27.9
0.121
N/A
17.8
N/A
N/A
10.9
1.0
N/A
2002
100
84
0.47
N/A
14.0
11.3
25.2
25.9
0.080
N/A
17.7
N/A
N/A
11.1
0.4
N/A
2001
100
88
0.64
N/A
14.3
12.3
26.0
26.6
0.069
N/A
19.6
N/A
N/A
12.2
1.0
N/A
2000
109
77
0.72
N/A
14.5
12.4
27.0
N/A
0.092
N/A
N/A
N/A
N/A
N/A
1.1
N/A
Natural disasters
Type
Dallas
Orlando
Tornado activity compared to U.S. average
254.7%
150.1%
Earthquake activity compared to U.S. average
567%
11.3%
Natural disasters compared to U.S. average
21%
20%
Transportation
Dallas has a more efficient public transit system, including the Dallas Area Rapid Transit (DART), which includes buses and train lines. Orlando relies heavily on car transportation, with fewer public transit options.
Transport
Type
Dallas
Orlando
Amtrak stations
1
1
Amtrak stations nearby
1
3
FAA registered aircraft
2
616
FAA registered aircraft manufacturers and dealers
56
61
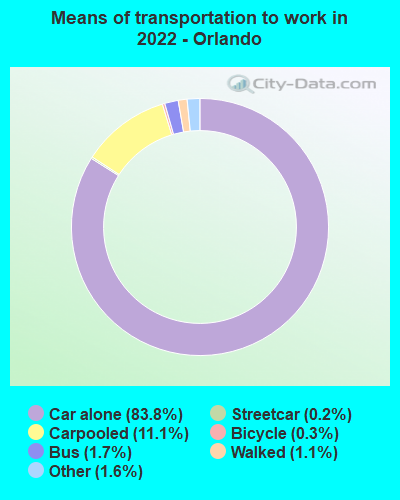
Means of transportation to work
Type
Dallas
Orlando
Bicycle
0.3%
0.3%
Bus
1.4%
1.7%
Carpooled
10.9%
10.9%
Car alone
83.9%
83.7%
Motorcycle
0%
0.2%
Railroad
0.2%
0%
Subway
0.2%
0.1%
Taxicab
0.1%
0.1%
Walked
1.6%
1.5%
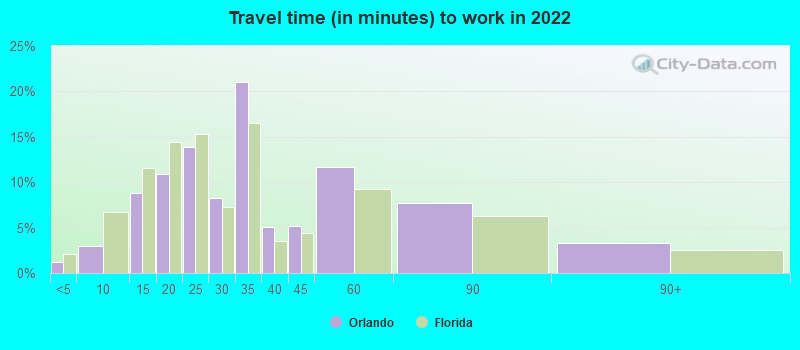
Average travel time to work
Type
Dallas
Orlando
Average
31.5 min
33.2 min
Other means
26.5 min
24.4 min
Public transportation
46 min
49.2 min
Private vehicle occupancy
Type
Dallas
Orlando
Average
1.2
1.1
Drove alone
86.8%
89.9%
In 2 person carpool
9%
7.2%
In 3 person carpool
2.6%
2%
In 4 person carpool
0.9%
0.4%
In 5-6 person carpool
0.5%
0.3%
In 7+ person carpool
0.2%
0.1%
How many people usually rode to work in the car, truck or van.
Real Estate
Housing prices in both cities are on the rise, but Dallas offers more affordable options compared to Orlando. Rental prices are also higher in Orlando due to the high demand from the tourism industry.
Neighborhoods
Dallas boasts lively neighborhoods like Deep Ellum known for its arts scene, and Uptown for its high-end boutiques and thriving nightlife. Orlando, on the other hand, has scenic neighborhoods like Winter Park with its tree-lined avenues and cobblestone streets, and Lake Eola Heights with its historic homes and beautiful lake.
Houses and residents
Type
Dallas
Orlando
Houses
591,773
149,940
Average household size (people)
2.6
2.3
Median year apartment built
1987
1992
Median year house/condo built
1969
1987
Length of stay in the house since moving in
13.9 years
10.7 years
Houses occupied
536,008 (90.6%)
130,037 (86.7%)
Houses occupied by owners
229,518 (42.8%)
49,048 (37.7%)
Houses occupied by renters
306,490 (57.2%)
80,989 (62.3%)
Median rent asked for vacant for-rent units
$1,403
$1,141
Median monthly housing costs
$1,225
$1,401
Median price asked for vacant for-sale houses and condos
$574,934
$310,225
Estimated median house or condo value
$267,600
$319,800
Median numbers of rooms
4.6
4.5
Median number of rooms in apartments
3.7
3.9
Median number of rooms in houses and condos
6.1
5.9
Median house price - detached houses
$410,272
$429,298
Median house price - in 2-unit structures
$255,160
$232,136
Median house price - in 3-to-4-unit structures
$230,927
$131,385
Median house price - in 5 or more unit structures
$444,589
$225,567
Median house price - mobile homes
$91,039
$190,092
Median house price - Townhouses or other attached units
$350,045
$309,224
Median house price - All housing units
$402,215
$378,951
Median house age
40
31
Renting percentage
55.9%
60.5%
Housing density (houses/condos per square mile)
1,727.6
1,603.7
House value disparities
41.3%
34.3%
Household income disparities
48.2%
47.8%
Median household income for houses/condes with a mortgage
$103,798
$106,563
Median household income for apartments without a mortgage
$61,909
$44,446
Housing units without a mortgage
1,309 (1%)
853 (2.5%)
Housing units with both a second mortgage and home equity loan
3,320 (2.6%)
2,153 (6.4%)
Housing units with a mortgage
124,846 (99%)
33,038 (97.5%)
Housing units with a home equity loan
204 (0.2%)
174 (0.5%)
Housing units with a second mortgage
5,351 (4.2%)
2,480 (7.3%)
House/condo owner moved in on average (years ago)
12
6
House/condo renter moved in on average (years ago)
1
1
Housing units lacking complete kitchen facilities
1.2%
0.4%
Housing units lacking complete plumbing facilities
0.9%
0.2%
Housing units in structures
Housing units in structures
Dallas
Orlando
One, detached
41.8%
31.1%
One, attached
4.3%
10.2%
Two
1.5%
2.4%
3 or 4
4.9%
6.2%
5 to 9
7.9%
11.0%
10 to 19
12.1%
14.4%
20 to 49
8.1%
12.5%
50 or more
18.4%
12.1%
Mobile homes
1.0%
0.2%
Median real estate property taxes paid for housing units
Self-employed workers in own not incorporated business
43,703
9,860
State government workers
17,325
4,084
Unpaid family workers
754
397
Industries and Occupations
In Dallas, the primary industries include information technology, financial services, defense, and life sciences. Orlando's economy is largely centered around tourism, though it also has a growing technology scene and a strong healthcare sector.
Both Dallas and Orlando are renowned for their healthcare services. Dallas is home to the Southwestern Medical Center, while Orlando's AdventHealth is a nationally recognized hospital.
Health (county statistics)
Type
Dallas
Orlando
General health status score of residents in this county from 1 (poor) to 5 (excellent)
Dallas has superior infrastructure, including high-speed roadways, multiple airports, and broad availability of public transportation. In contrast, Orlando's infrastructure leans more towards serving the tourism industry with numerous hotels, resorts, and theme parks.
Infrastructure
Type
Dallas
Orlando
Hospitals
74
10
TV stations
25
29
Arenas or stadiums
2
2
Bank branches located here
394
194
Bank institutions located here
80
31
Main business address for public companies
122
39
Drinking water stations with no reported violations in the past
8
13
Drinking water stations with reported violations in the past
HMDA - Conventional home purchase loans - Applications denied
Year
Dallas
Orlando
1999
5,030
1,290
2000
3,390
623
2001
2,626
376
2002
2,657
316
2003
3,617
778
2004
5,460
1,264
2005
7,445
2,988
2006
7,397
3,465
2007
5,056
3,112
2008
2,200
1,210
2009
1,121
324
Culture and Food
Dallas offers a blend of Southwestern and Mexican cuisines, with barbeque, and Tex-Mex being local favorites. The city also hosts a number of cultural festivals and events throughout the year. Orlando's culinary scene is heavily influenced by its diverse population and proximity to the coast, with seafood dishes being popular. It's also well-known for its cultural events, music festivals, and art shows.
Sports Teams
Dallas residents are proud of their sports teams, which include the Dallas Cowboys (NFL), Dallas Mavericks (NBA), and Texas Rangers (MLB). Orlando is home to the Orlando Magic (NBA) and Orlando City Soccer Club (MLS).


 Dallas, TX
 Orlando, FL