Denver and Lakewood, both located in Colorado, offer diverse experiences in terms of crime and safety, weather, cost of living, education, work and economy, and more. Denver, the state's capital, is a bustling metropolis with a thriving arts scene and sporting culture, while Lakewood is a suburb of Denver known for its tranquillity and outdoor recreational activities. However, both cities have a unique charm that caters to different tastes and lifestyles, making them appealing in their own ways.
Distance between
Denver, CO and
Lakewood, CO : 7.4 miles
Denver's population is larger by 354%. Its population has grown by 156,827 people (28.3%) since 2000. The population of Lakewood has grown by 12,479 people (8.7%) during that time.
Relative to its size, Denver has a higher crime rate than Lakewood. It is important to note, though, crime rates fluctuate between neighborhoods within each city. Downtown Denver has a higher crime rate than the city's quieter, residential areas, while Lakewood's crime rate is lower overall. However, both cities are committed to public safety and have numerous initiatives in place to combat crime.
City-data.com crime index counts serious crimes and violent crime more heavily. It adjusts for the number of visitors and daily workers commuting into cities. (higher means more crime, U.S. average = 301.1)
City-data.com crime index counts serious crimes and violent crime more heavily. It adjusts for the number of visitors and daily workers commuting into cities. (higher means more crime, U.S. average = 301.1)
Sex Offenders
According to our data, there are 1,923 registered sex offenders living in Denver and 416 registered sex offenders living in . The ratio of residents to sex offenders in Denver is 360 to 1; the ratio in Lakewood is 371 to 1. The number of registered sex offenders compared to the number of residents in Denver is near to than in Lakewood.
Cost of Living
With its urban setting and amenities, Denver has a higher cost of living compared to Lakewood. The cost of housing is a significant factor, with Denver having higher median home prices and rents. However, both cities offer a range of options from affordable to luxury, catering to a broad demographic spectrum.
Income Tax
Denver and Lakewood residents pay the same state income tax as each other, as the income tax is determined at the state level in Colorado.
Property Tax
Property taxes vary more widely, depending on the neighborhood and property value. Denver's property tax tends to be higher due to its higher median property values.
Sales Tax
Both cities are in the same county and thus share similar state and city sales tax rates. However, Denver imposes an additional sales tax for special projects and services, resulting in a slightly higher overall sales tax.
Income
Type
Denver
Lakewood
Estimated median household income
$81,630
$77,122
Estimated per capita income
$52,690
$46,404
Cost of living index (U.S. average is 100)
111.3
110.2
If you make $50,000 in Lakewood, you will have to make $50,499 in Denver to maintain the same standard of living.
Geographical Conditions
Both cities benefit from being located in the foothills of the Rocky Mountains, providing ample opportunities for outdoor recreation. Denver is located on high, rolling plains, while Lakewood's terrain is more varied, featuring several large parks and open spaces.
Both cities are served by Jefferson County Public Schools, one of the largest school districts in the state. Denver also has numerous charter and private schools, and is home to the University of Denver and Metropolitan State University. Lakewood has Red Rocks Community College and Colorado Christian University, but lacks Denver's diversity in educational opportunities.
Denver has a broader economy with stronger performance in sectors like technology, aerospace, and healthcare. Lakewood, primarily a residential suburb, has a smaller economy with fewer employment opportunities. Commuting to Denver for work is common among Lakewood residents.
Biggest Employers
Denver's biggest employers include Denver International Airport, the University of Colorado Denver, and HealthOne Corporation. On the other hand, Lakewood's major employers are the Federal Center, Terumo BCT, and St. Anthony Hospital.
There were 1,550 building permits issued in Denver in 2012 (847 more than in 2011) compared to 93 building permits issued in Lakewood in 2012 (23 less than in 2011).
In Denver (Denver County), 73.9% voted for Democrats and 24.3% for Republicans in 2012 Presidential Election. In Lakewood (Jefferson County), 51.6% voted for Democrats and 46.7% for Republicans.
Elections
Type
Democrats
Republicans
Other
Year
Denver
Lakewood
Denver
Lakewood
Denver
Lakewood
2020
80.1%
58.3%
18.3%
39.7%
1.6%
2.0%
2016
74.2%
49.2%
19.0%
42.3%
6.8%
8.6%
2012
73.9%
51.6%
24.3%
46.7%
1.7%
1.8%
2008
75.8%
54.0%
23.2%
44.9%
1.0%
1.1%
2004
69.7%
46.9%
29.3%
52.1%
0.9%
1.0%
2000
62.0%
43.0%
30.9%
51.1%
7.0%
5.9%
1996
61.8%
42.7%
30.0%
48.4%
8.2%
8.9%
Breakdown of population affiliated with a religious congregation
Type
Adherents
Congregations
Religion
Denver
Lakewood
Denver
Lakewood
CATHOLIC CHURCH
26.6%
15.0%
8.7%
5.1%
AMERICAN BAPTIST CHURCHES IN THE USA
2.1%
0.0%
4.3%
0.6%
EPISCOPAL CHURCH
1.1%
0.5%
3.2%
2.7%
SALVATION ARMY
1.1%
0.0%
0.7%
0.0%
SOUTHERN BAPTIST CONVENTION
0.9%
1.2%
6.8%
7.5%
SEVENTH DAY ADVENTIST CHURCH
0.7%
0.4%
3.0%
2.1%
MUSLIM ESTIMATE
0.5%
0.1%
0.9%
0.6%
EVANGELICAL LUTHERAN CHURCH IN AMERICA
0.4%
1.7%
2.7%
4.2%
LUTHERAN CHURCH
0.3%
1.1%
2.3%
3.3%
Weather
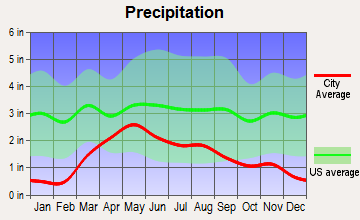
Denver and Lakewood share similar weather patterns as they are located geographically close to each other. Both cities enjoy more than 300 days of sunshine each year but also experience seasonal snowfall due to Colorado's high-altitude climate. Winter months can be chilly while summers are typically warm and dry.
Weather and climate
Type
Denver
Lakewood
Temperature - Average
49.5°F
48.1°F
Humidity - Average morning or afternoon humidity
50.6%
50.6%
Humidity - Differences between morning and afternoon humidity
20%
20%
Humidity - Maximum monthly morning or afternoon humidity
55%
55%
Humidity - Minimum monthly morning or afternoon humidity
35%
35%
Precipitation - Yearly average
17 in
17.3 in
Snowfall - Yearly average
114 in
114 in
Clouds - Number of days clear of clouds
19.2%
19.2%
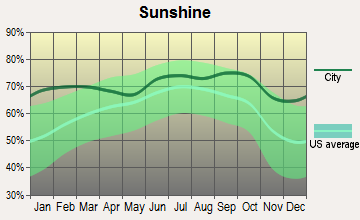
Sunshine amount - Average
75.6%
75.6%
Sunshine amount - Differences during a year
10%
10%
Sunshine amount - Maximum monthly
74%
74%
Sunshine amount - Minimum monthly
64%
64%
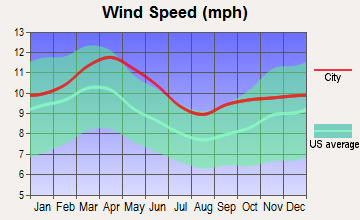
Wind speed - Average
8.6 mph
8.6 mph
Average climate in Denver, Colorado
Average climate in Lakewood, Colorado
Air pollution
Type
AQI
CO
NO2
OZONE
PB
PM10
PM25
SO2
Year
Denver
Lakewood
Denver
Lakewood
Denver
Lakewood
Denver
Lakewood
Denver
Lakewood
Denver
Lakewood
Denver
Lakewood
Denver
Lakewood
2018
100
100
0.50
0.42
25.4
22.5
27.9
34.3
N/A
N/A
29.2
29.2
8.6
8.4
0.7
0.7
2017
95
95
0.49
0.42
25.9
22.9
27.6
36.8
N/A
N/A
22.0
22.0
8.4
8.1
0.8
0.8
2016
90
90
0.53
0.46
27.7
24.6
27.2
36.0
N/A
N/A
22.6
22.6
8.7
7.8
1.0
1.0
2015
101
101
0.53
0.47
27.8
24.7
25.2
34.9
N/A
N/A
21.0
20.9
10.4
9.6
1.0
1.0
2014
94
94
0.53
0.46
25.4
23.8
24.6
32.9
N/A
N/A
25.1
24.8
10.1
10.1
1.3
1.3
2013
85
84
0.45
0.41
21.9
21.2
24.0
35.9
N/A
N/A
24.4
24.1
N/A
N/A
1.5
1.5
2012
91
91
0.33
0.34
18.9
18.9
26.2
37.9
N/A
N/A
24.9
24.6
N/A
N/A
1.4
1.3
2011
91
90
0.34
0.34
18.1
18.1
25.8
36.0
N/A
N/A
23.7
23.8
N/A
N/A
1.6
1.6
2010
82
79
0.43
0.42
16.3
16.3
23.6
34.7
N/A
N/A
26.4
26.5
N/A
N/A
1.0
1.0
2009
79
76
0.41
0.38
14.1
14.1
23.1
33.3
0.005
0.005
22.2
22.4
N/A
N/A
1.3
1.3
2008
85
85
0.43
0.42
17.3
17.3
26.0
37.2
0.008
0.008
25.2
25.4
N/A
N/A
1.6
1.6
2007
96
96
0.37
0.39
20.6
20.6
21.9
35.5
0.007
0.007
30.2
29.4
N/A
N/A
1.2
1.2
2006
89
89
0.51
0.48
19.0
19.0
22.1
33.4
0.008
0.021
28.0
28.0
N/A
N/A
1.4
1.4
2005
86
86
0.57
0.54
21.3
21.3
20.9
24.9
0.068
0.101
30.9
29.8
N/A
N/A
1.5
1.5
2004
82
82
0.60
0.56
21.2
21.2
19.2
23.8
0.012
0.033
28.6
28.6
N/A
N/A
1.8
1.8
2003
106
106
0.60
0.54
21.2
21.2
20.8
26.0
0.015
0.036
32.6
32.6
N/A
N/A
1.9
1.9
2002
86
86
0.65
0.61
19.2
19.2
20.4
25.5
0.014
0.026
35.7
35.7
N/A
N/A
2.5
2.4
2001
95
95
0.86
0.75
23.6
21.1
18.6
24.3
0.012
0.027
32.6
32.6
N/A
N/A
2.6
2.6
2000
93
94
0.81
0.73
13.4
11.8
19.2
25.2
0.013
0.030
12.2
12.2
N/A
N/A
2.1
2.1
Natural disasters
Type
Denver
Lakewood
Tornado activity compared to U.S. average
129.5%
117.8%
Earthquake activity compared to U.S. average
811.7%
827.5%
Natural disasters compared to U.S. average
10%
12%
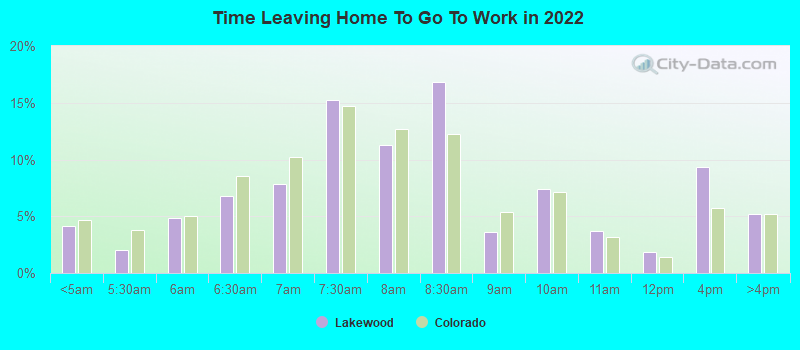
Transportation
Denver has an extensive public transportation system that includes light rail, buses, and a free shuttle service downtown. Lakewood residents often commute to Denver for work, taking advantage of the regional transit systems that connect the two cities.
Transport
Type
Denver
Lakewood
Amtrak stations
2
0
Amtrak stations nearby
2
1
FAA registered aircraft
602
100
FAA registered aircraft manufacturers and dealers
28
5
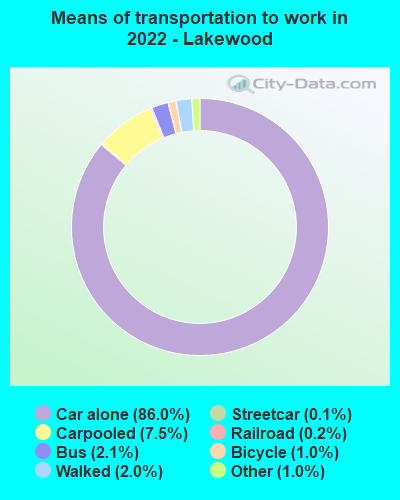
Means of transportation to work
Type
Denver
Lakewood
Bicycle
1.5%
0.8%
Bus
2.6%
1.4%
Carpooled
8.8%
6.9%
Car alone
81.1%
86.7%
Motorcycle
0.1%
0.1%
Railroad
1.2%
0.4%
Streetcar
0.2%
0.1%
Taxicab
0.1%
0%
Walked
2.8%
1.8%
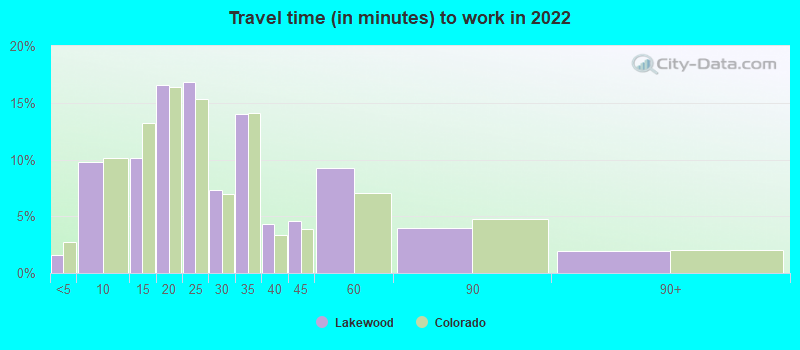
Average travel time to work
Type
Denver
Lakewood
Average
29.4 min
27.2 min
Other means
24.2 min
25.8 min
Public transportation
38 min
47.9 min
Private vehicle occupancy
Type
Denver
Lakewood
Average
1.1
1.1
Drove alone
90.6%
91.6%
In 2 person carpool
7.3%
6.9%
In 3 person carpool
1.3%
0.9%
In 4 person carpool
0.5%
0.3%
In 5-6 person carpool
0.2%
0.3%
How many people usually rode to work in the car, truck or van.
Real Estate
Real-estate in Denver is pricier due to the city's larger economy and diverse amenities. Lakewood offers more affordable housing options, but less diversity in terms of residential styles.
Neighborhoods
Denver neighborhoods offer a wide range of experiences, from the bustling LoDo with its vibrant nightlife to quiet, family-friendly neighborhoods like Park Hill. Lakewood also has various neighborhoods ranging from the vintage charm of Eiber to the upscale Solterra.
Houses and residents
Type
Denver
Lakewood
Houses
351,829
75,300
Average household size (people)
2.2
2.3
Median year apartment built
1981
1982
Median year house/condo built
1966
1973
Length of stay in the house since moving in
11.3 years
13.6 years
Houses occupied
326,634 (92.8%)
70,751 (94%)
Houses occupied by owners
164,429 (50.3%)
42,066 (59.5%)
Houses occupied by renters
162,205 (49.7%)
28,685 (40.5%)
Median rent asked for vacant for-rent units
$1,674
$1,927
Median monthly housing costs
$1,626
$1,462
Median price asked for vacant for-sale houses and condos
$970,375
$1,482,134
Estimated median house or condo value
$541,500
$483,300
Median numbers of rooms
4.6
5.4
Median number of rooms in apartments
3.5
3.8
Median number of rooms in houses and condos
6.4
6.9
Median house price - detached houses
$690,450
$552,372
Median house price - in 2-unit structures
$668,727
$455,488
Median house price - in 3-to-4-unit structures
$410,273
$791,684
Median house price - in 5 or more unit structures
$487,647
$257,898
Median house price - mobile homes
$174,140
$91,188
Median house price - Townhouses or other attached units
$568,100
$399,230
Median house price - All housing units
$644,007
$498,091
Median house age
47
45
Renting percentage
50%
41.1%
Housing density (houses/condos per square mile)
2,294.3
1,810.5
House value disparities
26.4%
23%
Household income disparities
44%
43.6%
Median household income for houses/condes with a mortgage
$120,615
$115,043
Median household income for apartments without a mortgage
$77,011
$67,387
Housing units without a mortgage
2,112 (1.7%)
482 (1.7%)
Housing units with both a second mortgage and home equity loan
9,615 (7.6%)
2,448 (8.8%)
Housing units with a mortgage
123,690 (98.3%)
27,297 (98.3%)
Housing units with a home equity loan
273 (0.2%)
273 (1%)
Housing units with a second mortgage
12,819 (10.2%)
3,417 (12.3%)
House/condo owner moved in on average (years ago)
7
10
House/condo renter moved in on average (years ago)
1
1
Housing units lacking complete kitchen facilities
1.3%
0.8%
Housing units lacking complete plumbing facilities
0.8%
0.1%
Housing units in structures
Housing units in structures
Denver
Lakewood
One, detached
42.9%
47.2%
One, attached
8.3%
10.7%
Two
2.1%
1.8%
3 or 4
3.1%
4.7%
5 to 9
3.6%
10.2%
10 to 19
7.0%
9.2%
20 to 49
10.4%
6.9%
50 or more
22.0%
7.8%
Mobile homes
0.4%
1.5%
Boats, RVs, vans, etc.
0.1%
0.0%
Median real estate property taxes paid for housing units
Self-employed workers in own not incorporated business
24,661
3,835
State government workers
15,204
2,728
Unpaid family workers
763
567
Industries and Occupations
Denver stands as a hub for several industries, including technology, aerospace, telecommunications, healthcare, and financial services. Conversely, Lakewood has smaller industries focused primarily on retail, healthcare, and education.
Denver has a superior healthcare system with several large hospitals and clinics, including nationally recognized facilities like the UCHealth University of Colorado Hospital. Lakewood offers quality healthcare services but lacks the medical diversity and specialization found in Denver.
Health (county statistics)
Type
Denver
Lakewood
General health status score of residents in this county from 1 (poor) to 5 (excellent)
Denver boasts robust infrastructure with several hospitals, an international airport, a comprehensive public transit system, and a bustling downtown. Lakewood, while it has basic infrastructure, does not offer the same level of amenities as Denver.
Infrastructure
Type
Denver
Lakewood
Hospitals
16
3
TV stations
17
18
Bank branches located here
205
37
Bank institutions located here
43
15
Main business address for public companies
58
6
Drinking water stations with no reported violations in the past
8
11
Drinking water stations with reported violations in the past
HMDA - Conventional home purchase loans - Applications denied
Year
Denver
Lakewood
1999
2,727
494
2000
2,698
339
2001
1,996
244
2002
1,591
222
2003
2,472
416
2004
3,789
567
2005
5,168
696
2006
5,506
642
2007
3,599
418
2008
1,902
250
2009
768
92
Culture and Food
Culturally, Denver offers a more diverse scene with a thriving arts district, numerous museums, and a vibrant foodie scene. Lakewood has a quieter, more suburban culture with a few local dining gems, but lacks the culinary diversity of Denver.
Sports Teams
Denver is a sports city, hosting several professional sports teams including the Denver Broncos (NFL), Colorado Rockies (MLB), Denver Nuggets (NBA), and Colorado Avalanche (NHL). Lakewood, being a smaller city, does not have its own professional sports teams.


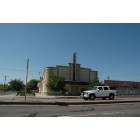

 Denver, CO
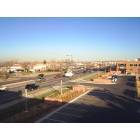
 Lakewood, CO