Denver and South Aurora are two locations in Colorado with their unique offerings. Denver, as a city, provides a more bustling urban atmosphere with diverse job opportunities, cultural experiences, and city-centric attractions. In contrast, South Aurora, a suburb, offers a quieter lifestyle, ideal for families or individuals seeking a more relaxed environment. Both have their pros and cons when it comes to crime rates, cost of living, weather, education, the economy, among others.
Denver, being a larger city, tends to have a slightly higher crime rate than South Aurora. The city has been actively investing in programs to reduce crime and improve safety. The police work closely with the community to protect the residents and tourists alike. Conversely, South Aurora is generally safer, with a lower crime rate, owing to its smaller size and suburban setting.
Cost of Living
The cost of living in Denver is generally higher than in South Aurora. Factors such as housing, dining, entertainment, and transportation contribute to Denver's higher cost of living, making South Aurora the more affordable choice.
Income Tax
As both cities are in Colorado, they share the same state income tax. There isn't a city-specific income tax in either Denver or South Aurora.
Property Tax
Property taxes in Denver are generally higher than in South Aurora, reflecting the higher property values in the city. South Aurora property owners will find their tax bills lesser in comparison.
Sales Tax
Both Denver and South Aurora have the same state sales tax rate as they are part of Colorado. However, Denver has a higher city sales tax than South Aurora leading to slighlty higher overall sales tax in Denver.
Income
Type
Denver
South Aurora
Estimated median household income
$81,630
$80,212
Estimated per capita income
$52,690
$39,129
Cost of living index (U.S. average is 100)
111.3
110.1
If you make $50,000 in South Aurora, you will have to make $50,545 in Denver to maintain the same standard of living.
Geographical Conditions
Denver is situated at the foot of the Rocky Mountains, offering several natural attractions and outdoor activities. South Aurora, while not as geographically diverse, does border the Cherry Creek State Park, which offers outdoor enjoyment for residents and visitors.
Geographical information
Type
Denver
South Aurora
Land area
153.4 sq. miles
78.4 sq. miles
Population density
4,639.5 people per sq. mile
4,199.1 people per sq. mile
Relative area comparison
Denver, CO South Aurora, CO
Education
Both cities boast high-quality education systems. Denver's public school district is larger and more diverse, offering many specialty programs for students. South Aurora is home to several top-rated schools, with their education system focusing on producing academically exceptional students.
Denver has a growing economy, primarily focused in the sectors of technology, aerospace, and healthcare. South Aurora also has a thriving economy, but with a stronger focus on retail and health care industries.
Biggest Employers
Denver's biggest employers include healthcare giants like Denver Health and Centura Health, along with renowned universities and tech companies. In South Aurora, the Cherry Creek School District and The Medical Center of Aurora are notable employers.
In Denver (Denver County), 73.9% voted for Democrats and 24.3% for Republicans in 2012 Presidential Election. In South Aurora (Arapahoe County), 54.4% voted for Democrats and 44.4% for Republicans.
Elections
Type
Democrats
Republicans
Other
Year
Denver
South Aurora
Denver
South Aurora
Denver
South Aurora
2020
80.1%
61.3%
18.3%
36.6%
1.6%
2.1%
2016
74.2%
53.1%
19.0%
38.9%
6.8%
8.1%
2012
73.9%
54.4%
24.3%
44.4%
1.7%
1.3%
2008
75.8%
56.0%
23.2%
43.0%
1.0%
1.0%
2004
69.7%
47.6%
29.3%
51.6%
0.9%
0.8%
2000
62.0%
43.6%
30.9%
51.6%
7.0%
4.8%
1996
61.8%
41.9%
30.0%
50.8%
8.2%
7.3%
Breakdown of population affiliated with a religious congregation
Type
Adherents
Congregations
Religion
Denver
South Aurora
Denver
South Aurora
CATHOLIC CHURCH
26.6%
12.1%
8.7%
4.3%
AMERICAN BAPTIST CHURCHES IN THE USA
2.1%
0.1%
4.3%
1.7%
EPISCOPAL CHURCH
1.1%
0.4%
3.2%
1.7%
SALVATION ARMY
1.1%
0.0%
0.7%
0.7%
SOUTHERN BAPTIST CONVENTION
0.9%
1.6%
6.8%
9.9%
SEVENTH DAY ADVENTIST CHURCH
0.7%
0.2%
3.0%
2.6%
MUSLIM ESTIMATE
0.5%
1.9%
0.9%
1.0%
EVANGELICAL LUTHERAN CHURCH IN AMERICA
0.4%
2.0%
2.7%
4.3%
LUTHERAN CHURCH
0.3%
1.0%
2.3%
2.6%
EVANGELICAL PRESBYTERIAN CHURCH
0.0%
0.6%
0.2%
2.6%
VINEYARD USA
0.0%
0.5%
0.2%
0.3%
Weather
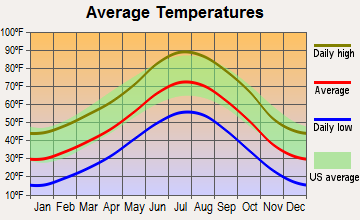
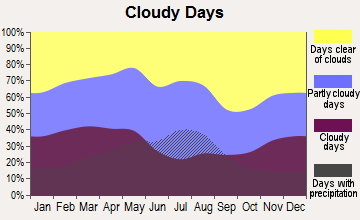
Both cities experience a typical Colorado climate, with cool, snowy winters, and warm, dry summers. Denver, being somewhat larger, has more urban heat islands, making it slightly warmer than South Aurora. South Aurora tends to have cooling effect due to its close proximity to the Cherry Creek State Park.
Weather and climate
Type
Denver
South Aurora
Temperature - Average
49.5°F
49.9°F
Humidity - Average morning or afternoon humidity
50.6%
50.6%
Humidity - Differences between morning and afternoon humidity
20%
20%
Humidity - Maximum monthly morning or afternoon humidity
55%
55%
Humidity - Minimum monthly morning or afternoon humidity
35%
35%
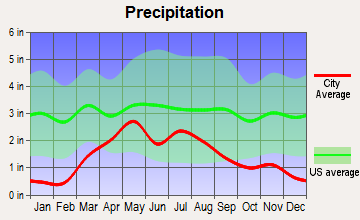
Precipitation - Yearly average
17 in
17.6 in
Snowfall - Yearly average
114 in
114 in
Clouds - Number of days clear of clouds
19.2%
19.2%
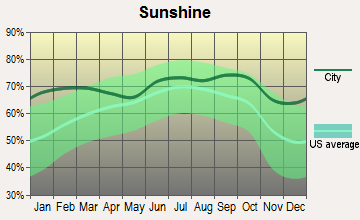
Sunshine amount - Average
75.6%
75.6%
Sunshine amount - Differences during a year
10%
10%
Sunshine amount - Maximum monthly
74%
74%
Sunshine amount - Minimum monthly
64%
64%
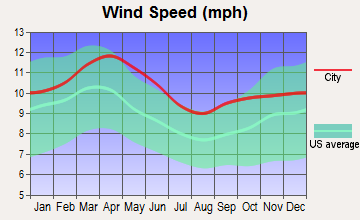
Wind speed - Average
8.6 mph
8.6 mph
Average climate in Denver, Colorado
Average climate in South Aurora, Colorado
Air pollution
Type
AQI
CO
NO2
OZONE
PB
PM10
PM25
SO2
Year
Denver
South Aurora
Denver
South Aurora
Denver
South Aurora
Denver
South Aurora
Denver
South Aurora
Denver
South Aurora
Denver
South Aurora
Denver
South Aurora
2018
100
99
0.50
0.37
25.4
21.6
27.9
31.9
N/A
N/A
29.2
29.2
8.6
8.5
0.7
0.7
2017
95
95
0.49
0.37
25.9
22.0
27.6
31.8
N/A
N/A
22.0
22.0
8.4
8.4
0.8
0.9
2016
90
90
0.53
0.43
27.7
24.0
27.2
31.3
N/A
N/A
22.6
22.6
8.7
8.1
1.0
1.0
2015
101
101
0.53
0.44
27.8
23.0
25.2
30.2
N/A
N/A
21.0
20.6
10.4
9.6
1.0
1.1
2014
94
94
0.53
0.43
25.4
22.0
24.6
30.3
N/A
N/A
25.1
22.7
10.1
10.1
1.3
1.3
2013
85
84
0.45
0.39
21.9
19.7
24.0
30.7
N/A
N/A
24.4
22.0
N/A
N/A
1.5
1.4
2012
91
90
0.33
0.34
18.9
18.9
26.2
31.4
N/A
N/A
24.9
24.3
N/A
N/A
1.4
1.2
2011
91
91
0.34
0.34
18.1
18.1
25.8
31.5
N/A
N/A
23.7
23.8
N/A
N/A
1.6
1.5
2010
82
81
0.43
0.41
16.3
16.3
23.6
29.3
N/A
N/A
26.4
26.6
N/A
N/A
1.0
1.0
2009
79
79
0.41
0.37
14.1
14.1
23.1
27.3
0.005
0.005
22.2
22.6
N/A
N/A
1.3
1.3
2008
85
85
0.43
0.41
17.3
17.3
26.0
29.1
0.008
0.008
25.2
25.5
N/A
N/A
1.6
1.6
2007
96
96
0.37
0.41
20.6
20.6
21.9
25.7
0.007
0.007
30.2
28.9
N/A
N/A
1.2
1.2
2006
89
89
0.51
0.50
19.0
19.0
22.1
25.4
0.008
0.026
28.0
28.0
N/A
N/A
1.4
1.4
2005
86
86
0.57
0.57
21.3
21.3
20.9
22.7
0.068
0.106
30.9
29.6
N/A
N/A
1.5
1.5
2004
82
82
0.60
0.61
21.2
21.2
19.2
21.6
0.012
0.035
28.6
28.6
N/A
N/A
1.8
1.8
2003
106
106
0.60
0.61
21.2
21.2
20.8
23.4
0.015
0.038
32.6
32.6
N/A
N/A
1.9
1.9
2002
86
86
0.65
0.64
19.2
19.2
20.4
23.0
0.014
0.027
35.7
35.7
N/A
N/A
2.5
2.5
2001
95
95
0.86
0.79
23.6
23.8
18.6
20.8
0.012
0.029
32.6
32.6
N/A
N/A
2.6
2.6
2000
93
93
0.81
0.77
13.4
13.7
19.2
21.7
0.013
0.032
12.2
12.2
N/A
N/A
2.1
2.1
Natural disasters
Type
Denver
South Aurora
Tornado activity compared to U.S. average
129.5%
137.7%
Earthquake activity compared to U.S. average
811.7%
797.1%
Natural disasters compared to U.S. average
10%
10%
Transportation
Denver has a more comprehensive public transit system, including light rail, buses, and bike-share programs, making commuting easier. South Aurora has more dependence on cars, but it does offer access to public transit options, albeit limited.
Transport
Type
Denver
South Aurora
Amtrak stations
2
0
Amtrak stations nearby
2
2
FAA registered aircraft
602
0
FAA registered aircraft manufacturers and dealers
28
0
Means of transportation to work
Type
Denver
South Aurora
Bicycle
1.5%
0.2%
Bus
2.6%
3.5%
Carpooled
8.8%
12%
Car alone
81.1%
78.6%
Railroad
1.2%
0%
Streetcar
0.2%
0%
Taxicab
0.1%
0.1%
Walked
2.8%
1.3%
Average travel time to work
Type
Denver
South Aurora
Average
29.4 min
27.5 min
Real Estate
Real estate prices are generally higher in Denver due to its city setting, with a mix of condos, apartments, and single-family homes. South Aurora has a more suburban real estate scene, offering larger lots and homes at a more affordable price.
Neighborhoods
Denver has a variety of neighborhoods, each with its unique charm, from the artsy RiNo district to the sophisticated Cherry Creek. South Aurora, being a suburb, has more family-oriented neighborhoods with quieter, tree-lined streets and larger homes.
Houses and residents
Type
Denver
South Aurora
Houses
351,829
119,373
Average household size (people)
2.2
2.6
Houses occupied
326,634 (92.8%)
115,977 (97.2%)
Houses occupied by owners
164,429 (50.3%)
76,163 (65.7%)
Houses occupied by renters
162,205 (49.7%)
39,814 (34.3%)
Median rent asked for vacant for-rent units
$1,674
$1,519
Median price asked for vacant for-sale houses and condos
$970,375
$836,561
Estimated median house or condo value
$541,500
$439,151
Median number of rooms in apartments
3.5
3.9
Median number of rooms in houses and condos
6.4
7.2
Renting percentage
50%
38.4%
Housing density (houses/condos per square mile)
2,294.3
1,522.9
Household income disparities
44%
40.8%
Housing units without a mortgage
2,112 (1.7%)
6,903 (10.6%)
Housing units with both a second mortgage and home equity loan
9,615 (7.6%)
358 (0.6%)
Housing units with a mortgage
123,690 (98.3%)
57,942 (89.4%)
Housing units with a home equity loan
273 (0.2%)
5,373 (8.3%)
Housing units with a second mortgage
12,819 (10.2%)
10,116 (15.6%)
Housing units lacking complete kitchen facilities
1.3%
0.4%
Housing units lacking complete plumbing facilities
Self-employed workers in own not incorporated business
24,661
8,665
State government workers
15,204
4,200
Unpaid family workers
763
351
Industries and Occupations
In Denver, the leading industries are technology, aerospace, and healthcare, offering a variety of high-paying jobs. South Aurora has a diverse economy with retail, healthcare, and education as significant employers.
Denver has some of the best healthcare facilities in the state with world-class hospitals, clinics, and research centers. South Aurora also offers excellent healthcare, with The Medical Center of Aurora being a significant provider.
Health (county statistics)
Type
Denver
South Aurora
General health status score of residents in this county from 1 (poor) to 5 (excellent)
Denver prides in its well-developed infrastructure, with a mix of historic and modern buildings, and a comprehensive public transportation system. South Aurora, as a suburb, has infrastructure suited to a more residential lifestyle, with a solid spread of parks, recreation areas, and shopping destinations.
Infrastructure
Type
Denver
South Aurora
TV stations
17
14
Culture and Food
Denver is known for its vibrant food scene, craft breweries, and diverse cultural offerings, including museums, art galleries, and music festivals. South Aurora has a more subdued culture, but does offer a variety of cuisines, mostly in family-friendly restaurants and local eateries.
Sports Teams
As a major city, Denver is home to several professional sports teams, including the Denver Broncos (NFL), Denver Nuggets (NBA), and Colorado Rockies (MLB). South Aurora does not have any professional sports teams but does offer recreational sports programs for residents.
 Denver, CO
 South Aurora, CO